. 2024 Nov;25(11):4979-5005.
doi: 10.1038/s44319-024-00280-w. Epub 2024 Oct 7.

Recognition of phylogenetically diverse pathogens through enzymatically amplified recruitment of RNF213

Affiliations

Recognition of phylogenetically diverse pathogens through enzymatically amplified recruitment of RNF213

Ana Crespillo-Casado et al. EMBO Rep. 2024 Nov.

Abstract

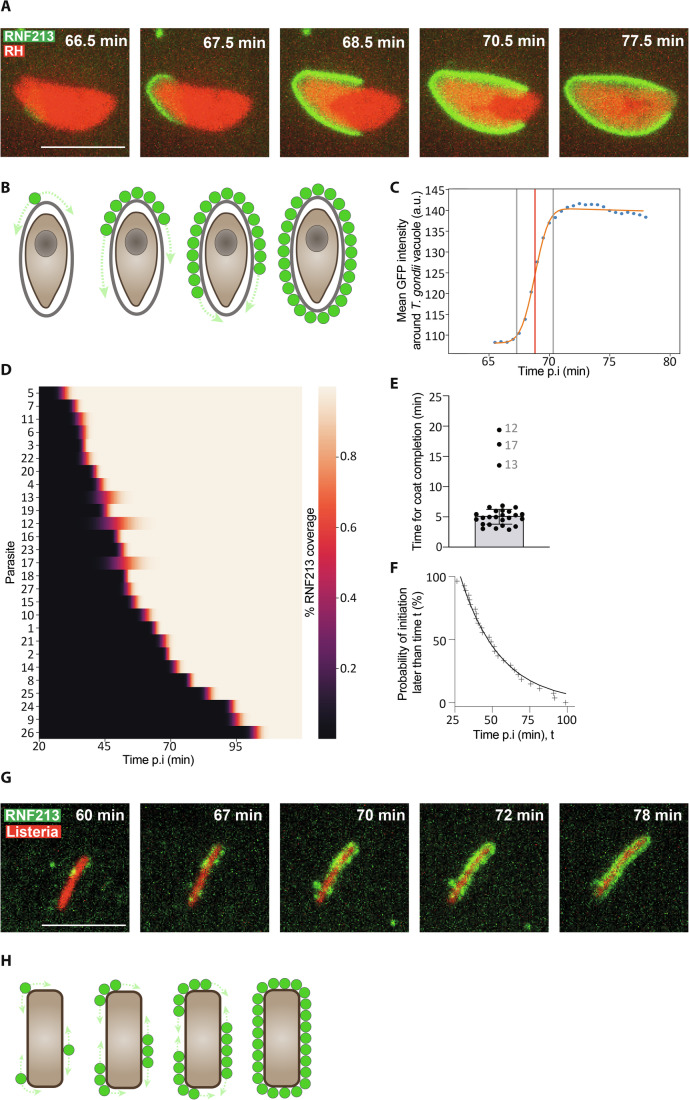
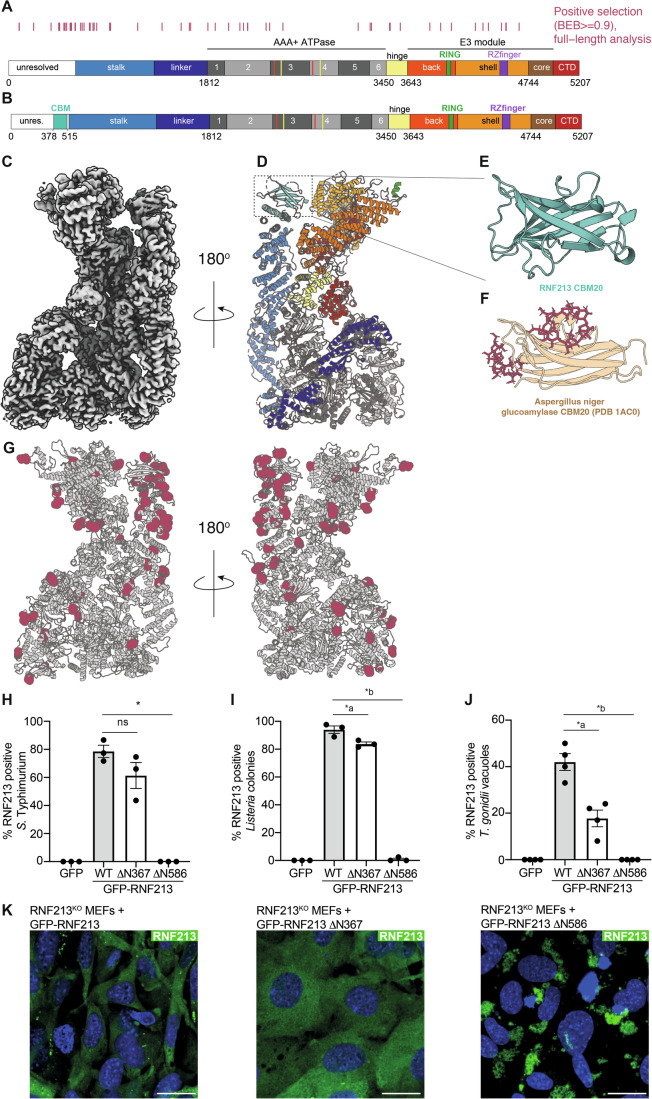
Innate immunity senses microbial ligands known as pathogen-associated molecular patterns (PAMPs). Except for nucleic acids, PAMPs are exceedingly taxa-specific, thus enabling pattern recognition receptors to detect cognate pathogens while ignoring others. How the E3 ubiquitin ligase RNF213 can respond to phylogenetically distant pathogens, including Gram-negative Salmonella, Gram-positive Listeria, and eukaryotic Toxoplasma, remains unknown. Here we report that the evolutionary history of RNF213 is indicative of repeated adaptation to diverse pathogen target structures, especially in and around its newly identified CBM20 carbohydrate-binding domain, which we have resolved by cryo-EM. We find that RNF213 forms coats on phylogenetically distant pathogens. ATP hydrolysis by RNF213's dynein-like domain is essential for coat formation on all three pathogens studied as is RZ finger-mediated E3 ligase activity for bacteria. Coat formation is not diffusion-limited but instead relies on rate-limiting initiation events and subsequent cooperative incorporation of further RNF213 molecules. We conclude that RNF213 responds to evolutionarily distant pathogens through enzymatically amplified cooperative recruitment.

Keywords: Host-pathogen Interaction; Innate Immunity; Pattern Recognition Receptor; Positive Selection; Ubiquitylation.


Conflict of interest statement

The authors declare no competing interests.

Figures

Figure 1
Figure 1. RNF213 recruitment to phylogenetically distant pathogens.
(A) Confocal micrographs of RNF213KO MEFs stably expressing GFP-RNF213, stained with anti-ubiquitin (FK2) antibody and DAPI. Cells were fixed at 4 h post-infection with mCherry-expressing S. Typhimurium, 6 h post-infection with mCherry-expressing L. monocytogenes ΔActA and 24 h post-infection with Tomato-expressing T. gondii Type I strain RH or Type II strain Pru. Regions marked with white borders in the main images are shown magnified on the right. Scale bar, 10 µm (magnification box scale bar, 5 µm). (B) Percentage of cytosolic S. Typhimurium, L. monocytogenes ΔActA colonies or T. gondii vacuoles positive for GFP-RNF213 at 4 h, 6 h or 1 h p.i., respectively, in RNF213KO MEFs stably expressing GFP-RNF213 treated or not with IFNγ. Mean +/− SEM of n = 9 (S. Typhimurium), n = 3 (L. monocytogenes) and n = 3 (T. gondii) independent biological experiments, each performed as technical triplicates and assessing n > 100 bacteria and n > 250 parasites per experiment. (C) Representative confocal micrographs of WT and RNF213KO MEFs infected with mCherry-expressing L. monocytogenes ΔActA and stained at 6 h p.i. with anti-ubiquitin (FK2) antibody and DAPI. Columns on the right represent magnified regions marked with white borders in main image. Scale bar, 20 µm (magnification box scale bar, 5 µm). (D) Percentage of L. monocytogenes ΔActA colonies positive for ubiquitin (FK2) at 6 h post-infection in WT and RNF213KO MEFs. Mean +/− SEM of n = 3 independent biological experiments, each performed as technical triplicates. n > 100 colonies per experiment. Two-tailed paired Student t-test, *p = 0.0247. (E) Percentage of T. gondii Type I RH strain or Type II Pru strain positive for ubiquitin (FK2) at 1 h post-infection in WT MEFs treated or not with IFNγ. Mean +/− SEM of n = 3 independent biological experiments, each performed in technical triplicates and assessing n > 250 parasites per experiment. Two-tailed paired Student t-test, *p = 0.0098. Source data are available online for this figure.
Figure 2
Figure 2. RNF213 coats form through rate-limiting initiation events and cooperative expansion.
(A) Still images from Movie EV1. Instant structured illumination microscopy (I-SIM) of RNF213KO MEFs stably expressing GFP-RNF213 and infected with Tomato-expressing T. gondii Type I RH strain. Times after infection are as indicated. Scale bar, 5 μm. (B) Model for the formation of RNF213 coats on the parasitophorous vacuole of T. gondii. (C) Kinetics of GFP-RNF213 accumulation on a T. gondii vacuole. Data extracted from parasite 2 in Movie EV1 (also shown in Fig. 2A). Dots represent the measured GFP intensity. An error function was fitted (orange line) to calculate the 5% and 95% of maximum coat formation (vertical grey lines) as well as the midpoint (vertical red line). (D) Heatmap of RNF213 coat formation on 27 T. gondii parasites over time. Percentage of RNF213 coverage (low to high) is represented as a colour gradient (black to white). Parasites ordered by midpoint of coat formation. n = 6 biological experiments; parasites 1 and 2 from experiment 1; parasites 3 and 4 from experiment 2; parasites 5 to 10 from experiment 3; parasite 11 from experiment 4; parasites 12 to 21 from experiment 5; parasites 22 to 27 from experiment 6. Primary data for all parasites in Fig. EV2. Parasites 1 and 2 are also shown in Movie EV1, parasite 2 in Fig. 2A,C. (E) Time required for coat formation of the 27 parasites shown in Fig. 2D. Outliers are numbered; Median ± MAD (mean absolute deviation). (F) Likelihood of RNF213 coat formation on T. gondii parasitophorous vacuoles. ‘+’ symbols represent the initiation time point of coat formation, equivalent to 5% of maximal GFP-RNF213 intensity from the per-parasite coating curve fits (Fig. EV2). The black line represents the probability distribution P(T_initiation > t) = exp(−(t−t0)/T) for the time of first arrival of an event obeying Poisson statistics, where t0 is an arbitrary time offset of the start of the observation and T the time constant of the Poisson process (see Methods). The fit describes the observation with R2 = 98% for T = 27 ± 1 min. (G) Still images from Movie EV2. Instant structured illumination microscopy (I-SIM) of RNF213KO MEFs stably expressing GFP-RNF213 and infected with mCherry-expressing L. monocytogenes ΔActA. Scale bar, 5 μm. (H) Model for the formation of RNF213 coats on L. monocytogenes. Source data are available online for this figure.
Figure 3
Figure 3. The CBM20 domain and the adjacent stalk region in the N-terminus of RNF213 are under strong positive selection.
(A) Residues with a high probability (Bayes Empirical Bayes posterior probability ≥ 0.9) of having evolved under positive selection among 24 simian primate species are indicated by red tick marks above a cartoon of RNF213. Numbers refer to human amino acids mapped onto domain boundaries obtained from the murine RNF213 structure (PDB 6TAX). Critical residues in the Walker A (K2426 and K2775) and Walker B motifs (E2488 and E2845) of catalytically active AAA+ ATPase domains are highlighted with red and yellow lines, respectively. Results are similar even if the alignment is split into segments that are free from any evidence of recombination (Fig. EV3A,B, Appendix Table S1). (B) Cartoon representation of human RNF213 domains, using the human structure (PDB 8S24) as reference. The newly solved CBM20 domain is indicated. (C) Surface representation of the composite cryo-EM density map of human RNF213. (D) Cartoon representation of the human RNF213 structure, rotated 180° relative to Fig. 3C. Colours match domains in Fig. 3B. (E) CBM20 domain of RNF213 as predicted by AlphaFold. (F) CBM20 of glucoamylase from Aspergillus niger (PDB 1AC0). Sugars shown as sticks. (G) Cartoon representation of human RNF213 with docked AlphaFold prediction. Positively selected residues are highlighted as red spheres. (H) Percentage of cytosolic S. Typhimurium positive for GFP-RNF213 at 4 h post-infection in RNF213KO MEFs stably expressing the specified GFP-RNF213 alleles. Mean +/− SEM of n = 3 independent biological experiments, each performed in technical triplicates. n > 100 bacteria per coverslip. One-way ANOVA test, *p = 8.3 × 10⁻⁵. (I) Percentage of L. monocytogenes ΔActA colonies positive for GFP-RNF213 at 6 h post-infection in RNF213KO MEFs stably expressing the specified GFP-RNF213 alleles. Mean +/− SEM of n = 3 independent biological experiments, each performed in technical triplicates. n > 100 colonies per experiment. One-way ANOVA test, *a p = 0.0042, *b p = 4.8 × 10⁻⁷. (J) Percentage of T. gondii Type I RH vacuoles positive for GFP-RNF213 at 1 h post-infection in RNF213KO MEFs stably expressing the specified GFP-RNF213 alleles. Mean +/− SEM of n = 16 positions automatically acquired and counted per triplicate wells in n = 4 independent biological experiments. One-way ANOVA test, *a p = 6.1 × 10⁻⁶, *b p = 7.4 × 10⁻⁶. (K) Confocal micrographs of RNF213KO MEFs stably expressing the indicated GFP-tagged RNF213 variants. Scale bar, 20 µm. Source data are available online for this figure.
Figure 4
Figure 4. Enzymatic activity in RNF213 is required for coat formation on pathogens.
(A, B) RNF213KO MEFs expressing the indicated GFP-RNF213 alleles. (A) Percentage of L. monocytogenes ΔActA colonies positive for GFP-RNF213 at 6 h post-infection. Mean +/− SEM of n = 3 independent biological experiments, each performed in technical triplicates. n > 100 colonies per experiment. One-way ANOVA test (*a p = 8 × 10⁻¹³; *b p = 1.4 × 10⁻¹²; *c p = 9 × 10⁻¹³; *d p = 9 × 10⁻¹³). (B) Percentage of T. gondii Type I RH vacuoles positive for GFP-RNF213 at 1 h post-infection. Mean +/− SEM of n = 16 positions, automatically acquired and counted, from triplicate wells in n = 4 independent biological experiments. One-way ANOVA test (*a p = 1.6 × 10⁻⁷; *b p = 2 × 10⁻⁶; *c p = 2.6 × 10⁻⁷; *d p = 7.3 × 10⁻⁸). (C) Structure of the RZ domain. Top panel: Cartoon representation of the structure of human RNF213, determined by cryo-EM. RZ domain, E3 module, hinge domain and CTD highlighted in different colours. Insert: Cryo-EM density and partly resolved RZ domain. Dotted lines link the resolved part of the RZ domain to the C-lobe of the E3 shell domain. Middle and bottom panel: AlphaFold prediction of the RZ domain, positioned as in the insert (middle panel) and rotated (bottom panel). Note the positioning of H4509, C4505, C4525 and C4528, predicted to form a metal ion binding site, and of C4516 and H4537, predicted to act as nucleophile and general base in the E2-E3 transthiolation and E3-substrate ubiquitin transfer reactions, respectively. (DF) RNF213KO MEFs expressing the indicated GFP-RNF213 alleles. (D) Percentage of cytosolic S. Typhimurium positive for GFP-RNF213 and ubiquitin (FK2) at 4 h post-infection. Mean +/− SEM of n = 3 independent biological experiments, each performed in technical triplicates. n > 100 bacteria per coverslip. One-way ANOVA test (*a p = 1.5 × 10⁻⁶; *b p = 1.0 × 10⁻⁶). (E) Percentage of L. monocytogenes ΔActA colonies positive for GFP-RNF213 and ubiquitin (FK2) at 6 h post-infection. Mean +/− SEM of n = 3 independent biological experiments, each performed in technical triplicates. n > 100 colonies per experiment. One-way ANOVA test (*a p = 0.000024; *b p = 0.000025). (F) Percentage of T. gondii Type I RH vacuoles positive for GFP-RNF213 and ubiquitin (FK2) at 1 h post-infection. Mean +/− SD of n = 3 independent biological experiments, each performed in technical triplicates. n > 200 parasites per coverslip. One-way ANOVA test, RNF213 positive T. gondii vacuoles; *a p = 2.5 ×10⁻⁶; *b p = 1.2 ×10⁻⁵; *c p = 0.025; *d p = 0.0029. Ubiquitin positive T. gondii vacuoles *a p = 3 × 10⁻⁷; *b p = 1.7 × 10⁻⁶; *c p = 6.5 × 10⁻⁹; *d p = 6.7 × 10⁻⁹. Source data are available online for this figure.
Figure EV1
Figure EV1. RNF213 accumulates on phylogenetically distant pathogens.
(A) Confocal micrographs of HeLa cells infected with S. Typhimurium for 4 h and L. monocytogenes or T. gondii infected for 6 h. Cells were stained with anti-RNF213 antibody. Scale bar 20 µm (magnification box scale bar; 5 µm). (B) Confocal micrographs representative of quantifications shown in Fig. 1E. MEFs stimulated with IFNγ as indicated, infected with Tomato-expressing T. gondii Type I RH or Type II Pru for 1 h and stained with anti-ubiquitin (FK2) antibody and DAPI. Regions marked with white borders in the main images are shown magnified on the right. Scale bar 80 µm (magnification box, scale bar; 20 µm). Source data are available online for this figure.
Figure EV2
Figure EV2. Kinetics of GFP-RNF213 accumulation on individual T. gondii vacuoles.
Kinetics of GFP-RNF213 accumulation on T. gondii vacuoles. Dots represent the measured GFP intensity. An error function was fitted (orange line) to calculate the 5% and 95% of maximum coat formation (vertical grey lines) as well as the midpoint (vertical red line). Time required for coat completion (5% to 95% of maximum fluorescence) is annotated above the graphs. n = 6 biological experiments; parasites 1 and 2 from experiment 1; parasites 3 and 4 from experiment 2; parasites 5 to 10 from experiment 3; parasite 11 from experiment 4; parasites 12 to 21 from experiment 5; parasites 22 to 27 from experiment 6. Acquisition started at 60 min, 30 min, 23 min, 24 min, 30 min and 19 min p.i, respectively. Experiments 1 and 2 were acquired on a Nikon iSIM swept field high speed inverted microscope with a 100X super resolution Apo TIRF oil objective, experiments 3 to 6 on a Nikon X1 Spinning Disk inverted microscope with a 40x/1.3NA Oil lens. Source data are available online for this figure.
Figure EV3
Figure EV3. Positive selection in GARD-identified RNF213 segments and cryo-EM analysis of RNF213.
(A) The GARD algorithm detects evidence of possible recombination among RNF213 simian primate orthologs, with an evidence ratio of >100. Schematic of the 6 segments identified by GARD, and the phylogenies for each segment according to GARD. Differences between segment topologies are mostly subtle, in basal branches of the tree. (B) Repeat of codeml analysis, performed individually on each of the 6 GARD segment alignments. Segments 1–5 all showed evidence of positive selection (Appendix Table S1). Indicated with red tick marks are residues with high probability (Bayes Empirical Bayes posterior probability ≥0.9) of evolving under positive selection identified by GARD segment and full-length analysis, as indicated. Analysing the 6 GARD segments separately appears to increase the statistical power of codeml to identify rapidly evolving sites: across the 5 segments, a total of 86 sites have ≥90% posterior probability (Bayes Empirical Bayes) of evolving under positive selection, in contrast to 59 sites when analyzing the full-length alignment. (C) Composite map of RNF213 created by local refinement of individual color-coded domains. (D) Composite map of RNF213 coloured by local resolution, calculated using ResMap (Kucukelbir et al, 2014). (E) Fourier shell correlation between the two consensus half-maps (solid black line), and between the composite map and the refined atomic model (solid grey line), is plotted as a function of resolution. The Fourier shell correlations for each pair of locally refined half maps are shown with the dashed lines, coloured according to the domains in (A). (F) Orientation distribution of the RNF213 particles used in the consensus refinement shown on a Mollweide projection plot, coloured in blue to red from low to high density, and has an efficiency E = 0.8, calculated using cryoEF (Naydenova and Russo, 2017).
Figure EV4
Figure EV4. Enzymatic activity in RNF213 is required for coat formation on pathogens.
Confocal micrographs representative of quantifications shown in Fig. 4D–F. RNF213KO MEFs complemented with the indicated GFP-RNF213 alleles and stained with anti-ubiquitin antibody (FK2) and DAPI at 4 h post-infection with mCherry-expressing S. Typhimurium (A), 6 h post-infection with mCherry-expressing L. monocytogenes ΔActA (B) and 1 h post-infection with Tomato-expressing T. gondii RH Type I strain (C). Regions marked with white borders in the main images are shown magnified on the right. Scale bar, 20 µm (magnification box scale bar, 10 µm). Source data are available online for this figure.

References

    1. Afonine PV, Poon BK, Read RJ, Sobolev OV, Terwilliger TC, Urzhumtsev A, Adams PD (2018) Real‐space refinement in PHENIX for cryo‐EM and crystallography. Acta Crystallogr Sect D 74:531–544 - PMC - PubMed
    1. Ahel J, Fletcher A, Grabarczyk DB, Roitinger E, Deszcz L, Lehner A, Virdee S, Clausen T (2021) E3 ubiquitin ligase RNF213 employs a non-canonical zinc finger active site and is allosterically regulated by ATP. Preprint at 10.1101/2021.05.10.443411
    1. Ahel J, Lehner A, Vogel A, Schleiffer A, Meinhart A, Haselbach D, Clausen T (2020) Moyamoya disease factor RNF213 is a giant E3 ligase with a dynein-like core and a distinct ubiquitin-transfer mechanism. Elife 9:e56185 - PMC - PubMed
    1. Altschul SF, Madden TL, Schäffer AA, Zhang J, Zhang Z, Miller W, Lipman DJ (1997) Gapped BLAST and PSI-BLAST: a new generation of protein database search programs. Nucleic Acids Res 25:3389–3402 - PMC - PubMed
    1. Anisimova M, Nielsen R, Yang Z (2003) Effect of recombination on the accuracy of the likelihood method for detecting positive selection at amino acid sites. Genetics 164:1229–1236 - PMC - PubMed

Substances

LinkOut - more resources