. 2024 Dec;34(12):830-845.
doi: 10.1038/s41422-024-01034-y. Epub 2024 Oct 8.

GeneCompass: deciphering universal gene regulatory mechanisms with a knowledge-informed cross-species foundation model

Collaborators, Affiliations

GeneCompass: deciphering universal gene regulatory mechanisms with a knowledge-informed cross-species foundation model

Xiaodong Yang et al. Cell Res. 2024 Dec.

Abstract

Deciphering universal gene regulatory mechanisms in diverse organisms holds great potential for advancing our knowledge of fundamental life processes and facilitating clinical applications. However, the traditional research paradigm primarily focuses on individual model organisms and does not integrate various cell types across species. Recent breakthroughs in single-cell sequencing and deep learning techniques present an unprecedented opportunity to address this challenge. In this study, we built an extensive dataset of over 120 million human and mouse single-cell transcriptomes. After data preprocessing, we obtained 101,768,420 single-cell transcriptomes and developed a knowledge-informed cross-species foundation model, named GeneCompass. During pre-training, GeneCompass effectively integrated four types of prior biological knowledge to enhance our understanding of gene regulatory mechanisms in a self-supervised manner. By fine-tuning for multiple downstream tasks, GeneCompass outperformed state-of-the-art models in diverse applications for a single species and unlocked new realms of cross-species biological investigations. We also employed GeneCompass to search for key factors associated with cell fate transition and showed that the predicted candidate genes could successfully induce the differentiation of human embryonic stem cells into the gonadal fate. Overall, GeneCompass demonstrates the advantages of using artificial intelligence technology to decipher universal gene regulatory mechanisms and shows tremendous potential for accelerating the discovery of critical cell fate regulators and candidate drug targets.


Conflict of interest statement

Competing interests: The authors declare no competing interests.

Figures
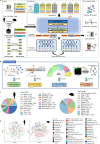
Fig. 1
Fig. 1. GeneCompass architecture and pre-training corpus.
a The framework of GeneCompass. The model was pre-trained on large-scale single-cell transcriptomes of humans and mice and used for multiple downstream tasks, including cell-type annotation, perturbation prediction, dosage response prediction, GRN inference, and etc. b Embedding of four types of prior knowledge, including GRN, promoter sequence, gene family and co-expression. c Organ types of humans and mice in scCompass-126M. d Uniform Manifold Approximation and Projection of different cell types of a sampled subset from scCompass-126M.
Fig. 2
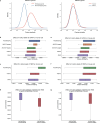
Fig. 2. Analysis of gene embedding generated from GeneCompass.
a Cosine similarity between homologous genes as well as non-homologous ones of different species (left panel), and that between different genes in the same mouse or human cell (right panel). b, c Effects of in silico deletion of GATA4 and TBX5 on different gene types, including their direct targets, indirect targets, NOTCH1 targets, NKX2-5 targets and housekeeping genes in human cardiomyocytes, respectively. d Effects of the individual and combined deletion of GATA4 and TBX5 as well as their combinatorial deletion with other genes that are not known to co-bind housekeeping genes and target genes in humans. e, f Effects of in silico deletion of GATA4 and TBX5 on different gene types, including their direct targets, indirect targets, NOTCH1 targets, NKX2-5 targets and housekeeping genes in mice which are obtained by homologous mapping. g Effects of the combined deletion of GATA4 and TBX5 on housekeeping genes and co-bound target genes in mice. (*P < 0.05, wilcoxon-test, NS no significance).
Fig. 3
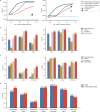
Fig. 3. GeneCompass boosts the performance of cell-type annotations from single species to cross species.
a Comparison of the performance of GeneCompass and other baseline methods on the downstream task of cell type annotation in the human multiple sclerosis (hMS) dataset. GeneCompass was pre-trained using human & mouse (HM, black line), human (H, blue line), and mouse (M, red line) single-cell transcriptome corpus with different cell numbers. The green circle point and green square point represent Geneformer and scGPT, respectively. “Layers6” denotes GeneCompass with a 6-layer transformer. b Comparison of the performance of GeneCompass and other baseline methods on hMS, hLung, and hLiver datasets. c Comparison of the performance of GeneCompass and other baseline methods on mBrain, mLung, and mPancreas datasets. d Comparison of the performance of GeneCompass+CAME with original CAME on cross-species cell type annotation (Mouse and human data were used as reference and target species, respectively). A 7.5% improvement was observed in NMDA-Mnseq, a retina dataset (the first column). The datasets in bd derived from humans and mice are marked as “h” and “m”, respectively. Detailed information on datasets can be found in the Supplementary Methods. “Without pre-training” denotes that the parameters of GeneCompass were randomly initialized and fine-tuned directly without the pre-training process.
Fig. 4
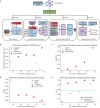
Fig. 4. GeneCompass demonstrates enhanced performance for GRN inference, drug dose response prediction, gene expression profile prediction, and gene dosage sensitivity prediction tasks.
a The workflow of integrating gene embeddings generated from GeneCompass to four downstream tasks: GRN inference, drug dose response prediction, gene expression profiling and gene dosage sensitivity prediction. b Performance comparison of each model on the GRN inference task in terms of AUPRC. The red line denotes the results of GeneCompass trained by different amounts of data. The blue, orange and brown dots represent results of DeepSEM, scGPT and Geneformer, respectively. c Performance comparison, in terms of R-squared value, for each model is conducted on the drug dose response prediction task. The red line denotes the results of GeneCompass trained by different amounts of data. The green and blue dots represent results of scGPT and Geneformer, respectively. d Performance comparison of each model on the gene expression profile prediction task. Root Mean Squared Error is applied as the metric. The red line denotes the results of GeneCompass trained by different amounts of data. The blue, green and brown dots represent results of DeepCE, scGPT and Geneformer, respectively. e Performance comparison of each model on the dosage sensitivity prediction task. We use AUC as the metric. The red and blue lines denote the results of GeneCompass and Geneformer, respectively, trained by different amounts of data. The dashed line represents the result of GeneCompass without pretraining.
Fig. 5
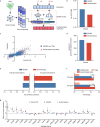
Fig. 5. GeneCompass shows enhanced performance for the gene perturbation prediction task.
a The workflow of GeneCompass for the perturbation prediction task. b MSE in predicting the expression changes in the top 20 DEGs by GeneCompass and GEARS. MSE only considered on the top 20 most DEGs. c Scatter plot of the predicted and true changes in gene expression. Each dot represents a specific gene, and Spearman’s correlation is marked as “ρ”. d Total number of the top 20 DEGs genes where the predicted post-perturbation differential expression was in the incorrect direction of the ground truth. e Expression deviation between the predicted and true changes in gene expression for the top 20 DEGs analyzed by GeneCompass and GEARS. f Percentage of perturbations that exhibited a smaller deviation between the prediction results and ground truth when comparing GeneCompass with GEARs, using the deviation in the top 20 DEGs as the criterion. “GeneCompass better” is defined as GeneCompass having a smaller deviation than GEARS. g Expression changes for the combined TGFBR2 and PRTG perturbation in true experiment post perturbation were predicted by GeneCompass and GEARS. The grey error bar denotes the ground truth of mean gene expression change with standard deviation after perturbing the gene combination TGFBR2 and PRTG (n = 205). The red triangle symbol shows the gene expression change predicted by GeneCompass with TGFBR2 and PRTG perturbation excluded during training. The blue square symbol shows the gene expression change predicted by GEARS.
Fig. 6
Fig. 6. In silico quantitative perturbation for cell reprogramming and differentiation.
a Diagram of in silico cell fate transition. In silico knockout or overexpression experiment is performed by removing or shifting the highlighted gene in red forward within the ranking genes. b In silico low-level or high-level overexpression of OSKM is performed in human (upper) or mouse (bottom) fibroblasts to calculate the cosine similarity of the simulated cell states with iPSCs. In silico overexpression of four other random genes is used as control. In each simulation group, all embedding pairs between perturbed fibroblast cells and iPSCs are used to compute the cosine similarity. The cosine similarity of all pairs in each group is simultaneously presented using probability density and box plots. c Distribution of candidate genes that drive the shift of cell embeddings towards Leydig cell status and gonadal progenitor status in response to in silico overexpression in human ESC cells. Top 50 genes shifting towards Leydig cell (lower) or gonadal progenitor (upper) status and away from the ESC status are presented. Five genes in the intersection set of Venn diagram are selected as candidate genes for gonadal differentiation. d Protein co-immunofluorescence staining for markers of interstitial/Leydig lineage and Sertoli cells with GATA4 (GATA4+, red; TCF21+, green; NR2F2/NR2F1+, cyan),). Scale bars: 100μm e The identification of upregulated gonadal lineage-related marker genes in the GATA4 overexpression group compared to cells derived from wild-type ESCs, with fold changes exceeding 2-fold. f Gene ontology (GO) enrichment analysis was performed using DAVID for the total up-regulated genes with a 2-fold change in the GATA4 overexpression group compared to cells derived from wild-type ESCs. (*P < 0.05, Wilcoxon-test).

References

    1. Almanzar, N. et al. A single-cell transcriptomic atlas characterizes ageing tissues in the mouse. Nature583, 590–595 (2020). - PMC - PubMed
    1. Regev, A. et al. The human cell atlas. Elife6, e27041 (2017). - PMC - PubMed
    1. Hwang, B., Lee, J. H. & Bang, D. Single-cell RNA sequencing technologies and bioinformatics pipelines. Exp. Mol. Med.50, 1–14 (2018). - PMC - PubMed
    1. Zhu, C., Preissl, S. & Ren, B. Single-cell multimodal omics: the power of many. Nat. Methods17, 11–14 (2020). - PubMed
    1. Li, M. & Belmonte, J. C. I. Ground rules of the pluripotency gene regulatory network. Nat. Rev. Genet.18, 180–191 (2017). - PubMed

LinkOut - more resources