. 2024 Oct 7;14(1):23362.
doi: 10.1038/s41598-024-74098-w.

Identifying patient subgroups in MASLD and MASH-associated fibrosis: molecular profiles and implications for drug development

Affiliations

Identifying patient subgroups in MASLD and MASH-associated fibrosis: molecular profiles and implications for drug development

Manuel A González Hernández et al. Sci Rep. .

Abstract

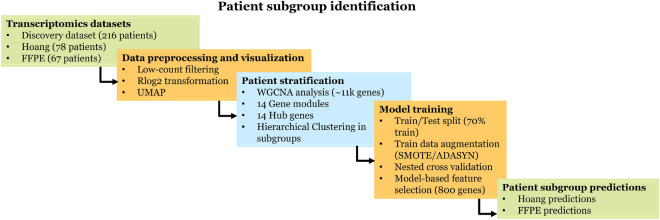
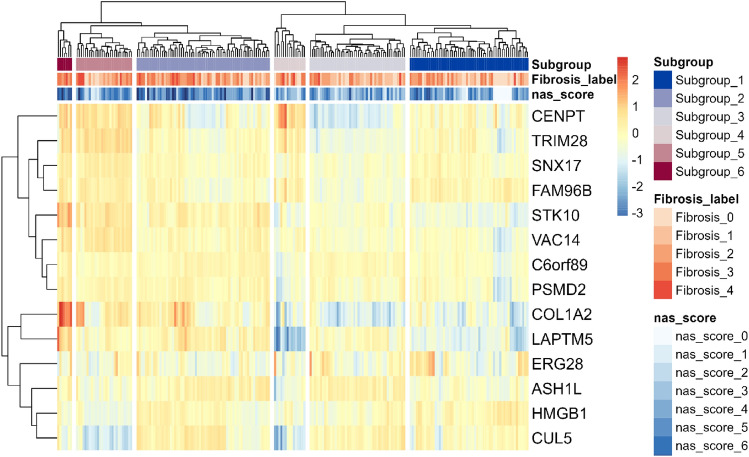
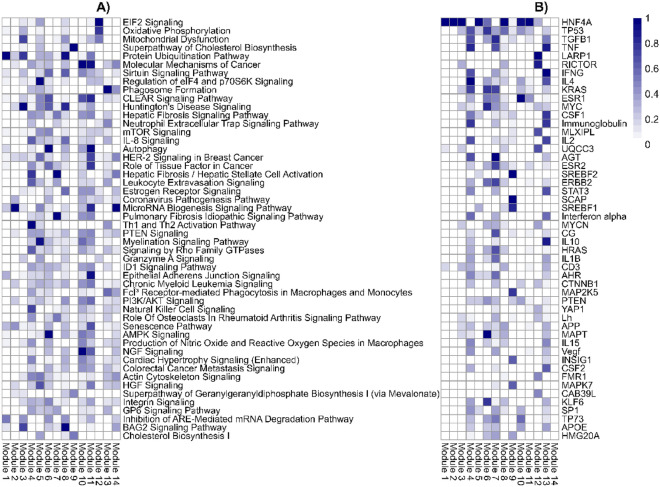
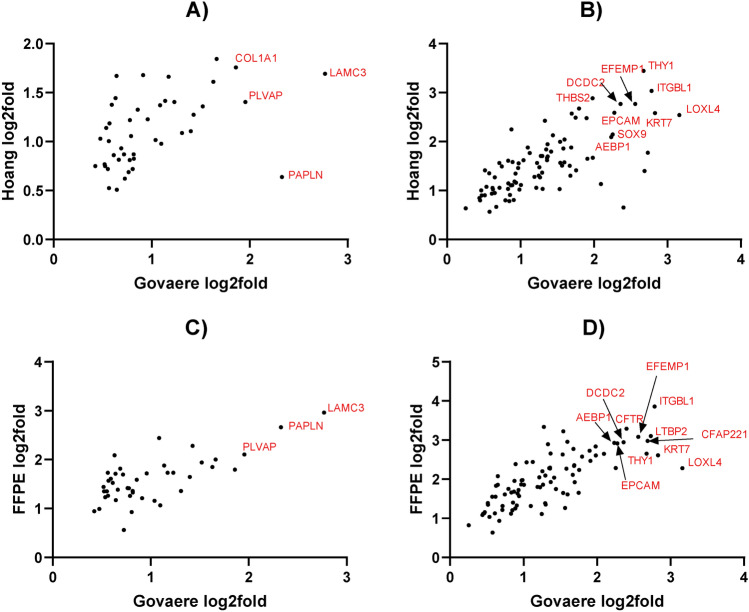
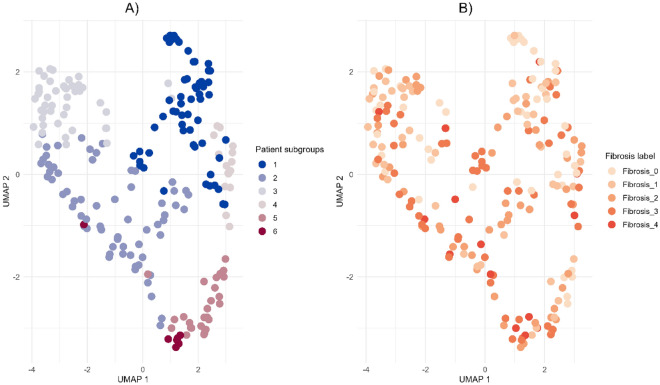
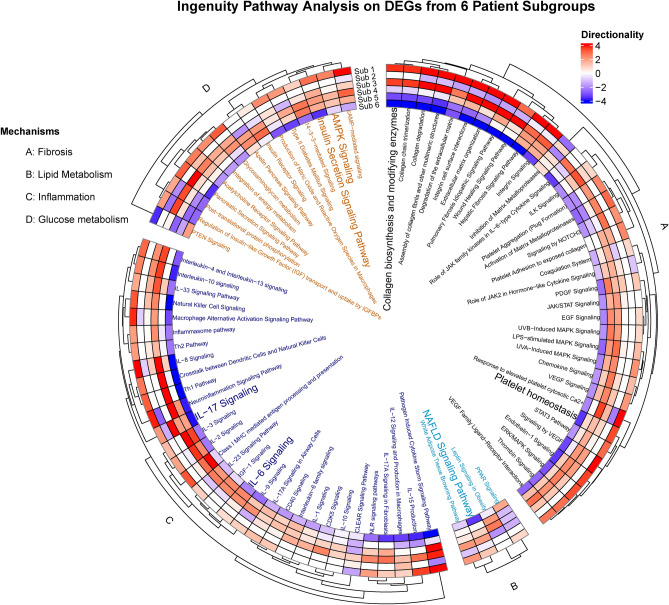
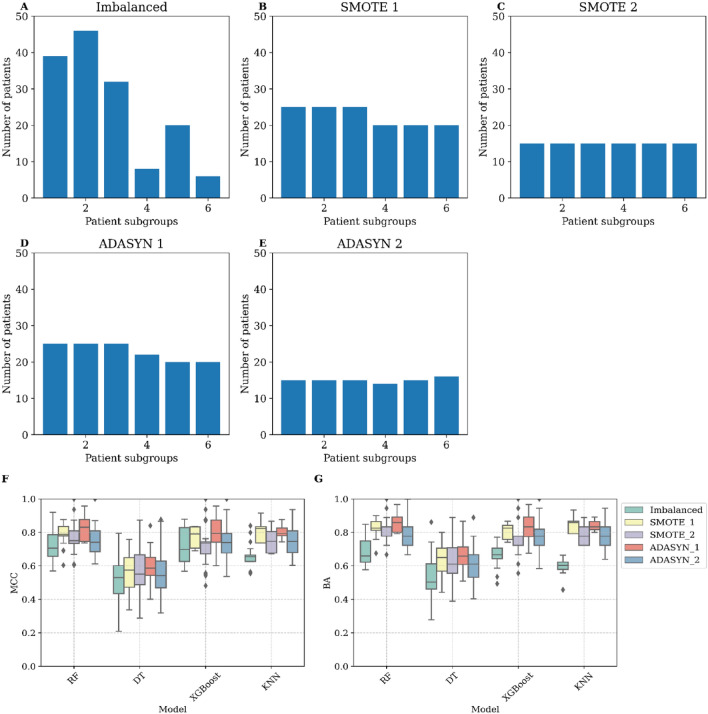
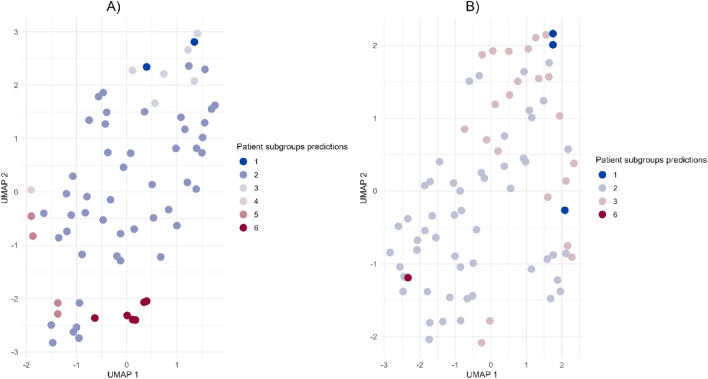
The incidence of MASLD and MASH-associated fibrosis is rapidly increasing worldwide. Drug therapy is hampered by large patient variability and partial representation of human MASH fibrosis in preclinical models. Here, we investigated the mechanisms underlying patient heterogeneity using a discovery dataset and validated in distinct human transcriptomic datasets, to improve patient stratification and translation into subgroup specific patterns. Patient stratification was performed using weighted gene co-expression network analysis (WGCNA) in a large public transcriptomic discovery dataset (n = 216). Differential expression analysis was performed using DESeq2 to obtain differentially expressed genes (DEGs). Ingenuity Pathway analysis was used for functional annotation. The discovery dataset showed relevant fibrosis-related mechanisms representative of disease heterogeneity. Biological complexity embedded in genes signature was used to stratify discovery dataset into six subgroups of various sizes. Of note, subgroup-specific DEGs show differences in directionality in canonical pathways (e.g. Collagen biosynthesis, cytokine signaling) across subgroups. Finally, a multiclass classification model was trained and validated in two datasets. In summary, our work shows a potential alternative for patient population stratification based on heterogeneity in MASLD-MASH mechanisms. Future research is warranted to further characterize patient subgroups and identify protein targets for virtual screening and/or in vitro validation in preclinical models.

Keywords: Biological patterns; Heterogeneity; Individual variation; Liver disease; Patient stratification; Subgroup-specific pathways.


Conflict of interest statement

The authors declare no competing interests.

Figures

Fig. 1
Fig. 1
General workflow in the identification, characterization, and classifier construction of patient subgroups. Abbreviations: UMAP, Uniform Manifold Approximation and projection, WGCNA, weighted gene co-expression network analysis, SMOTE, Synthetic Minority Oversampling technique, ADASYN, Adaptive Synthetic Sampling Approach.
Fig. 2
Fig. 2
Patient stratification in the discovery dataset in 6 patients subgroups using 14 hub genes. The discovery dataset was stratified into 6 patient subgroups using 14 hub genes from gene modules. Hierarchical clustering was performed using Euclidean distance between rows (gene modules) and columns (patients). Each gene module is represented by the absolute expression of the corresponding hub gene. Subgroup 1 (n = #57), subgroup 2 (n = #64), subgroup 3 (n = #46), subgroup 4 (n = #15), subgroup 5 (n = #27) and subgroup 6 (n = #7).
Fig. 3
Fig. 3
Canonical pathways and upstream regulators in 14 gene modules. (A) Top50 ranked canonical pathways and (B) Top 50 upstream regulators for each gene module from discovery dataset. Coloring indicates -logp-value (scaled 0–1). A higher enrichment corresponds with higher -logp-value.
Fig. 4
Fig. 4
Directionality of genes in fibrotic gene modules 4 (448 genes) and 7 (260 genes) in the discovery dataset. Genes representing fibrotic core genes in clusters 4 and 7 were compared to differentially expressed genes (DEGs) shared in the three datasets (F4 vs F0 fibrosis scores, 246) including the discovery dataset and Hoang/FFPE datasets. Module 4 and Module 7 contain 44 and 90 DEGs, respectively.
Fig. 5
Fig. 5
UMAP plot based on the clustered discovery dataset. (A) Colored by patient subgroup, (B) colored by fibrosis label. Subgroup 1 (n = #57), subgroup 2 (n = #64), subgroup 3 (n = #46), subgroup 4 (n = #15), subgroup 5 (n = #27) and subgroup 6 (n = #7).
Fig. 6
Fig. 6
Canonical pathways in patient subgroups. DEGs from one versus rest DESeq2 analysis were analyzed using Ingenuity Pathway Analysis. A manually selected list of relevant canonical pathways in fibrosis pathology was used. Colors indicate directionality Z score, where a higher enrichment indicates higher value.
Fig. 7
Fig. 7
Data Augmentation and Hyperparameter Optimization. This figure illustrates the impact of data augmentation techniques on training input datasets with varying patient subgroup sizes (AE) and evaluates the performance of hyperparameter optimization metrics across four machine learning algorithms (F, G). The datasets include the original imbalanced dataset (A) and augmented datasets generated using SMOTE-1 (B), SMOTE-2 (C), ADASYN-1 (D), and ADASYN-2 (E). Hyperparameter optimization was conducted for Random Forest, Decision Trees, XGBoost, and k-Nearest Neighbors. Performance was assessed with Matthews Correlation Coefficient (MCC) and Balanced Accuracy (BA). Evaluation employed nested cross-validation with stratified inner (k = 2) and outer (n = 5) fold cross-validation, using metrics obtained from 50 iterations per model using the randomsearch() implementation. SMOTE-1 and ADASYN-1 adjusted training split subgroup sizes to (Subgroup 1 = 25, Subgroup 2 = 25, Subgroup 3 = 25, Subgroup 4 = 20, Subgroup 5 = 20, Subgroup 6 = 20), while SMOTE-2 and ADASYN-2 adjusted them to (Subgroup 1 = 15, Subgroup 2 = 15, Subgroup 3 = 15, Subgroup 4 = 15, Subgroup 5 = 15, Subgroup 6 = 15).
Fig. 8
Fig. 8
Patient subgroup predictions in the unseen dataset using the 14 hub gene space from the discovery dataset. A) Patient subgroups predictions in the FFPE dataset. Subgroup 1 (n = #2), subgroup 2 (n = #48), subgroup 3 (n = #6), subgroup 4 (n = #1), subgroup 5 (n = #4) and subgroup 6 (n = #6). B) Patient subgroups predictions in the Hoang dataset. Subgroup 1 (n = #3), subgroup 2 (n = #52), subgroup 3 (n = #22) and subgroup 6 (n = #1).

Similar articles

Cited by

References

    1. Godoy-Matos, A. F., Silva Júnior, W. S. & Valerio, C. M. NAFLD as a continuum: From obesity to metabolic syndrome and diabetes. Diabetol. Metab. Syndr.10.1186/s13098-020-00570-y (2020). - PMC - PubMed
    1. Schuster, S., Cabrera, D., Arrese, M. & Feldstein, A. E. Triggering and resolution of inflammation in NASH. Nat. Rev. Gastroenterol. Hepatol.15, 349–364. 10.1038/s41575-018-0009-6 (2018). - PubMed
    1. Zhu, C., Tabas, I., Schwabe, R. F. & Pajvani, U. B. Maladaptive regeneration—the reawakening of developmental pathways in NASH and fibrosis. Nat. Rev. Gastroenterol. Hepatol.18, 131–142. 10.1038/s41575-020-00365-6 (2021). - PMC - PubMed
    1. Schonmann, Y., Yeshua, H., Bentov, I. & Zelber-Sagi, S. Liver fibrosis marker is an independent predictor of cardiovascular morbidity and mortality in the general population. Dig. Liver Dis.53, 79–85 (2021). - PubMed
    1. Vieira Barbosa, J. et al. Fibrosis-4 index as an independent predictor of mortality and liver-related outcomes in NAFLD. Hepatol. Commun.6, 2022 (2021). - PMC - PubMed

LinkOut - more resources