. 2024 Oct 7;14(1):23298.
doi: 10.1038/s41598-024-74976-3.

Differential gene expression in neonatal calf muscle tissues from Hanwoo cows overfed during mid to late pregnancy period

Affiliations

Differential gene expression in neonatal calf muscle tissues from Hanwoo cows overfed during mid to late pregnancy period

Borhan Shokrollahi et al. Sci Rep. .

Abstract

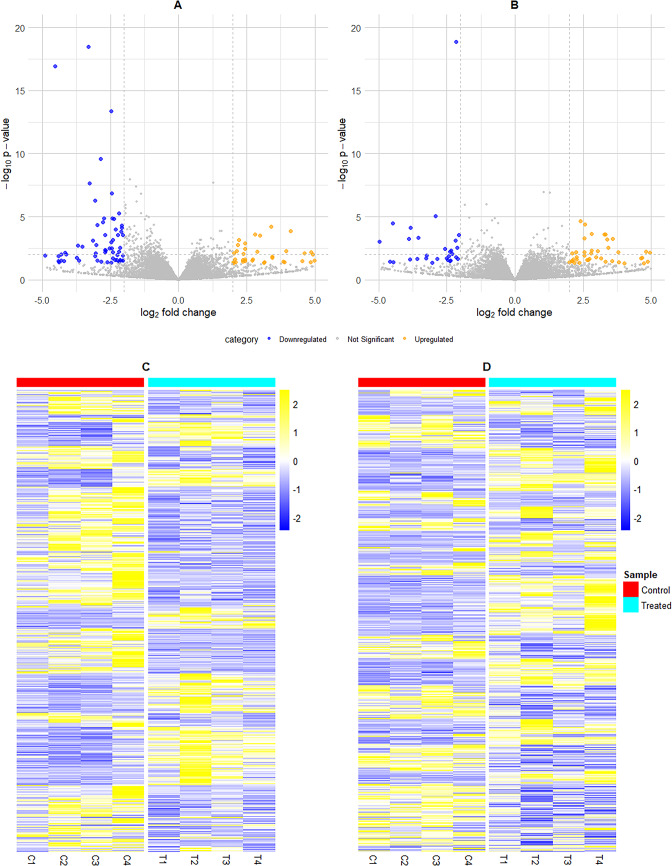
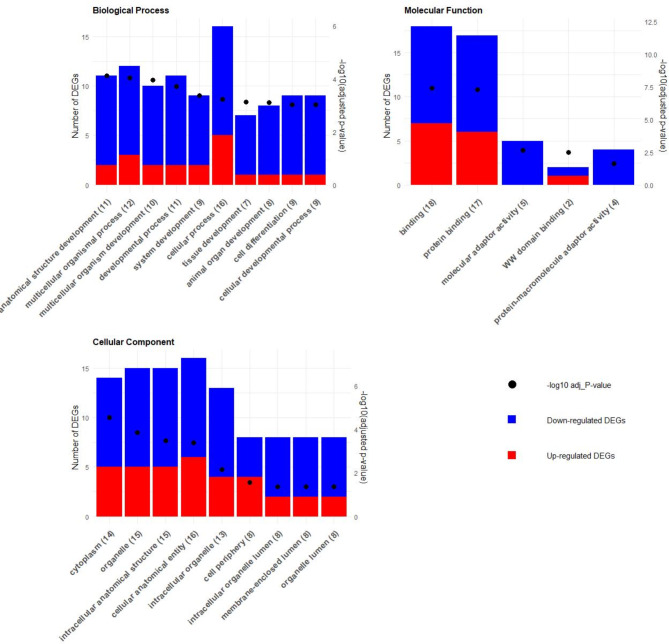
Maternal nutrition significantly influences fetal development and postnatal outcomes. This study investigates the impact of maternal overfeeding during mid to late pregnancy on gene expression in the round and sirloin muscles of Hanwoo neonatal calves. Eight cows were assigned to either a control group receiving standard nutrition (100%) or a treated group receiving overnutrition (150%). After birth, tissue samples from the round and sirloin muscles of neonatal calves were collected and subjected to RNA sequencing to assess differentially expressed genes (DEGs). RNA sequencing identified 43 DEGs in round muscle and 15 in sirloin muscle, involving genes related to myogenesis, adipogenesis, and energy regulation. Key genes, including PPARGC1A, THBS1, CD44, JUND, CNN1, ENAH, and RUNX1, were predominantly downregulated. Gene ontology (GO) enrichment analyses revealed terms associated with muscle development, such as "biological regulation," "cellular process," and "response to stimulus." Protein-protein interaction networks highlighted complex interactions among DEGs. Random Forest analysis identified ARC, SLC1A5, and GNPTAB as influential genes for distinguishing between control and treated groups. Overall, maternal overnutrition during mid-to-late pregnancy results in the downregulation of genes involved in muscle development and energy metabolism in neonatal Hanwoo calves. These findings provide insights into the molecular effects of maternal nutrition on muscle development.

Keywords: Beef cattle metabolism; Maternal nutrition; Metabolic programming; Skeletal muscle development; Transcriptomic analysis.


Conflict of interest statement

The authors declare no competing interests.

Figures

Fig. 1
Fig. 1
Principal Component Analysis (PCA) and Pearson correlation analysis of gene expression profiles in round and sirloin muscle tissues of neonatal Hanwoo calves. (A) PCA plot for round muscle tissue samples. Each point represents an individual sample, with blue points indicating control samples (C1, C2, C3, C4) and red points indicating treated samples (T1, T2, T3, T4). The PCA plot shows clear separation between control and treated groups. (B) The matrix shows the correlation coefficients between pairs of samples, with higher correlations indicated by darker shades. Control and treated samples exhibit high intra-group correlations, while inter-group correlations are lower. (C) PCA plot for sirloin muscle tissue samples. Each point represents an individual sample, with blue points indicating control samples and red points indicating treated samples. The PCA plot shows clear separation between control and treated groups. (D) Pearson correlation matrix for sirloin muscle tissue samples. The matrix shows the correlation coefficients between pairs of samples, with higher correlations indicated by darker shades. Control and treated samples exhibit high intra-group correlations, while inter-group correlations are lower.
Fig. 2
Fig. 2
Visualization of differentially expressed genes (DEGs) due to maternal overfeeding during mid to late pregnancy in the muscle tissues of neonatal Hanwoo calves. (A) Volcano plot for round muscle tissue. The Y-axis represents the -log10 p-values, while the X-axis shows the log2 fold change (FC). Blue points on the left indicate significantly downregulated DEGs, and orange points on the right indicate significantly upregulated DEGs (p-value < 0.05). Grey points represent non-significant DEGs. (B) Volcano plot for sirloin muscle tissue. Similar to panel A, the Y-axis represents the -log10 p-values, and the X-axis shows the log2 fold change (FC). Blue points indicate significantly downregulated DEGs, and orange points indicate significantly upregulated DEGs (p-value < 0.05). Grey points represent non-significant DEGs. (C) Heatmap depicting DEGs for round muscle tissue. Columns represent individual samples: control samples (C1, C2, C3, C4) and treated samples (T1, T2, T3, T4). Colors range from blue (downregulated) to yellow (upregulated) based on the Z-score of normalized expression values. (D) Heatmap depicting DEGs for sirloin muscle tissue. Columns represent individual samples: control samples and treated samples. Colors range from blue (downregulated) to yellow (upregulated) based on the Z-score of normalized expression values.
Fig. 3
Fig. 3
GO enrichment analysis for round muscle tissue: This figure displays the GO enrichment analysis results, highlighting the top 10 terms across biological processes, molecular functions, and cellular components. The Y-axis shows the number of DEGs, with blue and red bars indicating downregulated and upregulated DEGs for each term, respectively. The X-axis lists the top 10 terms. The opposite Y-axis depicts the -log10 of the adjusted p-value for each term, represented by dots.
Fig. 4
Fig. 4
GO enrichment analysis for sirloin muscle tissue: This figure displays the GO enrichment analysis results, highlighting the top 10 terms across biological processes, molecular functions, and cellular components. The Y-axis shows the number of DEGs, with blue and red bars indicating downregulated and upregulated DEGs for each term, respectively. The X-axis lists the top 10 terms. The opposite Y-axis depicts the -log10 of the adjusted p-value for each term, represented by dots.
Fig. 5
Fig. 5
KEGG pathway analysis for round and sirloin muscle tissues: This figure displays the KEGG pathways analysis results, highlighting the top 10 terms. The Y-axis shows the number of DEGs, with blue and red bars indicating downregulated and upregulated DEGs for each term, respectively. The X-axis lists the top 10 terms. The opposite Y-axis depicts the -log10 of the adjusted p-value for each term, represented by dots.
Fig. 6
Fig. 6
Protein-Protein Interaction (PPI) Network for Round Muscle DEGs. This figure depicts the PPI network of differentially expressed genes (DEGs) in the round muscle tissue of neonatal Hanwoo calves subjected to maternal overnutrition. The network consists of 45 nodes and 56 edges, highlighting significant interactions (PPI enrichment p-value: 5.24e-13).
Fig. 7
Fig. 7
Protein-Protein Interaction (PPI) Network for Sirloin Muscle DEGs. This figure illustrates the PPI network of DEGs in the sirloin muscle tissue of neonatal Hanwoo calves exposed to maternal overnutrition. The network includes 21 nodes and 14 edges, with fewer significant interactions (PPI enrichment p-value: 0.176).
Fig. 8
Fig. 8
Top 10 genes from random forest classification. This figure displays the genes identified by Random Forest classification as the most important based on their impact on model accuracy. The y-axis lists the gene names, and the x-axis shows the mean decrease in accuracy (MDA) associated with each gene.
Fig. 9
Fig. 9
Validation of RNA-Seq data using qPCR. (A) Shows the validation of six DEGs by qPCR, with fold changes in expression shown separately for round muscle (PPARGC1A, THBS1, FOSL1, CNN1; left panel) and sirloin muscle (SGMS2, LOC104970902; right panel). (B) Depicts FPKM values from RNA-Seq for the same six DEGs in round and sirloin muscles of neonatal calves. The y-axis indicates fold change for qPCR and gene expression level (FPKM) for RNA-Seq, while the x-axis lists the groups compared. Above the bars, gene names and their respective p-value symbols from qPCR results are displayed in (A): *** (p < 0.001), ** (p < 0.01), * (p < 0.05). In (B), gene names and their respective adjusted p-value symbols from RNA-Seq results are displayed: *** (adj p < 0.001), ** (adj p < 0.01), * (adj p < 0.05).

References

    1. Hrdlickova, R., Toloue, M. & Tian, B. RNA-Seq methods for transcriptome analysis. Wiley Interdiscip Rev. RNA. 8, e1364 (2017). - PMC - PubMed
    1. Noya, A., Ripoll, G., Casasús, I. & Sanz, A. Long-term effects of early maternal undernutrition on the growth, physiological profiles, carcass and meat quality of male beef offspring. Res. Vet. Sci.142, 1–11 (2022). - PubMed
    1. Marquez, D. et al. Supplementation of grazing beef cows during gestation as a strategy to improve skeletal muscle development of the offspring. Anim. 11, 2184–2192 (2017). - PubMed
    1. Zago, D., Canozzi, M. E. A. & Barcellos, J. O. J. Pregnant beef cow’s nutrition and its effects on postnatal weight and carcass quality of their progeny. PLoS One. 15, e0237941 (2020). - PMC - PubMed
    1. Du, M., Ford, S. P. & Zhu, M. J. Optimizing livestock production efficiency through maternal nutritional management and fetal developmental programming. Anim. Front.7, 5–11 (2017).