. 2024 Oct 7;7(1):275.
doi: 10.1038/s41746-024-01271-w.

Screening chronic kidney disease through deep learning utilizing ultra-wide-field fundus images

Affiliations

Screening chronic kidney disease through deep learning utilizing ultra-wide-field fundus images

Xinyu Zhao et al. NPJ Digit Med. .

Abstract

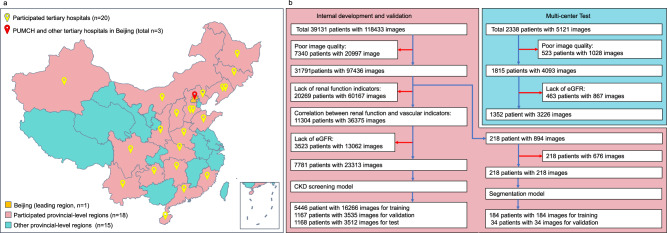
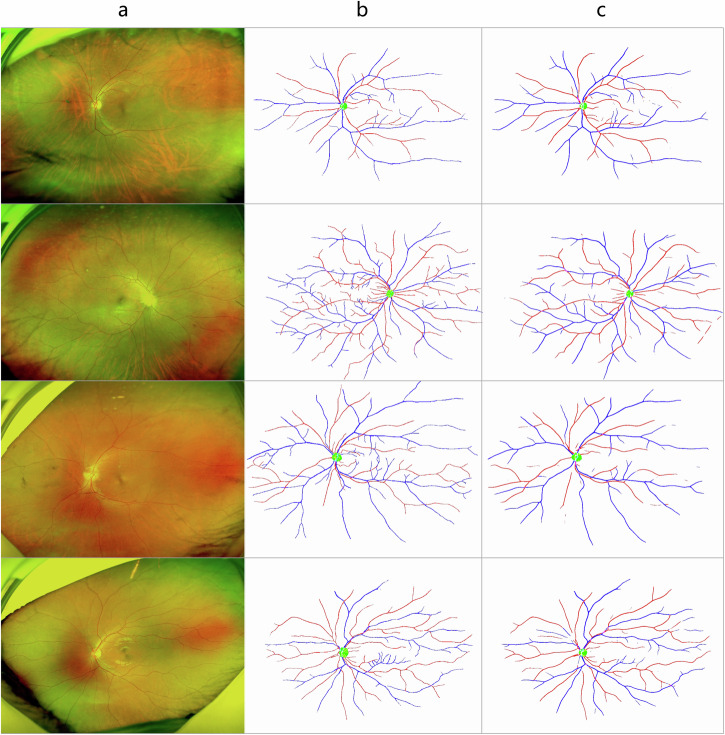
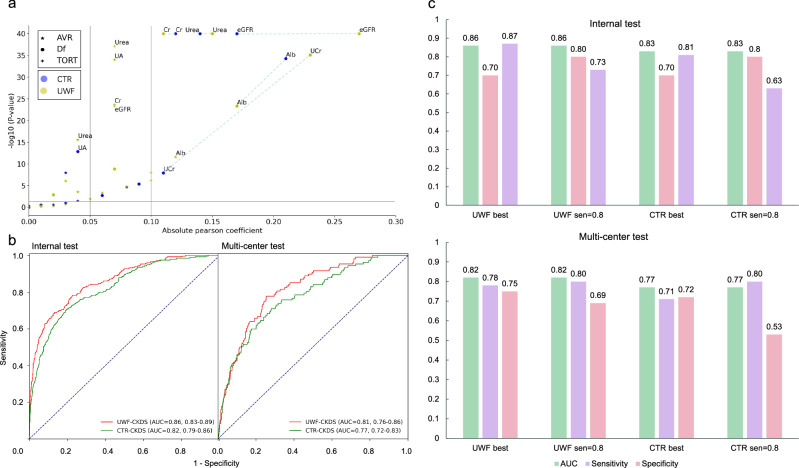
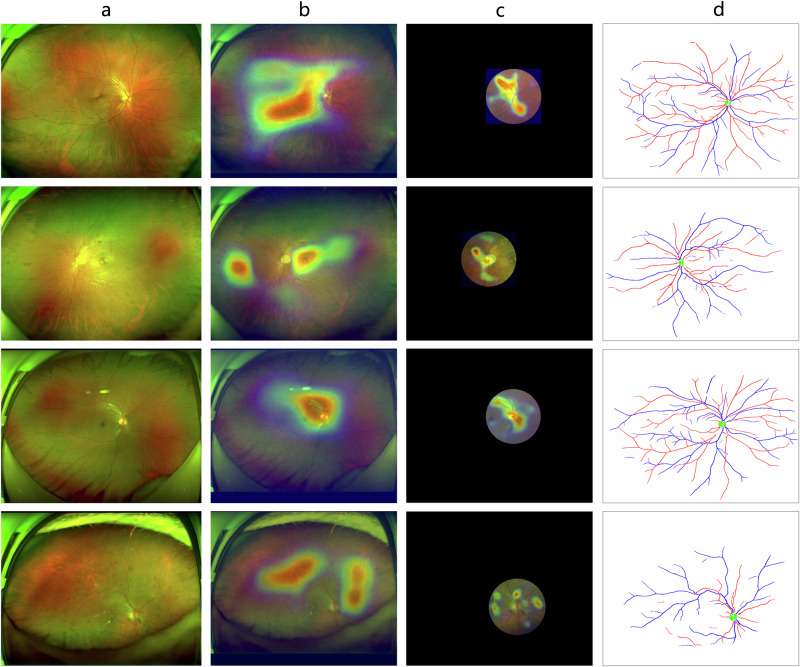
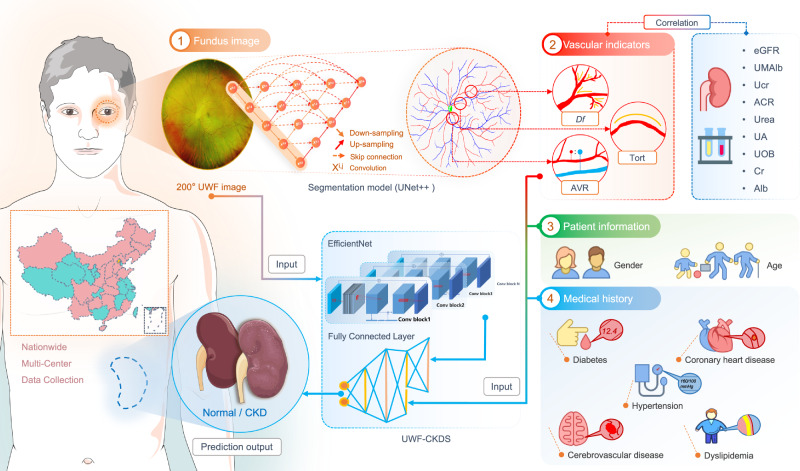
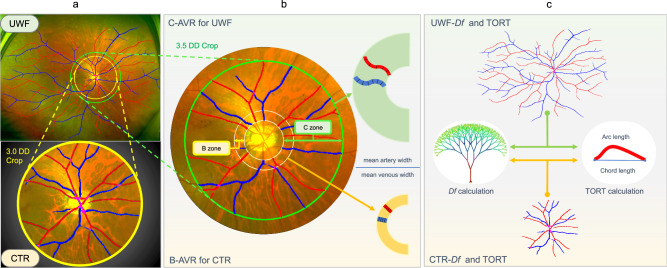
To address challenges in screening for chronic kidney disease (CKD), we devised a deep learning-based CKD screening model named UWF-CKDS. It utilizes ultra-wide-field (UWF) fundus images to predict the presence of CKD. We validated the model with data from 23 tertiary hospitals across China. Retinal vessels and retinal microvascular parameters (RMPs) were extracted to enhance model interpretability, which revealed a significant correlation between renal function and RMPs. UWF-CKDS, utilizing UWF images, RMPs, and relevant medical history, can accurately determine CKD status. Importantly, UWF-CKDS exhibited superior performance compared to CTR-CKDS, a model developed using the central region (CTR) cropped from UWF images, underscoring the contribution of the peripheral retina in predicting renal function. The study presents UWF-CKDS as a highly implementable method for large-scale and accurate CKD screening at the population level.


Conflict of interest statement

The authors declare no competing interests.

Figures

Fig. 1
Fig. 1. Patient data collection and screening process of the nationwide and multicenter study.
a The 200° UWF images were captured, and the renal function and medical history items were prospectively extracted from 23 tertiary hospitals nationwide in China (See Supplementary Note 1 for detailed hospital information). b 123,585 UWF images from 41,469 patients were initially collected. 218 images from 218 patients were finally included for training the UWF image segmentation model. 23,313 images from 7781 patients were finally included for creating the CKD screening model in a 7:1.5:1.5 distribution for internal training, validation, and test. 3226 images from 1352 patients from multicenter collection were used for outer validation. Blue arrows: patients and images permitted to subsequent procedures. Red arrows: excluded patients and images according to the exclusion criteria.
Fig. 2
Fig. 2. Representation and comparison of image segmentation between experienced ophthalmology experts and UNet++ based segmentation model.
Four UWF images (a) and the segmentation results from experienced ophthalmology experts (b) and the segmentation model (c) were randomly selected for representation. The automatic segmentation of the optic disc and the vessels were very close to the doctor’s annotation.
Fig. 3
Fig. 3. Comparison of retinal microvascular parameters-renal function correlation between UWF- and CTR-CKDS models.
a Df of the UWF or CTR images were significantly correlated with most of the renal function indicators in different level. Generally, the UWF-Df showed a better correlation with renal functions than CTR-Df. The UWF-Df showed the highest correlation coefficient with eGFR. b The UWF-CKDS model achieved higher AUC values than the CTR-CKDS model on both test datasets (internal 0.86 95% CI: 0.83–0.89 versus 0.82 95% CI: 0.79–0.86, P < 0.01; multicenter 0.81 95% CI: 0.76–0.86 versus 0.77 95% CI: 0.72–0.83, P = 0.01). c More detailed comparison of AUC, sensitivity, and specificity between UWF- CKDS and CTR-CKDS on both datasets also revealed the better performance of the former model. When the sensitivity value was set at 0.80, UWF-CKDS also showed better specificity than CTR-CKDS in the multicenter test (0.69 95% CI: 0.65–0.71 versus 0.53 95% CI: 0.50–0.56, P < 0.01).
Fig. 4
Fig. 4. Representation and comparison of regions of interest between UWF- and CTR-CKDS models.
Four randomly selected images, along with the heatmaps, showed the regions of interest of both UWF- and CTR-CKD models. The UWF-CKDS model focused not only on the posterior pole but also on the peripheral retina. a Raw UWF fundus image, b region of interest of UWF-CKDS, c region of interest of CTR-CKDS, and d corresponding extracted vessels and optic disc.
Fig. 5
Fig. 5. Overall input data collection and CKD status prediction procedure.
Vascular indices, including the Df, TORT and AVR, were measured automatically after segmenting the UWF images with UNet++ based segmenting model. The correlation between the vascular indices and multiple renal function indices was further analyzed. Finally, a classification model, which combines the raw UWF image, 2 items of patient information, 5 items of medical history information, and the 3 items of vascular indicators as the input, generates the prediction output of CKD status (yes or no). This model used the EfficientNet structure to extract image features from UWF images and then employed multi-layer fully connected layers to fuse image features and numerical features.
Fig. 6
Fig. 6. Comparison of retinal microvascular parameters between UWF and optic disc-centered image.
a An optic disc-centered circular region with a radius of 3 DD away from the optic disc was cropped from the UWF image to represent the central 50° fundus region (denoted as CTR). b B-zone (an annular region that is 0.5–1 DD outside the optic disc) and C-zone (an annular region that is 0.5–3.5 DD outside the optic disc) are used for calculating the AVR for CTR and UFW image (denoted as B-AVR and C-AVR, respectively). c The Df and TORT of both CTR and UWF images were also calculated and compared.

References

    1. Fox, C. S. et al. Associations of kidney disease measures with mortality and end-stage renal disease in individuals with and without diabetes: a meta-analysis. Lancet380, 1662–1673 (2012). - PMC - PubMed
    1. Zhao, X. et al. Relationships between retinal vascular characteristics and renal function in patients with type 2 diabetes mellitus. Transl. Vis. Sci. Technol.10, 20 (2021). - PMC - PubMed
    1. GBD Chronic Kidney Disease Collaboration. Global, regional, and national burden of chronic kidney disease, 1990–2017: a systematic analysis for the Global Burden of Disease Study 2017. Lancet395, 709–733 (2020). - PMC - PubMed
    1. Jha, V. et al. Chronic kidney disease: global dimension and perspectives. Lancet382, 260–272 (2013). - PubMed
    1. Vanholder, R. et al. Reducing the costs of chronic kidney disease while delivering quality health care: a call to action. Nat. Rev. Nephrol.13, 393–409 (2017). - PubMed

LinkOut - more resources