. 2024 Dec;43(23):5813-5836.
doi: 10.1038/s44318-024-00231-0. Epub 2024 Oct 7.

TRPC5 controls the adrenaline-mediated counter regulation of hypoglycemia

Affiliations

TRPC5 controls the adrenaline-mediated counter regulation of hypoglycemia

Jenny Bröker-Lai et al. EMBO J. 2024 Dec.

Abstract

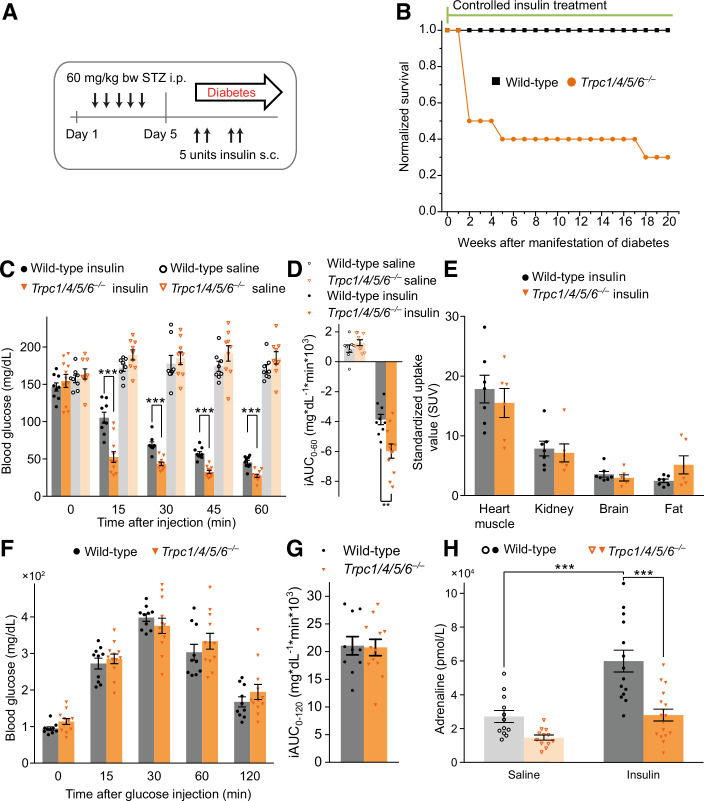
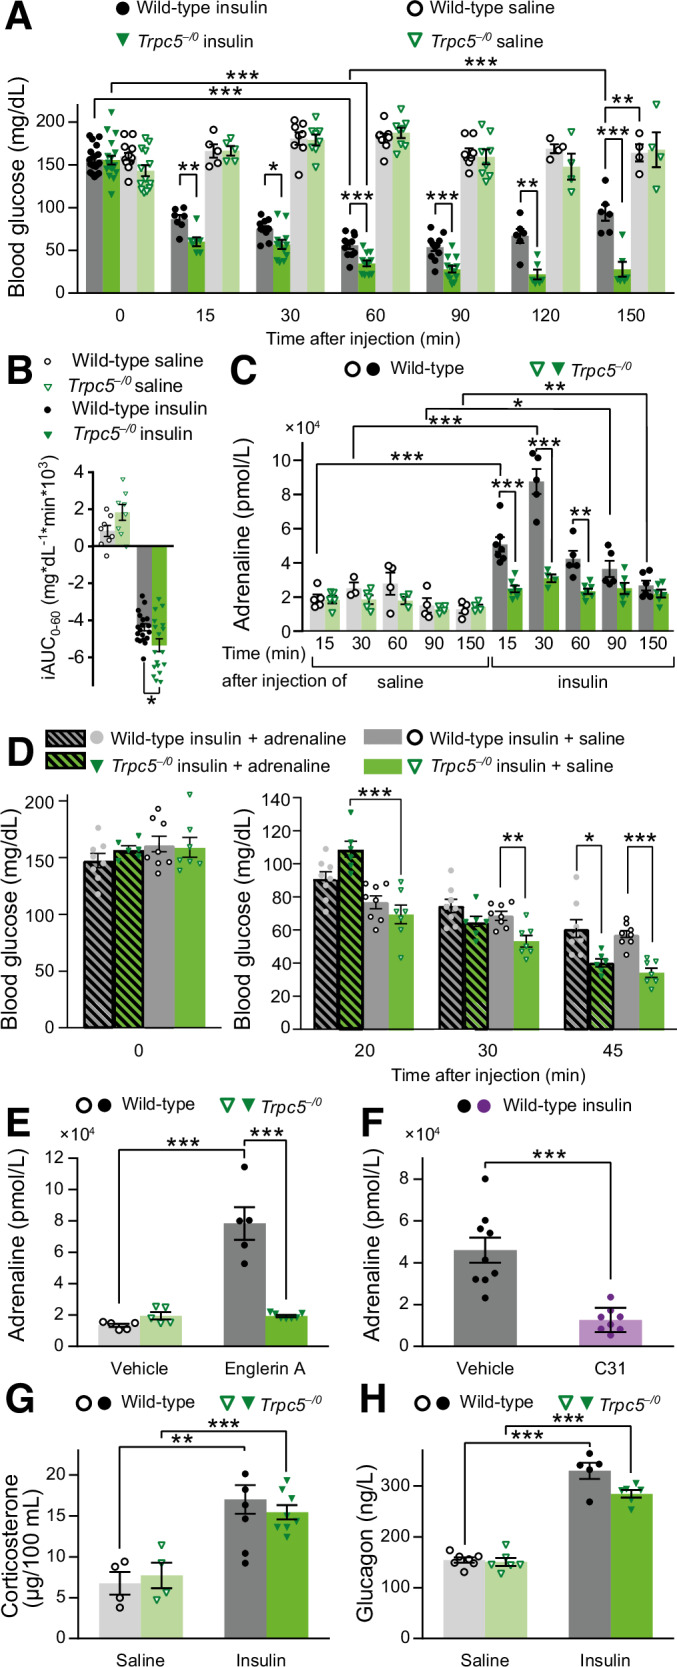
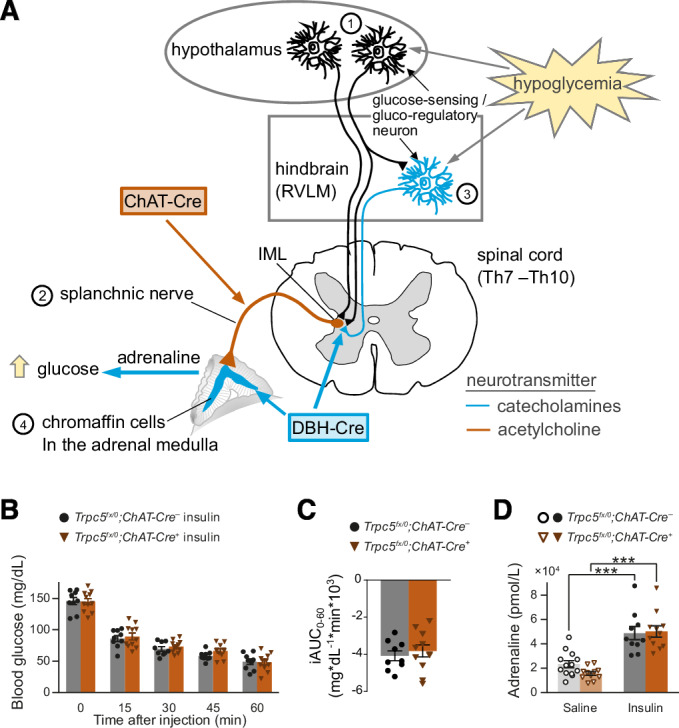
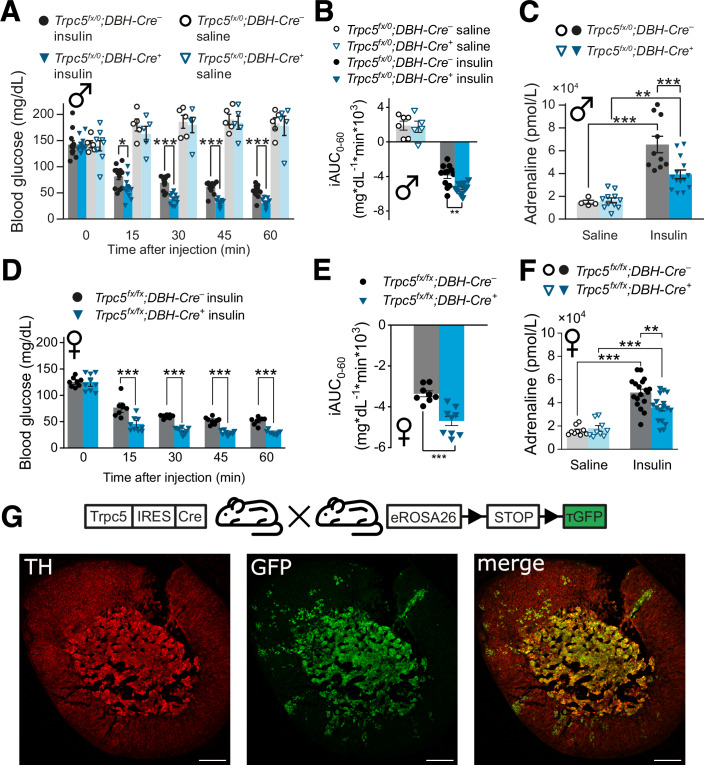
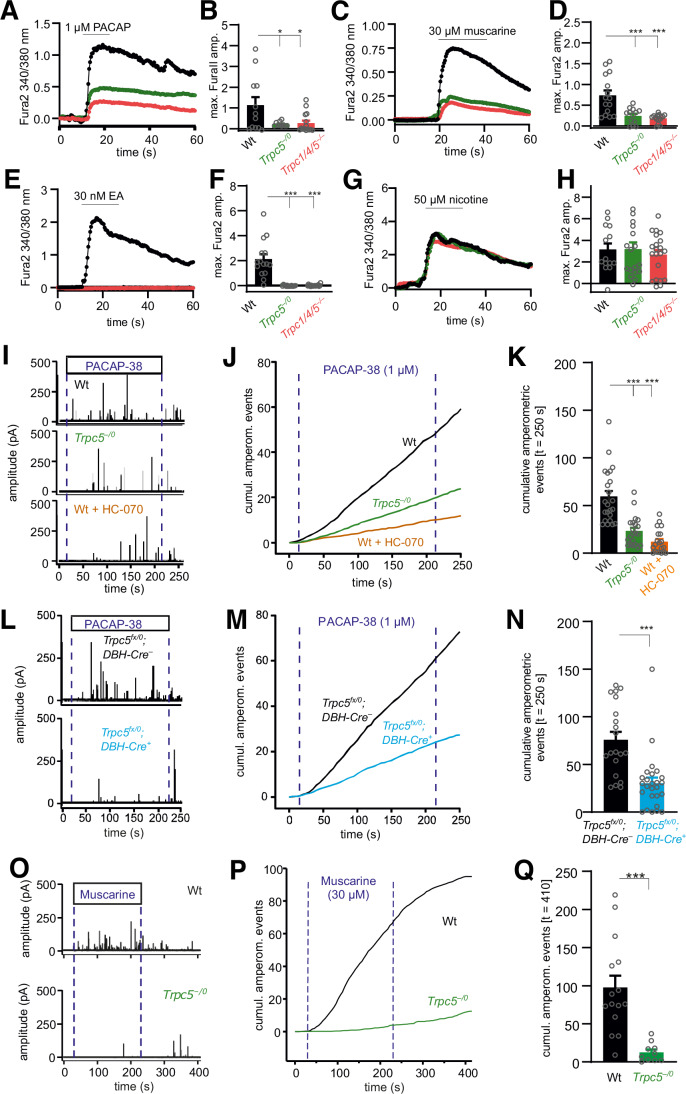
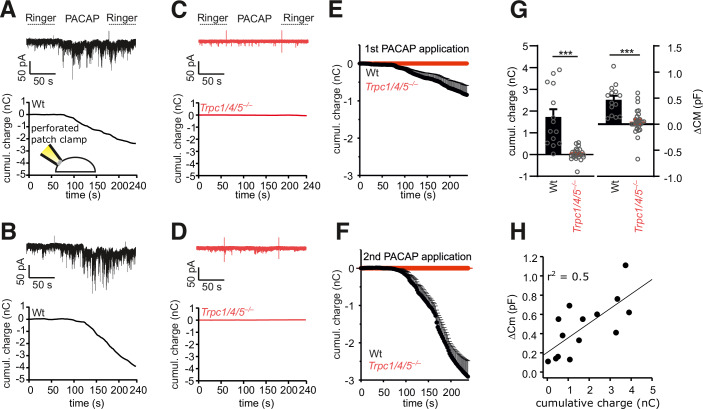
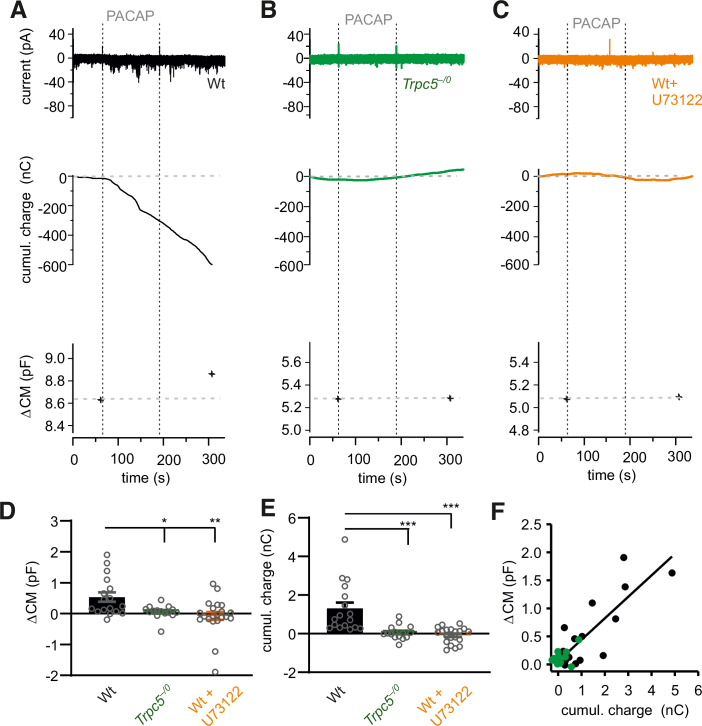
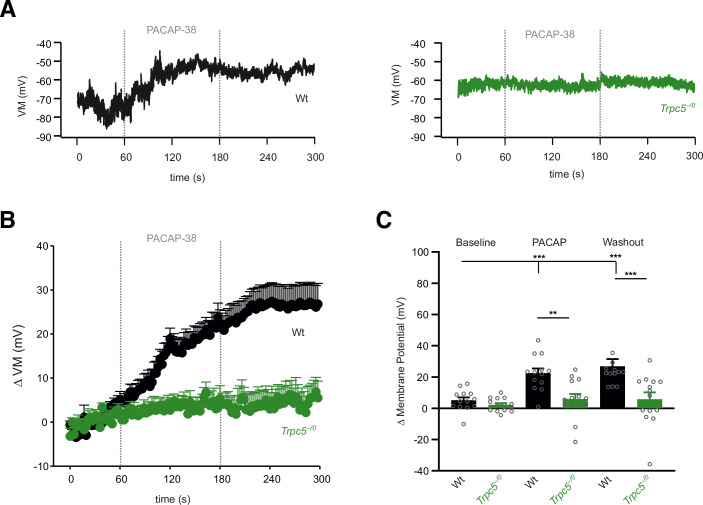
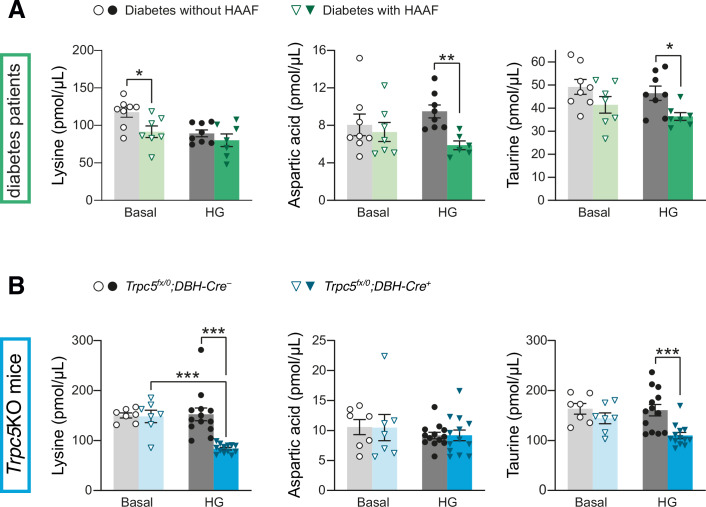
Hypoglycemia triggers autonomic and endocrine counter-regulatory responses to restore glucose homeostasis, a response that is impaired in patients with diabetes and its long-term complication hypoglycemia-associated autonomic failure (HAAF). We show that insulin-evoked hypoglycemia is severely aggravated in mice lacking the cation channel proteins TRPC1, TRPC4, TRPC5, and TRPC6, which cannot be explained by alterations in glucagon or glucocorticoid action. By using various TRPC compound knockout mouse lines, we pinpointed the failure in sympathetic counter-regulation to the lack of the TRPC5 channel subtype in adrenal chromaffin cells, which prevents proper adrenaline rise in blood plasma. Using electrophysiological analyses, we delineate a previously unknown signaling pathway in which stimulation of PAC1 or muscarinic receptors activates TRPC5 channels in a phospholipase-C-dependent manner to induce sustained adrenaline secretion as a crucial step in the sympathetic counter response to insulin-induced hypoglycemia. By comparing metabolites in the plasma, we identified reduced taurine levels after hypoglycemia induction as a commonality in TRPC5-deficient mice and HAAF patients.

Keywords: Adrenaline Secretion; Calcium Signaling; Chromaffin Cells; Hypoglycemia Associated Autonomic Failure; TRPC5 Channels.


Conflict of interest statement

Disclosure and competing interests statement. The authors declare no competing interests.

Figures

Figure 1
Figure 1. Deletion of TRPC channels aggravates insulin-induced hypoglycemia and impairs the associated plasma adrenaline rise.
(A) Schematic representation of the experimental procedure: Diabetes is induced by i.p injections of streptozotocin (STZ) on five consecutive days. The resultant diabetic hyperglycemia is controlled by s.c. injections of insulin glargin (Lantus®), according to the current blood glucose levels. (B) Survival rate of STZ-induced diabetic mice during the long-term regulation of the blood glucose levels with insulin (t = 0: n = 10 for Trpc1/4/5/6–/–; n = 10 for wild-type). After 2 weeks, the insulin dose was lowered for the Trpc1/4/5/6–/– animals (for details see Methods). (C) Insulin tolerance test (ITT): Time course of the blood glucose levels after the i.p. injection of insulin or saline in non-diabetic wild-type or Trpc1/4/5/6–/– mice. Wild-Type vs. Trpc1/4/5/6–/– during insulin treatment at 15 min, p = 6.55 × 10⁻⁵; at 30 min p = 6.93 × 10⁻⁶; at 45 min p = 6.08 × 10⁻⁷; at 60 min p = 3.72 × 10⁻⁵. (D) The incremental integrated area under the curve from the ITT in C (Trpc1/4/5/6–/–: n = 11 for insulin, n = 9 for saline; wild-type: n = 9 for insulin, n = 8 for saline; p = 0.00286 for wild-type vs. Trpc1/4/5/6–/– under insulin treatment). (E) Analysis of standardized uptake volumes, using 18F-fluorodeoxyglucose (18F-FDG)-PET. Glucose metabolism rates were unchanged in heart muscle, kidney, brain, and fat tissue of Trpc1/4/5/6–/– (n = 6 for Trpc1/4/5/6–/–, n = 7 for wild-type). (F) Intraperitoneal glucose tolerance test on Trpc1/4/5/6–/– and wild-type animals and (G) incremental area under the curve from the glucose tolerance test (n = 12 for Trpc1/4/5/6–/–, n = 10 for wild-type). (H) Plasma adrenaline levels 60 min after insulin injection for wild-type and Trpc1/4/5/6–/– mice. The plasma levels of mice which received saline intraperitoneally serve as a reference (Trpc1/4/5/6–/–: n = 16 for insulin, n = 12 for saline; wild-type: n = 14 for insulin, n = 12 for saline; wild-type, insulin vs. saline: p = 0.000289; insulin, wild-type vs. Trpc1/4/5/6–/–: p = 3.90 × 10⁻⁵). **p < 0.01, ***p < 0.001, two sample t test. Mean ± s.e.m. (CH) All indicated n-values are biological replicates. Source data are available online for this figure.
Figure 2
Figure 2. Aggravated insulin-induced hypoglycemia in mice lacking TRPC5 due to impaired adrenaline response.
(A) Long-term Insulin tolerance test (ITT). Blood glucose levels of Trpc5–/0 mice, measured over 150 min after insulin injection (Trpc5–/0 insulin: n = 19 (0 min), n = 7 (15 min) n = 12 (30, 60, 90 min), n = 6 (120, 150 min); saline: n = 19 (0 min), n = 7 (15 min), n = 8 (30, 60, 90 min), n = 4 (120, 150 min). wild-type insulin: n = 18 (0 min), n = 7 (15 min), n = 11 (30, 60, 90 min), n = 6 (120, 150 min); Saline: n = 13 (0 min), n = 5 (15 min), n = 8 (30, 60, 90 min), n = 4 (120, 150 min). Wild-type insulin: 0 vs. 15 min p = 3.31 × 10⁻¹⁰, 0 vs. 30 min p = 1.45 × 10⁻¹⁴, 0 vs. 60 min p = 2.07 × 10⁻¹⁶, 0 vs. 90 min p = 3.36 × 10⁻¹⁶, 0 vs. 120 min p = 1.28 × 10⁻¹⁰, 0 vs. 150 min p = 1.85 × 10⁻⁷, 60 vs. 120 min p = 0.000487, 60 vs. 150 min p = 1.70 × 10⁻¹⁴. Trpc5–/0 insulin: 0 vs. 15 min p = 1.75 × 10⁻¹⁰, 0 vs. 30 min p = 2.13 × 10⁻¹³, 0 vs. 60 min p = 8.67 × 10⁻¹⁷, 0 vs. 90 min p = 3.99 × 10⁻¹⁷, 0 vs. 120 min p = 1.48 × 10⁻¹², 0 vs. 150 min p = 1.37 × 10⁻¹¹. Insulin, wild-type vs. Trpc5–/0: 15 min p = 0.00253, 30 min p = 0.0102, 60 min p = 0.000533, 90 min p = 0.000277, 120 min p = 0.00110, 150 min p = 0.000438. Wild-type, insulin vs. saline 150 min p = 0.00116. (B) Incremental integrated area under the curve during a 60 min ITT (Trpc5–/0: n = 18 for insulin and n = 8 for saline; Wild-type: n = 19 for insulin and n = 8 for saline; wild-type vs. Trpc5–/0 with insulin p = 0.018). (C) Time course of the plasma adrenaline levels corresponding to the ITT in (A). (Trpc5–/0: for insulin (15 min): n = 7; (30 min): n = 4; (60 min): n = 7; (90, 150 min): n = 6; for saline (15, 30 min): n = 5; (60 min): n = 3; (90, 150 min): n = 4; wild-type: for insulin (15 min): n = 7; (30, 60, 90 min): n = 5; (150 min): n = 6; for saline (15 min): n = 5; (30 min): n = 3; (60, 90, 150 min): n = 4). Wild-type, insulin vs. saline: 15 min p = 0.000187, 30 min p = 0.000830, 90 min p = 0.0135, 150 min p = 0.00848. Insulin, wild-type vs. Trpc5–/0: 15 min p = 0.000128, 30 min p = 0.000303, 60 min p = 0.00119. (D) ITT with and without adrenaline supplementation on Trpc5–/0 mice. Blood glucose levels of mice receiving injections of insulin plus adrenaline were compared with the ones of mice which received insulin plus saline (Trpc5–/0: n = 6 for insulin + adrenaline, n = 7 for insulin + saline; wild-type: n = 8 for insulin + adrenaline, n = 8 for insulin + saline). 20 min Trpc5–/0, adrenaline vs. saline p = 0.000459; 30 min saline, Trpc5–/0 vs. wild-type p = 0.00238; 45 min Trpc5–/0 vs. wild-type: saline p = 2.87 × 10⁻⁵, adrenaline p = 0.0130. (E) Evaluation of the effect of the TRPC5 agonist Englerin A (EA) on plasma adrenaline. Adrenaline levels 5 min after the application of EA or vehicle are shown. EA, Wild-type vs. Trpc5–/0 p = 4.42 × 10⁻⁵; Wild-type, Vehicle vs. EA p = 0.000249 (Trpc5–/0: n = 7 for EA, n = 5 for vehicle; wild-type: n = 5 per group). (F) Effect of the TRPC5 antagonist C31 on plasma adrenaline levels 30 min after the application of insulin on wild-type mice. The animals received C31 or vehicle prior to insulin (n = 8 for C31 + insulin, n = 9 for vehicle + insulin, p = 0.000160). (G) Corticosterone plasma levels 60 min after the injection of insulin or saline (Trpc5–/0: p = 0.000855, n = 8 for insulin, n = 4 for saline; wild-type: p = 0.00309, n = 6 for insulin, n = 4 for saline). (H) Plasma glucagon levels 60 min after the injection of insulin or saline (Two-way ANOVA, p = 3.142 × 10⁻⁸; genotype n.s. p = 0.316, treatment p = 3.20 × 10⁻¹¹; Bonferroni pairwise comparison: Trpc5–/0, p = 1.06 × 10⁻⁶, n = 6 for insulin, n = 6 for saline; wild-type: p = 4.85 × 10⁻⁹, n = 5 for insulin, n = 7 for saline). (AH) Mean ± s.e.m., two sample t test, *p < 0.05, **p < 0.01, ***p < 0.001 all indicated n-values are biological replicates. Source data are available online for this figure.
Figure 3
Figure 3. Tissue-specific Trpc5-deletion and its effect on autonomic counter regulation.
(A) Schematic representation of the processes underlying the central stress perception and stress response to hypoglycemia. IML intermediolateral nucleus, Th thoracic vertebrae, RVLM ventrolateral medulla. (B) Time course of blood glucose levels during an insulin tolerance test in a mouse line with Trpc5 deletion in cholinergic neurons (male Trpc5fx/0;ChAT-Cre+: n = 11; Trpc5fx/0;ChAT-Cre: n = 9). (C) Incremental integrated area under the curve during the ITT. (D) Plasma adrenaline levels 30 min after insulin injection (male Trpc5fx/0;ChAT-Cre+: p = 8.19 × 10⁻⁷, n = 11 for insulin, n = 11 for saline; Trpc5fx/0;ChAT-Cre: p = 0.000217, n = 10 for insulin, n = 13 for saline). ***p < 0.001, two sample t-test. (BD) Mean ± s.e.m. all indicated n-values are biological replicates. Source data are available online for this figure.
Figure 4
Figure 4. TRPC5 channels in catecholaminergic cells are relevant for autonomic counter regulation.
(A) Time course of blood glucose levels during insulin tolerance tests in a mouse line with Trpc5 deleted in catecholaminergic cells. Male Trpc5fx/0;DBH-Cre+: n = 11 for insulin, n = 5 for saline; Trpc5fx/0;DBH-Cre: n = 12 for insulin, n = 6 for saline. Trpc5fx/0;DBH-Cre+ vs. Trpc5fx/0;DBH-Cre after insulin injection, p = 0.0194 (15 min), p = 3.12 × 10⁻⁶ (30 min), p = 1.05 × 10⁻⁷ (45 min), p = 1.11 × 10⁻⁵ (60 min). (B) The incremental integrated area under the curve from (A). Male Trpc5fx/0;DBH-Cre+: n = 11 for insulin, n = 5 for saline; Trpc5fx/0;DBH-Cre: n = 12 for insulin, n = 6 for saline. Trpc5fx/0;DBH-Cre+ vs. Trpc5fx/0;DBH-Cre after insulin injection, p = 0.00219. (C) The plasma adrenaline levels 30 min after insulin injection. Male Trpc5fx/0;DBH-Cre+: p = 6.72 × 10⁻⁵, n = 14 for insulin, n = 11 for saline; Trpc5fx/0;DBH-Cre: p = 0.000966, n = 10 for insulin, n = 4 for saline; insulin treatment between genotypes p = 0.00205. (D) As (A) but in female mice. Female Trpc5fx/fx; DBH-Cre+: n = 9; Trpc5fx/fx; DBH-Cre: n = 8, p = 0.000792 (15 min), p = 2.50 × 10⁻⁹ (30 min), p = 4.20 × 10⁻⁷ (45 min), p = 9.11 × 10⁻⁷ (60 min). (E) The incremental integrated area under the curve from (D). Female Trpc5fx/fx; DBH-Cre+: n = 9; Trpc5fx/fx; DBH-Cre: n = 8, p = 0.000226. (F) The plasma adrenaline levels 30 min after insulin injection for female Trpc5fx/fx; DBH-Cre+: p = 0.000310, n = 17 (insulin), n = 9 (saline) and Trpc5fx/fx; DBH-Cre: p = 5.49 × 10⁻⁸, n = 18 (insulin), n = 9 (saline). Insulin treatment between genotypes: p = 0.0030. (G) Representative immunohistology of adrenal gland sections, using anti-TH antibodies (red) and anti-GFP (green) in Trpc5-IRES-Cre;eR26-τGFP animals where GFP serves as an indicator for TRPC5 expression. Scale bar = 200 µm. (AF) Mean ± s.e.m., *p < 0.05, **p < 0.01, ***p < 0.001, two sample t test, all indicated n-values are biological replicates. Source data are available online for this figure.
Figure 5
Figure 5. Genetic loss or pharmacological inhibition of TRPC5 strongly reduces muscarine and PACAP-evoked catecholamine secretion from chromaffin cells.
(A) Average time course of the intracellular calcium concentration in Fura-2-AM-loaded chromaffin cells stimulated with 1 µM PACAP. (B) The increase in [Ca2+]i is significantly reduced in Trpc1/4/5–/– (red, p = 0.0306) and TRPC5-deficient (Trpc5–/0, green, p = 0.0395) cells when cells were perfused with 1 µM PACAP. Wt, n = 12; Trpc5–/0, n = 10; Trpc1/4/5–/–, n = 15 from 4 independent preparations. (C) As (A) but with 30 µM muscarine. (D) The increase in [Ca2+]i is significantly reduced in Trpc1/4/5–/– (red, p = 4.22 × 10⁻⁵) and TRPC5-deficient (Trpc5–/0, green, p = 3.70 × 10⁻⁴) cells when cells were perfused with 30 µM muscarine. wt, n = 15; Trpc5–/0, n = 13; Trpc1/4/5–/–, n = 15 from 3 independent preparations. (E) As (A) but with 30 nM Englerin A (EA). (F) The increase in [Ca2+]i is significantly reduced in Trpc1/4/5–/– (red, p < 2 × 10⁻¹⁶) and TRPC5-deficient (Trpc5–/0, green, p < 2 × 10⁻¹⁶) cells when cells were perfused with 30 nM EA. wt, n = 15; Trpc5–/0, n = 15; Trpc1/4/5–/–, n = 19 from 3 independent preparations. (G) As (A) but with 50 µM nicotine. (H) The increase in [Ca2+]i remained unaffected by nicotinergic stimulation. wt, n = 14; Trpc5–/0, n = 18; Trpc1/4/5–/–, n = 21. One-way ANOVA with Tukey post hoc means comparision, *p < 0.05, ***p < 0.001 (B, D, F). (IQ) Amperometric analysis of catecholamine secretion from chromaffin cells isolated from the adrenal medulla. (I) Exemplary amperometric recordings in response to PACAP application for Trpc5–/0 and wild-type chromaffin cells and wild-type cells treated with HC-070 (50 nM). Dashed blue lines indicate the beginning and the end of PACAP application (1 μM, 200 s). (J) Cumulative presentation of averaged secretion in response to PACAP. (K) Loss of TRPC5 or its acute inhibition strongly reduces PACAP-evoked secretion. Data were collected from wt, n = 23; Trpc5–/0, n = 21, p = 6.00 × 10⁻⁷; wt+HC-070, n = 20, p < 2 × 10⁻¹⁶ from 3 independent preparations. One-way ANOVA Tukey Kramer post hoc vs. wt. ***p < 0.001. (L) Exemplary amperometric recordings of chromaffin cells prepared Trpc5fx/0;DBH-Cre and Trpc5fx/0;DBH-Cre+: mice in response to PACAP application. (M) Mean cumulative plot of amperometric events for the indicated groups. (N) Total number of amperometric events after 250 s for the indicated groups. Data were collected from Trpc5fx/0;DBH-Cre, n = 20; Trpc5fx/0;DBH-Cre+, n = 26. Mann–Whitney U test, p = 6.29 × 10⁻⁵, ***p < 0.001. (O) Exemplary amperometric recordings in response to muscarine application for wt and Trpc5–/0 cells. (P) Mean cumulative plot of amperometric events for the indicated groups. Dashed blue lines indicate the beginning and the end of muscarine application (30 μM, 200 s). (Q) Total number of amperometric events after 410 s for the indicated groups. Data were collected from wt, n = 15; Trpc5–/0, n = 10 from 2 independent preparations. Mann–Whitney U test, p = 1.70 × 10⁻⁴, ***p < 0.001. (B, D, F, H, K, N, Q) Mean ± s.e.m. Source data are available online for this figure.
Figure 6
Figure 6. PACAP evokes TRPC channel mediated inward currents and secretion in mouse chromaffin cells.
(A) Exemplary recordings (perforated-patch configuration) of a PACAP-evoked inward current at a holding potential of −70 mV in a wt cell (upper panel) and its cumulative charge plot (lower panel). Note the burst-like current deflections. (B) Repeated application of PACAP to the same cell shown in (A). (C, D) No significant conductance changes could be evoked in Trpc1/4/5–/– cells (1st, (C) and 2nd application (D). (E, F) Time course of mean charge transfer for the 1st (E) and 2nd application of PACAP (F). (G) The PACAP-evoked charge transfer (left panel p = 6.43 × 10⁻⁶) and increase in membrane capacitance (right panel p = 2.75 × 10⁻⁵) are strongly reduced in Trpc1/4/5–/– cells. (H) Changes in membrane capacitance (indicative of exocytosis) correlate well with the charge transfer evoked by PACAP. (EH) Data were collected from 12 WT and 15 Trpc1/4/5–/– cells from 3 independent preparations, mean ± s.e.m., ***p < 0.001, Mann–Whitney U test. Source data are available online for this figure.
Figure 7
Figure 7. PACAP evokes TRPC5 channel mediated inward currents in a PLC-dependent manner.
(A) Exemplary recordings (perforated-patch configuration) of a PACAP-evoked inward current in a wt cell (upper panel), the corresponding cumulative charge plot (middle panel) and membrane capacitance measurement (lower panel). The capacitance increase (ΔCM) in response to the stimulation reflects dense core vesicle exocytosis. (B) PACAP fails to evoke any inward current or secretion in Trpc5–/0 cells. (C) The PLC–inhibitor U-73122 (10 µM) blocks the PACAP induced current and any secretion in wt cells. (D) Genetic loss of TRPC5 or inhibition of the PLC prevents any change in CM (ΔCM) seen in wt cells upon PACAP application. Data were collected from wt, n = 17, Trpc5–/0, n = 15 p = 0.0377 and wt+U-73122, n = 21 p = 0.0026 from 3 independent preparations. (E) The cumulative charge transfer is abolished in the absence of TRPC5 or after PLC inhibition, data were collected from wt, n = 17, Trpc5–/0, n = 15, p = 0.00002 and wt+U-73122, n = 20, p = 0.000011 from 3 independent preparations. (F) Changes in membrane capacitance (indicative of exocytosis) correlate with the charge influx evoked by PACAP-38, data were collected from wt, n = 17, Trpc5–/0, n = 15. Bar graphs are displayed as mean ± s.e.m., Mann–Whitney U test, *p < 0.05, **p < 0.01, ***p < 0.001. Source data are available online for this figure.
Figure 8
Figure 8. PACAP induces long lasting TRPC5 mediated depolarization of the membrane potential.
(A) Exemplary recordings (perforated-patch and current-clamp configuration) of a PACAP-evoked membrane depolarization in wt cells (left panel). No changes in VM could be detected in Trpc5–/0 cells (right panel). (B) Time course of the average PACAP-evoked depolarization of the membrane potential, mean ± s.e.m. (C) PACAP leads to a significant increase in the VM in wt cells but not in Trpc5–/0 cells. Data were collected from wt, n = 13 and Trpc5–/0, n = 14 cells from 3 independent preparations. One-way ANOVA Kruskal Wallis for statistical testing within the group (wt, baseline vs. PACAP p = 0.001; wt baseline vs. washout p = 0.0001) and Mann–Whitney U-test between wt and Trpc5–/0 (wt vs. Trpc5–/0 PACAP, p = 0.00275; Washout, p = 0.000528; **p < 0.01, ***p < 0.001, bar graphs are presented as mean ±s.e.m. Source data are available online for this figure.
Figure 9
Figure 9. Metabolic parallels between TRPC5 deficiency and HAAF.
(A) Plasma levels of lysine, aspartic acid, and taurine (from left to right) for diabetic patients diagnosed with HAAF before (basal) and during controlled hypoglycemia (HG; 60–70 mg/dL). n = 7 for HAAF patients, n = 8 for diabetes patients without HAAF. Lysine, basal, p = 0.0230; Aspartic acid, HG, p = 0.00169; Taurine, HG, p = 0.0166. (B) Plasma levels of lysine, aspartic acid, and taurine 30 min after the injection of saline (basal) or insulin (HG; 2.25 U/kg insulin, i.p.) for mice with Trpc5 deletion in catecholaminergic cells. Trpc5fx/0;DBH-Cre+: n = 13 for insulin, n = 7 for saline; Trpc5fx/0;DBH-Cre: n = 13 for insulin, n = 7 for saline). Lysine, HG, p = 2.08 × 10⁻⁵; Lysine, Trpc5fx/0;DBH-Cre+, p = 2.24 × 10⁻⁶; Taurine, HG, p = 0.000715. HG, hypoglycemia. (A, B) Mean ± s.e.m., *p < 0.05, **p < 0.01, ***p < 0.001, two sample t test. Source data are available online for this figure.

References

    1. Adachi A, Kobashi M, Funahashi M (1995) Glucose-responsive neurons in the brainstem. Obes Res 3(Suppl 5):735S–740S - PubMed
    1. Ayala JE, Bracy DP, Malabanan C, James FD, Ansari T, Fueger PT, McGuinness OP, Wasserman DH (2011) Hyperinsulinemic-euglycemic clamps in conscious, unrestrained mice. J Vis Exp e3188 - PMC - PubMed
    1. Balfour RH, Hansen AM, Trapp S (2006) Neuronal responses to transient hypoglycaemia in the dorsal vagal complex of the rat brainstem. J Physiol 570:469–484 - PMC - PubMed
    1. Battezzati A, Benedini S, Fattorini A, Piceni Sereni L, Luzi L (2000) Effect of hypoglycemia on amino acid and protein metabolism in healthy humans. Diabetes 49:1543–1551 - PubMed
    1. Bauer CC, Minard A, Pickles IB, Simmons KJ, Chuntharpursat-Bon E, Burnham MP, Kapur N, Beech DJ, Muench SP, Wright MH et al (2020) Xanthine-based photoaffinity probes allow assessment of ligand engagement by TRPC5 channels. RSC Chem Biol 1:436–448

LinkOut - more resources