. 2024 Oct;21(10):1873-1883.
doi: 10.1038/s41592-024-02382-8. Epub 2024 Oct 7.

POLCAM: instant molecular orientation microscopy for the life sciences

Affiliations

POLCAM: instant molecular orientation microscopy for the life sciences

Ezra Bruggeman et al. Nat Methods. 2024 Oct.

Abstract

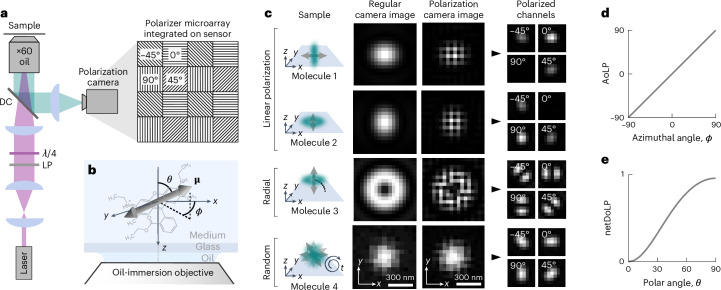
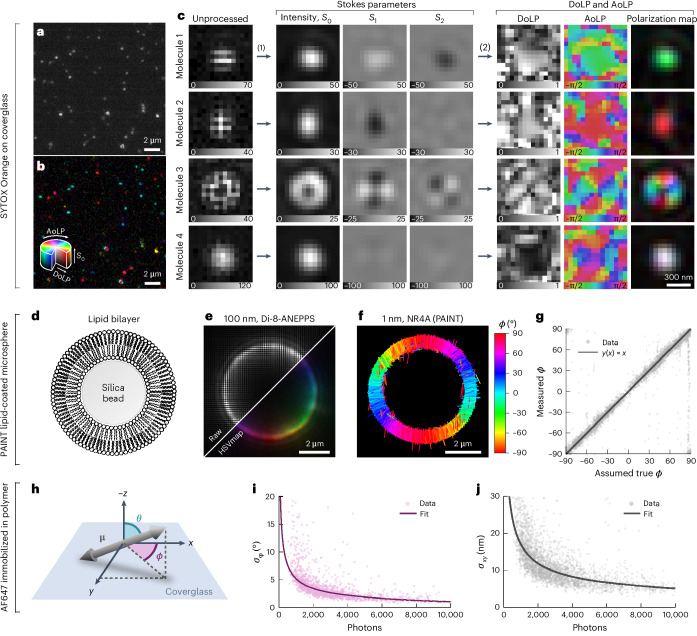
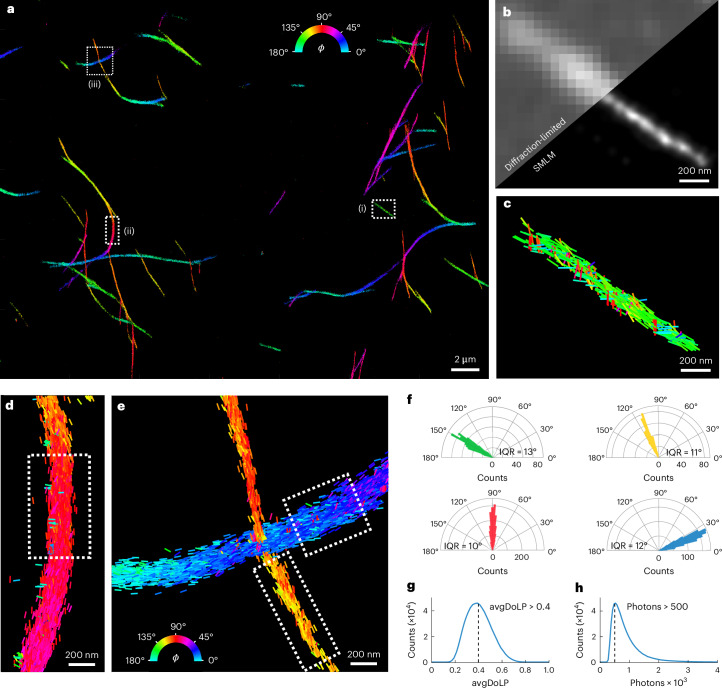
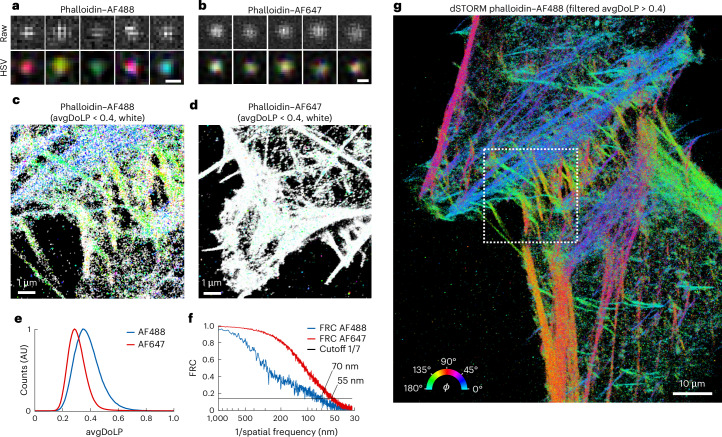
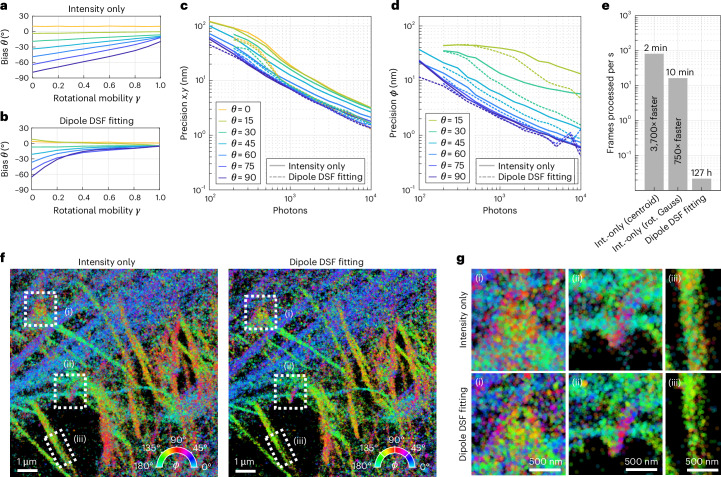
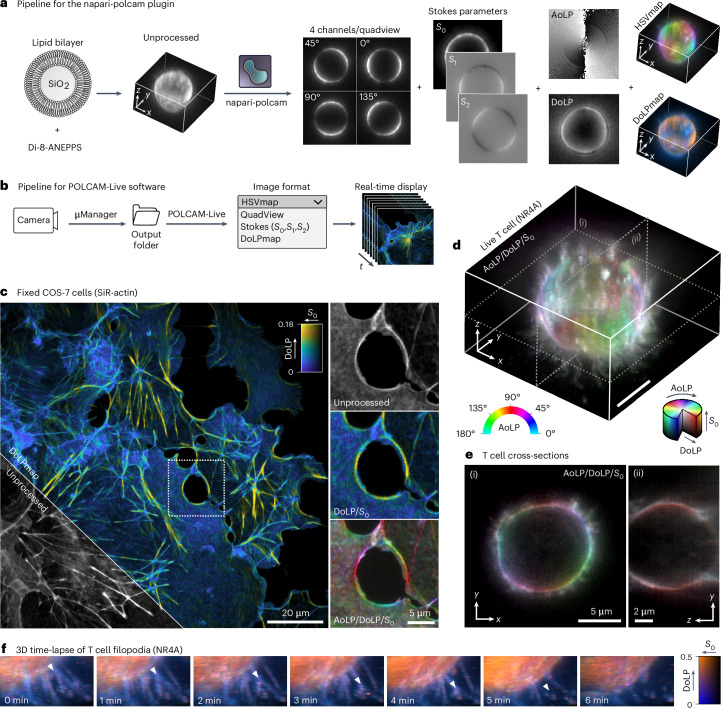
Current methods for single-molecule orientation localization microscopy (SMOLM) require optical setups and algorithms that can be prohibitively slow and complex, limiting widespread adoption for biological applications. We present POLCAM, a simplified SMOLM method based on polarized detection using a polarization camera, which can be easily implemented on any wide-field fluorescence microscope. To make polarization cameras compatible with single-molecule detection, we developed theory to minimize field-of-view errors, used simulations to optimize experimental design and developed a fast algorithm based on Stokes parameter estimation that can operate over 1,000-fold faster than the state of the art, enabling near-instant determination of molecular anisotropy. To aid in the adoption of POLCAM, we developed open-source image analysis software and a website detailing hardware installation and software use. To illustrate the potential of POLCAM in the life sciences, we applied our method to study α-synuclein fibrils, the actin cytoskeleton of mammalian cells, fibroblast-like cells and the plasma membrane of live human T cells.


Conflict of interest statement

The authors declare no competing interests.

Figures

Fig. 1
Fig. 1. Single-molecule imaging using a polarization camera.
a, Schematic of the optical setup that includes the polarization camera and a schematic representation of a small region of the four-directional micropolarizer array (transmission axis at 0°, 45°, 90° or −45°) integrated into the sensor. LP, linear polarizer; λ/4, quarter-wave plate; DC, dichroic. b, Definition of the in-plane angle ϕ and the out-of-plane angle θ that specify the orientation of the emission dipole moment (arrow) of a molecule (structure of rhodamine 6G depicted). c, Simulated examples of four single fluorescent molecules. From top to bottom, a molecule aligned with the x axis (first row), the y axis (second row), the optical axis (z axis) (third row) and a rapidly rotating molecule (fourth row). For each example, the following is shown: the image plane recorded with a regular monochrome camera and the image plane recorded with a polarization camera in its raw format and in a format where the pixels have been rearranged to form four images that are each made up only of pixels that are covered by a micropolarizer with the same transmission axis orientation. d, Relationship between the average AoLP and the in-plane angle ϕ of the dipole moment. e, Relationship between the netDoLP and the out-of-plane angle θ of the dipole moment of a rotationally immobilized molecule for a 1.4-NA oil-immersion objective and no refractive index mismatch between the sample and the immersion medium.
Fig. 2
Fig. 2. Single-molecule detection, experimental bias and precision.
a, An unprocessed polarization camera image of SYTOX Orange molecules dispersed on a coverglass in PBS. b, The same image as in a but processed to reveal polarization information using a polarization color map that combines the AoLP, the DoLP and the intensity (S0) in HSV (hue, saturation, value) color space (hue, AoLP; saturation, DoLP; value, S0). c, Examples of four SYTOX Orange molecules with their emission dipole moment parallel to the sample plane (molecules 1 and 2), parallel to the optical axis (molecule 3) and rapidly rotating (molecule 4). For each, the unprocessed image, estimated Stokes parameter images (S0, S1 and S2), the AoLP, the DoLP and polarization color map images are shown. d, Illustration of a silica microsphere (5 μm in diameter) coated using a lipid bilayer (DPPC with 40% cholesterol). e, Diffraction-limited image of a cross-section at a z plane in the middle of a lipid bilayer-coated silica microsphere labeled using the membrane dye Di-8-ANEPPS. f, POLCAM SMOLM reconstruction of a cross-section of a lipid bilayer-coated silica microsphere acquired through PAINT with Nile red. Each localization is drawn as a rod with a direction indicating the estimated in-plane angle ϕ. g, An experimental bias curve for the estimation of ϕ generated using a PAINT dataset such as the one shown in f. h, Illustration of the angles specifying the orientation of the emission dipole moment. i,j, Experimental precision from repeated localization and orientation estimation on AF647 immobilized in polyvinyl alcohol (PVA). The precision is the measured standard deviation on repeated measurement of the position (x, y) (j) and the in-plane angle ϕ (i) of the same molecule. Photon numbers are averages. Measurements between n = 12 and n = 40 are used to calculate the standard deviation. A power law was fitted to the data.
Fig. 3
Fig. 3. TAB-PAINT imaging of α-synuclein fibrils in vitro.
a, A POLCAM SMOLM reconstruction of α-synuclein fibrils, color coded by the in-plane angle ϕ of the emission dipole moment of the Nile red molecules. b, Diffraction-limited image and SMLM reconstruction of inset (i) from a. ce, Detail of insets (i) (c), (ii) (d) and (iii) (e) in a, where individual localizations are drawn as rods. The orientation and color of the rods indicate the measured ϕ. f, Polar histograms of the fibrils shown in c (green), and segments are indicated by the dotted boxes drawn in d (red) and f (yellow and blue). The interquartile range (IQR) of the distributions is displayed below the respective histograms. g, Histogram of the avgDoLP of the data shown in a, including the avgDoLP threshold used to exclude localizations with high rotational mobility when displaying ϕ-color-coded reconstructions. h, Histogram of the number of detected photons per molecule per frame for the dataset shown in a. The minimum number of detected photons (500 photons) is also indicated.
Fig. 4
Fig. 4. dSTORM imaging of actin in fixed HeLa cells.
a, Representative examples of images of single AF488 molecules from the dSTORM datasets of phalloidin–AF488, unprocessed (top) and as an HSV (hue, AoLP; saturation, DoLP; value, S0) color map (bottom). Scale bar, 300 nm. b, The same as in a, but for AF647. Scale bar, 300 nm. c, POLCAM SMOLM reconstruction of a phalloidin–AF488 dSTORM dataset in the form of a modified ϕ-color-coded scatterplot. All localizations with an avgDoLP < 0.4 are colored white to indicate that they have high rotational mobility. d, The same as c, but for phalloidin–AF647. e, Comparison of the avgDoLP distribution of single molecules from the phalloidin–AF488 and phalloidin–AF647 datasets. AU, arbitrary units. f, FRC curves for the phalloidin–AF488 (70-nm FRC resolution) and phalloidin–AF647 (55-nm FRC resolution) dSTORM datasets. g, ϕ-Color-coded scatterplot of the full dataset from inset c (marked by the dotted box), displaying only the points with avgDoLP > 0.4 (that is, localizations with high rotational mobility are not displayed).
Fig. 5
Fig. 5. Improving accuracy and precision by considering the DSF shape.
a, The bias on the estimation of the out-of-plane angle θ as a function of rotational mobility γ for the intensity-only algorithm, determined using simulated images of single dipole emitters (using 1,000 photons per emitter and ten background photons per pixel). A rotational mobility parameter γ of 0 corresponds to total rotational freedom, and a value of 1 corresponds to perfect rotational immobilization. b, The same as a but for the DSF-fitting algorithm. c, Lateral localization precision as a function of the number of detected photons as determined from simulations (ten background photons per pixel, γ = 1). Separate curves are shown for molecules at different out-of-plane orientations. d, The same as c but for the precision of ϕ estimation. e, The computer processing time for the datasets from f for the intensity (int.)-only algorithm with centroid localization, the intensity-only algorithm with least-squares fitting of a rotated (rot.) asymmetric Gaussian (Gauss) and the DSF-fitting algorithm. Refer to the Methods for computer specifications. f, A POLCAM SMOLM reconstruction of a 200 × 200-pixel region from Fig. 4 with 10,000 frames, as analyzed by the intensity-only algorithm (with rotated asymmetric Gaussian fitting) and the DSF-fitting algorithm. Both reconstructions were rendered using approximately the same number of localizations (258,251 localizations for the intensity-only algorithm, 258,172 localizations for the DSF-fitting algorithm). g, Insets from the regions in f that are marked by dotted boxes. The insets display some structural differences between the reconstructions generated by the two algorithms.
Fig. 6
Fig. 6. Diffraction-limited polarization microscopy using POLCAM.
a, Image processing workflow of the napari plugin napari-polcam, demonstrated on an example 3D dataset of a lipid bilayer-coated silica microsphere labeled with the membrane dye Di-8-ANEPPS. b, Workflow of POLCAM-Live software for real-time processing and rendering of polarization camera images during image acquisition. c, Diffraction-limited polarization camera image of fixed COS-7 cells labeled with SiR–actin, rendered using a DoLP color map. An inset marked by a dotted square is shown in an unprocessed, DoLP color map and an HSV polarization color map. d, A 3D image of the plasma membrane (using the dye NR4A) of a live T cell. e, Two cross-sections of the T cell shown in d. f, A 3D time-lapse of the movement of the filopodia of a live T cell rendered using a DoLP color map. Randomly polarized regions appear blue (filopodia) and more structured, and therefore polarized areas (larger, more smooth sections of the plasma membrane surface) appear orange. A white triangle tracks the movement of what appears to be a branching point on a filopodium.

References

    1. Betzig, E. et al. Imaging intracellular fluorescent proteins at nanometer resolution. Science313, 1642–1645 (2006). - DOI - PubMed
    1. Rust, M., Bates, M. & Zhuang, X. Sub-diffraction-limit imaging by stochastic optical reconstruction microscopy (STORM). Nat. Methods3, 793–795 (2006). - DOI - PMC - PubMed
    1. Hess, S., Girirajan, T. & Mason, M. Ultra-high resolution imaging by fluorescence photoactivation localization microscopy. Biophys. J.91, 4258–4272 (2006). - DOI - PMC - PubMed
    1. Sharonov, A. & Hochstrasser, R. Wide-field subdiffraction imaging by accumulated binding of diffusing probes. Proc. Natl Acad. Sci. USA103, 18911–18916 (2006). - DOI - PMC - PubMed
    1. Xu, K., Zhong, G. & Zhuang, X. Actin, spectrin, and associated proteins form a periodic cytoskeletal structure in axons. Science339, 452–456 (2013). - DOI - PMC - PubMed

Substances

LinkOut - more resources