. 2024 Oct 7;24(1):1116.
doi: 10.1186/s12879-024-09999-2.

Associations between clinical data, vaccination status, antibody responses, and post-COVID-19 symptoms in Thais infected with SARS-CoV-2 Delta and Omicron variants: a 1-year follow-up study

Affiliations

Associations between clinical data, vaccination status, antibody responses, and post-COVID-19 symptoms in Thais infected with SARS-CoV-2 Delta and Omicron variants: a 1-year follow-up study

Wathusiri Khongsiri et al. BMC Infect Dis. .

Abstract

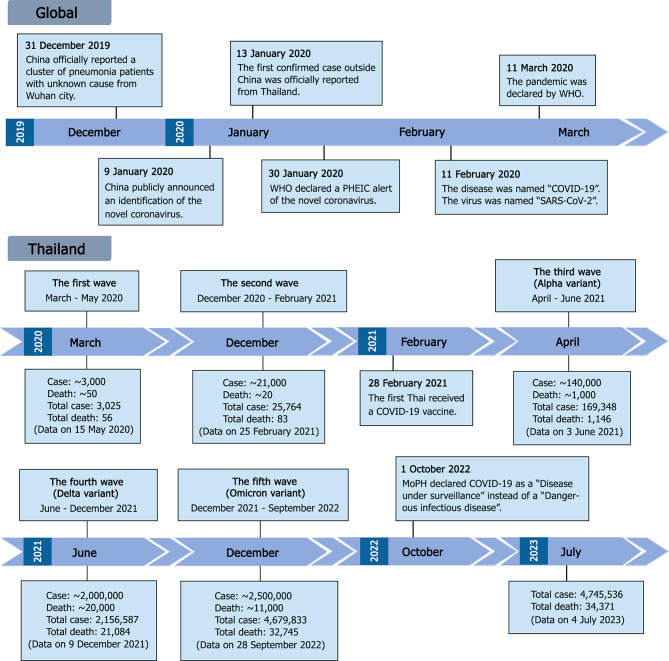
Background: Severe acute respiratory syndrome coronavirus 2 (SARS-CoV-2), which causes coronavirus disease 2019 (COVID-19), led to a global pandemic from 2020. In Thailand, five waves of outbreaks were recorded, with the fourth and fifth waves driven by the Delta and Omicron variants, resulting in over 20,000 new confirmed cases daily at their peaks.

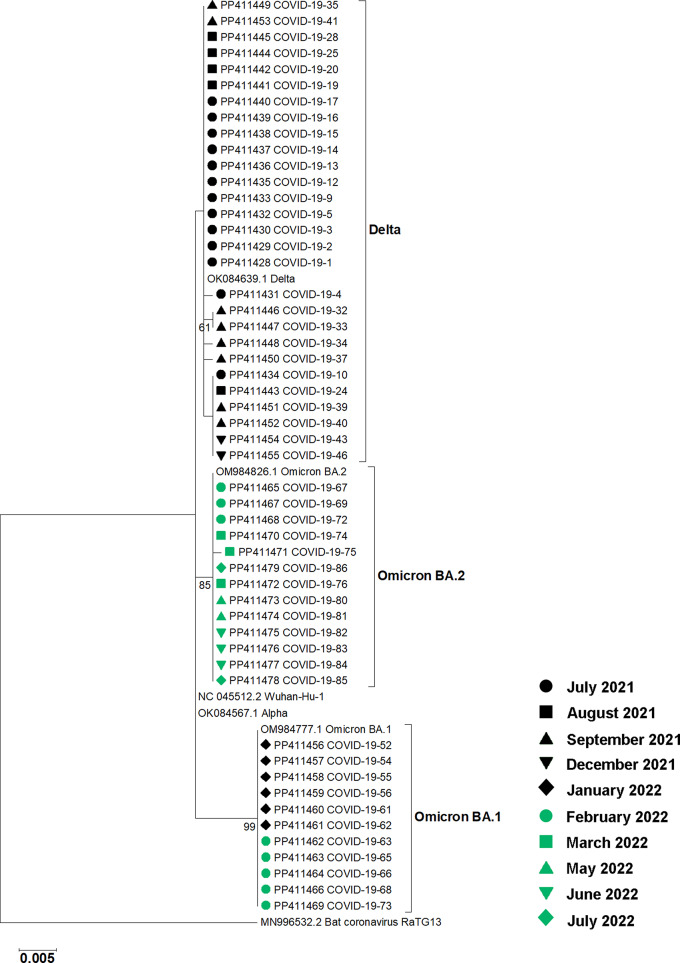
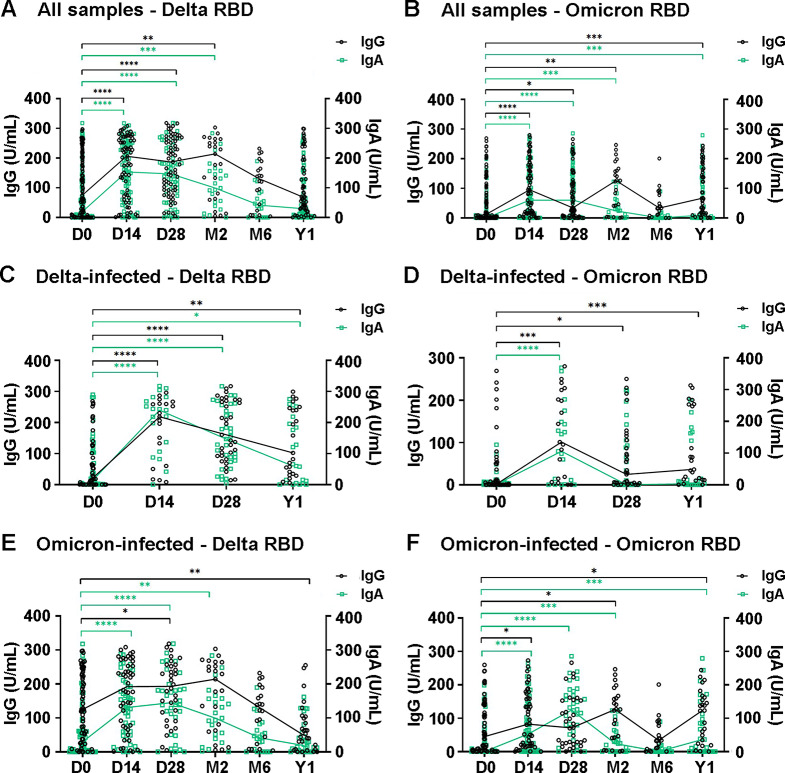
Methods: This cross-sectional study investigated the associations between clinical symptoms, vaccination status, antibody responses, and post-COVID-19 sequelae in COVID-19 patients. Plasma samples and clinical data were collected from participants admitted to hospitals in Thailand between July 2021 and August 2022, with follow-ups conducted for one year. The study included 110 participants infected with either the Delta (n = 46) or Omicron (n = 64) variants. Virus genotypes were confirmed by RT-PCR of nasal swab RNA and partial nucleotide sequencing of the S gene. IgG and IgA antibody levels against the receptor-binding domain (RBD) of SARS-CoV-2 Delta and Omicron variants were measured in plasma samples using ELISA.

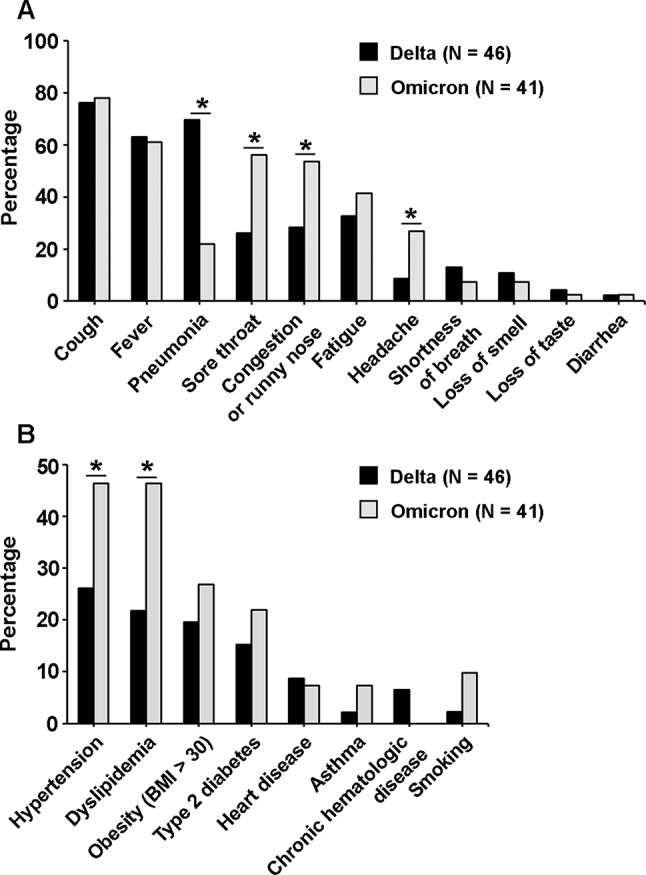
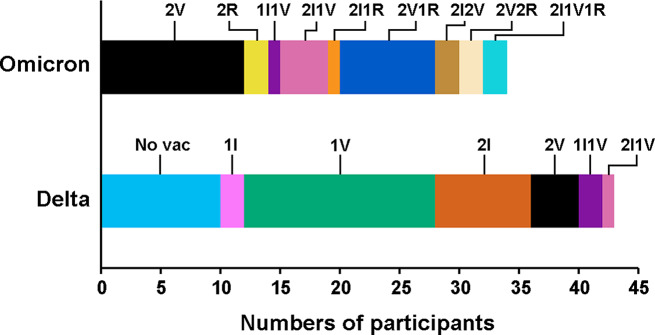
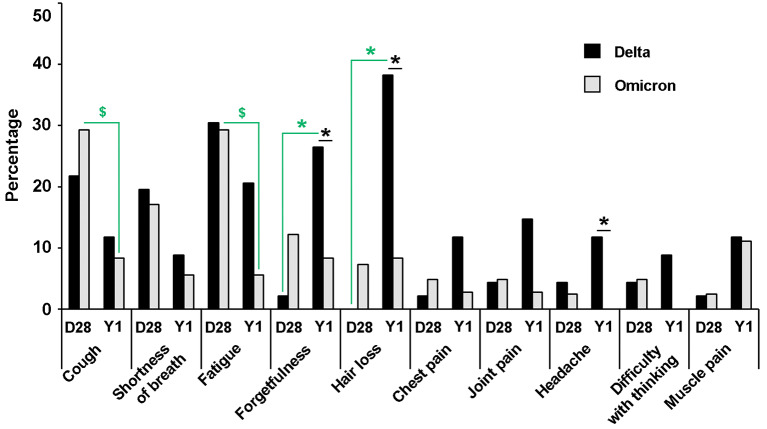
Results: Pneumonia was found to be associated with Delta variant infections, while sore throat, congestion or runny nose, and headache were linked to Omicron infections. Vaccination with fewer than two doses and diabetes mellitus were significantly associated with higher disease severity. Specific IgG and IgA antibodies against the RBD of the Delta variant generally rose by day 14 and were maintained for up to two months, whereas the pattern of antibody response to the Omicron variant was less clear. Antibody risings were found to be positively associated with pneumonia, certain underlying conditions (obesity, hypertension, dyslipidemia, and diabetes mellitus), and age ≥ 60 years. Delta variant infections were associated with forgetfulness, hair loss, and headache during the 1-year post-infection period. Females were more likely to experience hair loss, forgetfulness, and joint pain, while older age was associated with joint pain.

Conclusions: This study enhances our understanding of SARS-CoV-2 infections in Thais, particularly concerning the Delta and Omicron variants. The findings can inform public health planning and response strategies for future outbreaks of SARS-CoV-2 or other emerging viral diseases.

Keywords: Antibody response; COVID-19; Delta; ELISA; Omicron; SARS-CoV-2; Thailand.


Conflict of interest statement

The authors declare no competing interests.

Figures

Fig. 1
Fig. 1
Timeline of COVID-19 pandemic progression and important events at global and national levels (Thailand). PHEIC, Public Health Emergency of International Concern; MoPH, Ministry of Public Health of Thailand; Case and Death, number of cases and deaths reported during a specific COVID-19 wave; Total case and Total death, cumulative cases and deaths reported by the Thai MoPH
Fig. 2
Fig. 2
Phylogenetic analysis of SARS-CoV-2 partial S gene sequences from 52 nasal swab samples collected at Hospital A. The tree was constructed using the maximum likelihood method with a bootstrap value of 1,000. Accession numbers for sequences obtained in this study and reference sequences are shown. Labels indicating the months of sample collection are shown. Bootstrap values greater than 50 are indicated at the nodes. The bar represents nucleotide substitutions per site. A bat coronavirus sequence was used as an outgroup
Fig. 3
Fig. 3
Clinical presentations and underlying conditions of participants infected with SARS-CoV-2 Delta or Omicron variants from Hospital A. The percentage of participants presenting with different clinical symptoms (A) and underlying conditions (B) were compared between those infected with the Delta variant (black bars, n = 46) and the Omicron variant (grey bars, n = 41). A chi-square test was used to identify clinical presentations or underlying conditions associated with infection by a particular SARS-CoV-2 variant. Stars indicate statistical significance at p ≤ 0.05
Fig. 4
Fig. 4
COVID-19 vaccination history of participants from Hospital A prior to SARS-CoV-2 infection. Vaccination history was available for 77 participants, with 43 infected by the Delta variant and 34 by the Omicron variant. Different vaccine combinations are represented by color labels: No vac, no history of COVID-19 vaccination; I, inactivated vaccine; V, viral vector vaccine; R, mRNA vaccine
Fig. 5
Fig. 5
Levels of RBD-specific IgG and IgA antibodies in plasma over a one-year follow-up period. IgG levels are represented on the left y-axis, and IgA levels on the right y-axis. (A) and (B) show antibody levels to the RBD of Delta and Omicron variants, respectively, in all samples. (C) and (D) show antibody levels in Delta-infected samples from Hospital A. (E) and (F) show antibody levels in Omicron-infected samples from Hospitals A, B, and C. The Mann-Whitney U test was used to compare the medians of non-normally distributed data. *, p ≤ 0.05; **, p ≤ 0.01; ***, p ≤ 0.001; and ****, p ≤ 0.0001 indicate statistical significance
Fig. 6
Fig. 6
Post-COVID-19 sequelae reported at day 28 and one year after infection. The percentage of participants reporting different sequelae is shown for groups infected with the Delta variant (black bars) and the Omicron variant (grey bars). Pearson’s chi-square test was used to compare the number of participants reporting post-COVID-19 sequelae between groups infected with different variants and at different time points post-infection. Stars and dollar signs indicate statistical significance at p ≤ 0.05. Green stars represent significant differences in Delta-infected participants between day 28 and year 1. Green dollar signs represent significant differences in Omicron-infected participants between day 28 and year 1. Black stars represent significant differences between Delta and Omicron infections

References

    1. Bakhshandeh B, Jahanafrooz Z, Abbasi A, Goli MB, Sadeghi M, Mottaqi MS, et al. Mutations in SARS-CoV-2; consequences in structure, function, and pathogenicity of the virus. Microb Pathog. 2021;154:104831. - PMC - PubMed
    1. Hu B, Guo H, Zhou P, Shi ZL. Characteristics of SARS-CoV-2 and COVID-19. Nat Rev Microbiol. 2021;19:141–54. - PMC - PubMed
    1. Zhao J, Wang W, Yuan Z, Jia R, Zhao Z, Xu X, et al. A study on antigenicity and receptor-binding ability of fragment 450–650 of the spike protein of SARS coronavirus. Virology. 2007;359:362–70. - PMC - PubMed
    1. Ortiz-Prado E, Simbaña-Rivera K, Gómez-Barreno L, Rubio-Neira M, Guaman LP, Kyriakidis NC, et al. Clinical, molecular, and epidemiological characterization of the SARS-CoV-2 virus and the Coronavirus Disease 2019 (COVID-19), a comprehensive literature review. Diagn Microbiol Infect Dis. 2020;98:115094. - PMC - PubMed
    1. Mohan BS, Nambiar V. COVID-19: an insight into SARS-CoV-2 pandemic originated at Wuhan city in Hubei Province of China. J Infect Dis Epidemiol. 2020;6:146.

MeSH terms

Supplementary concepts

LinkOut - more resources