. 2024 Oct 7;25(1):938.
doi: 10.1186/s12864-024-10851-9.

Characteristics of gene expression in epicardial adipose tissue and subcutaneous adipose tissue in patients at risk for heart failure undergoing coronary artery bypass grafting

Affiliations

Characteristics of gene expression in epicardial adipose tissue and subcutaneous adipose tissue in patients at risk for heart failure undergoing coronary artery bypass grafting

Christoffer Frisk et al. BMC Genomics. .

Abstract

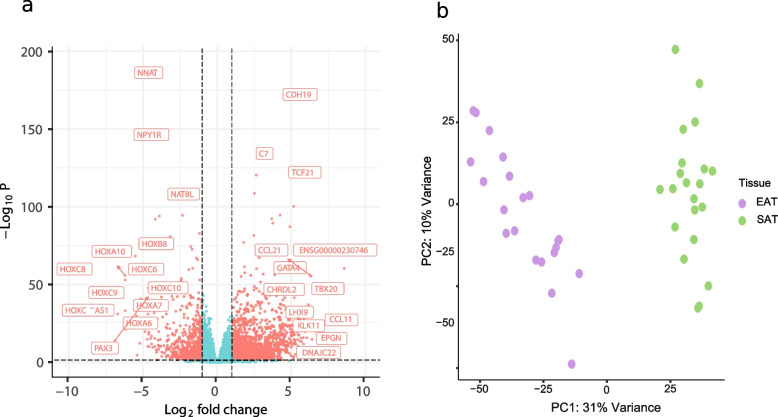
Background: Epicardial adipose tissue (EAT) surrounds the heart and is hypothesised to play a role in the development of heart failure (HF). In this study, we first investigated the differences in gene expression between epicardial adipose tissue (EAT) and subcutaneous adipose tissue (SAT) in patients undergoing elective coronary artery bypass graft (CABG) surgery (n = 21; 95% male). Secondly, we examined the association between EAT and SAT in patients at risk for HF stage A (n = 12) and in pre-HF patients, who show signs but not symptoms of HF, stage B (n = 9).

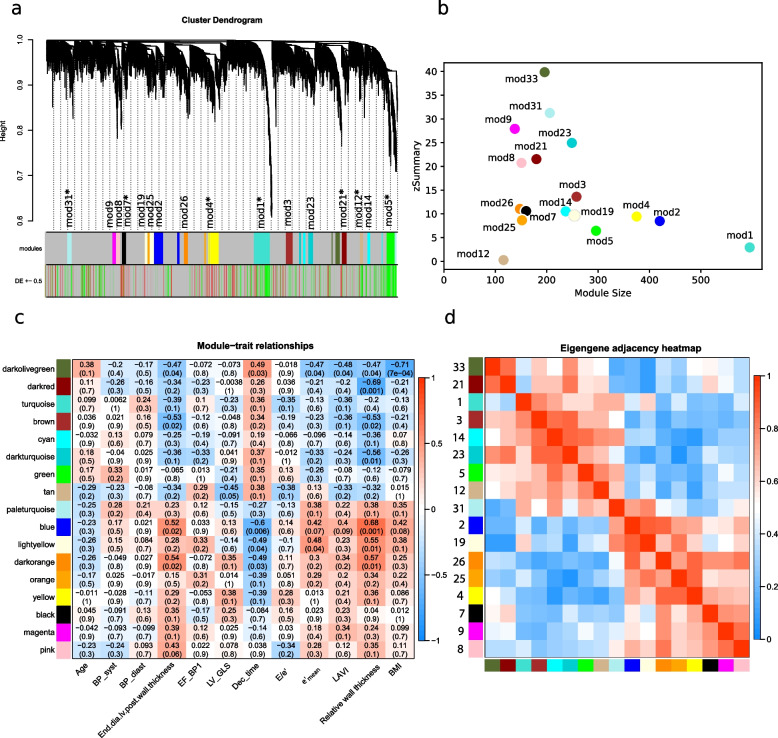
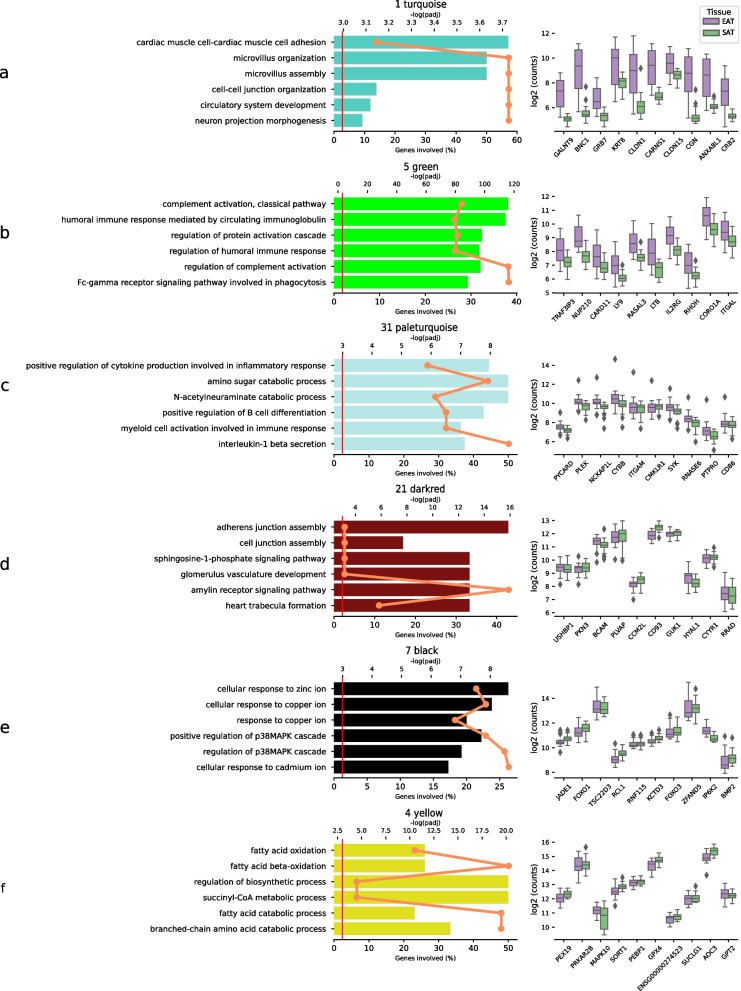
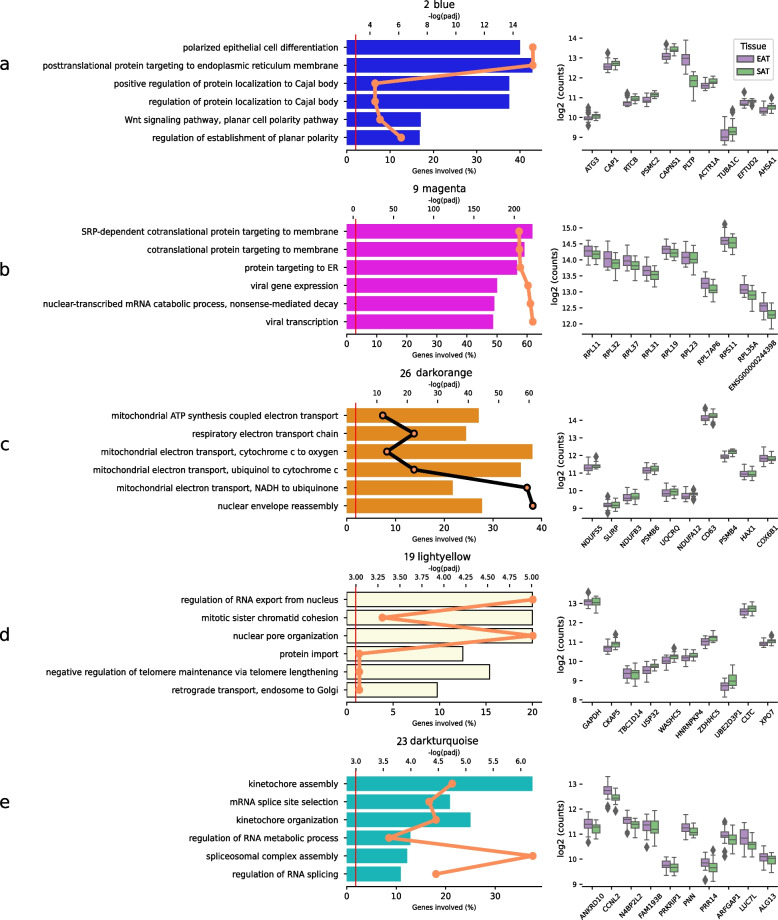
Results: The study confirmed a distinct separation between EAT and SAT. In EAT 17 clusters of genes were present, of which several novel gene modules are associated with characteristics of HF. Notably, seven gene modules showed significant correlation to measures of HF, such as end diastolic left ventricular posterior wall thickness, e'mean, deceleration time and BMI. One module was particularly distinct in EAT when compared to SAT, featuring key genes such as FLT4, SEMA3A, and PTX3, which are implicated in angiogenesis, inflammation regulation, and tissue repair, suggesting a unique role in EAT linked to left ventricular dysfunction. Genetic expression was compared in EAT across all pre-HF and normal phenotypes, revealing small genetic changes in the form of 18 differentially expressed genes in ACC/AHA Stage A vs. Stage B.

Conclusions: The roles of subcutaneous and epicardial fat are clearly different. We highlight the gene expression difference in search of potential modifiers of HF progress. The true implications of our findings should be corroborated in other studies since HF ACC/AHA stage B patients are common and carry a considerable risk for progression to symptomatic HF.

Keywords: Bioinformatics; Epicardial adipose tissue; Gene expression; Heart failure; Weighted gene cluster.


Conflict of interest statement

The authors declare no competing interests.

Figures

Fig. 1
Fig. 1
a Volcano plot displaying differentially expressed genes between EAT and SAT with x axis representing log2 fold change and y axis the adjusted p-value. Significant (FDR adjusted p-values ≤ 0.05) genes with |log2FC|> 0.5 coloured in orange. b PCA score plot showing sample distribution over component 1 and 2 in x- and y-axis, respectively. Epicardial samples are coloured blue and subcutaneous orange
Fig. 2
Fig. 2
a Gene cluster dendrogram with height representing 1–biweight midcorrelation in the y axis. Gene module membership is represented by colour in the first row with unassigned genes in grey. The second row show the differential expression of genes between EAT and SAT, where genes with a log2FC above 0.5 are shown in green, and those below –0.5 in red. Modules with significant (p ≤ 0.05) enrichment displayed with asterisks. b Scatter plot visualisation of module preservation represented in with module size in x axis and zSummary score in y axis. c Pearson correlation between modules and echo parameters. Heatmap displays correlation values with p-values within parentheses. Correlations are coloured red and blue for negative and positive correlations, respectively. Echo variables with no significant correlation in any module were omitted. d Eigengene correlation matrix over all modules ranging from no correlation (0) to strong correlation (1)
Fig. 3
Fig. 3
Enrichment analysis and top hub gene expression levels. All modules in the figure contains enrichment for DE genes. The bar plot displays GO enrichment for each term, with the top x-axis representing the –log(padj) values plotted as a line and the bottom x-axis indicating the percentage of involved genes. The GO terms are ordered by EnrichR's combined score. Adjacent to the GO plot, the box plot presents the expression levels in the top 10 highest-ranked hub genes within the module
Fig. 4
Fig. 4
Enrichment analysis and top hub gene expression levels of modules with no significant enrichment of DE genes. The bar plot displays GO enrichment for each term, with the top x-axis representing the –log(padj) values plotted as a line and the bottom x-axis indicating the percentage of involved genes and the top x-axis. The GO terms are ordered by EnrichR's combined score. Adjacent to the GO plot, the box plot presents the expression levels in the top 10 highest-ranked hub genes within the module

References

    1. Villasante Fricke AC, Iacobellis G. Epicardial adipose tissue: clinical biomarker of cardio-metabolic risk. Int J Mol Sci. 2019;20:5989. - PMC - PubMed
    1. Shah SJ, Kitzman DW, Borlaug BA, van Heerebeek L, Zile MR, Kass DA, et al. Phenotype-specific treatment of heart failure with preserved ejection fraction: a multiorgan roadmap. Circulation. 2016;134:73–90. - PMC - PubMed
    1. Packer M. Epicardial adipose tissue may mediate deleterious effects of obesity and inflammation on the myocardium. J Am Coll Cardiol. 2018;71:2360–72. - PubMed
    1. Iacobellis G, Corradi D, Sharma AM. Epicardial adipose tissue: anatomic, biomolecular and clinical relationships with the heart. Nat Clin Pract Cardiovasc Med. 2005;2:536–43. - PubMed
    1. Cherian S, Lopaschuk GD, Carvalho E. Cellular cross-talk between epicardial adipose tissue and myocardium in relation to the pathogenesis of cardiovascular disease. Am J Physiol-Endocrinol Metab. 2012;303:E937–49. - PubMed