. 2024 Oct 18;13(10):3413-3429.
doi: 10.1021/acssynbio.4c00473. Epub 2024 Oct 7.

CRISPR-GEM: A Novel Machine Learning Model for CRISPR Genetic Target Discovery and Evaluation

Affiliations

CRISPR-GEM: A Novel Machine Learning Model for CRISPR Genetic Target Discovery and Evaluation

Joshua P Graham et al. ACS Synth Biol. .

Abstract

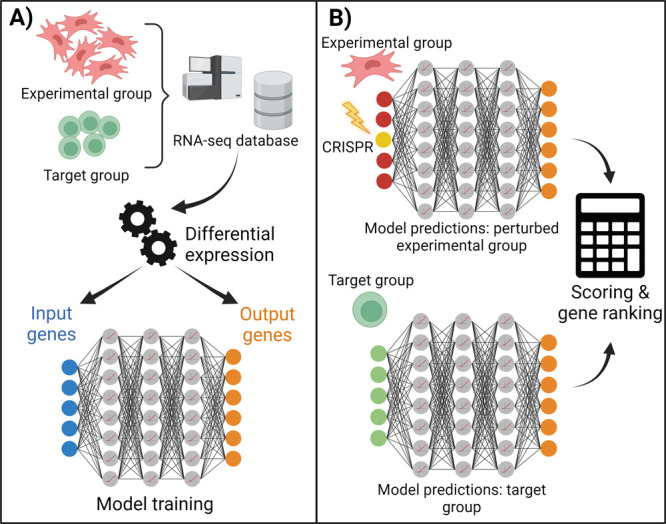
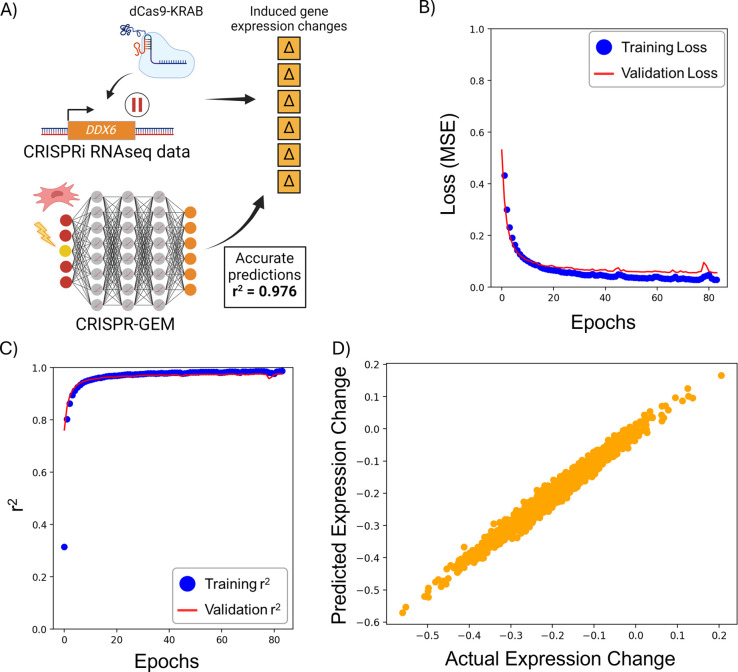
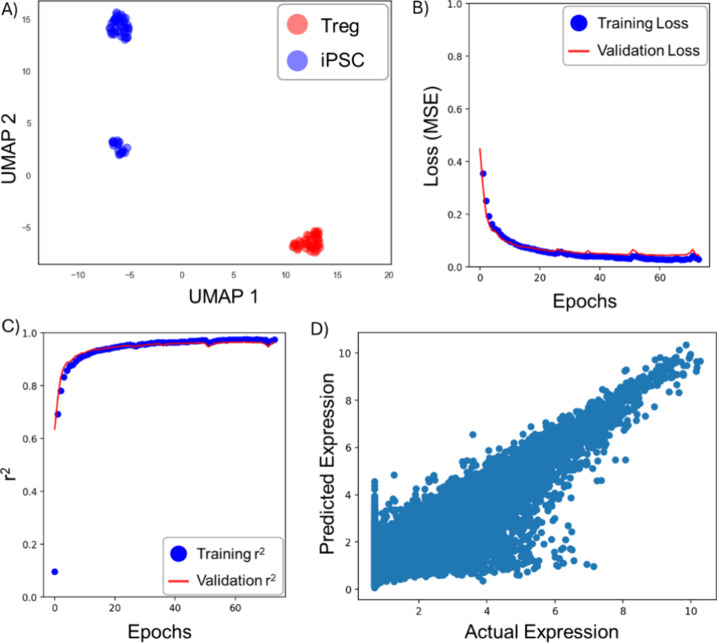
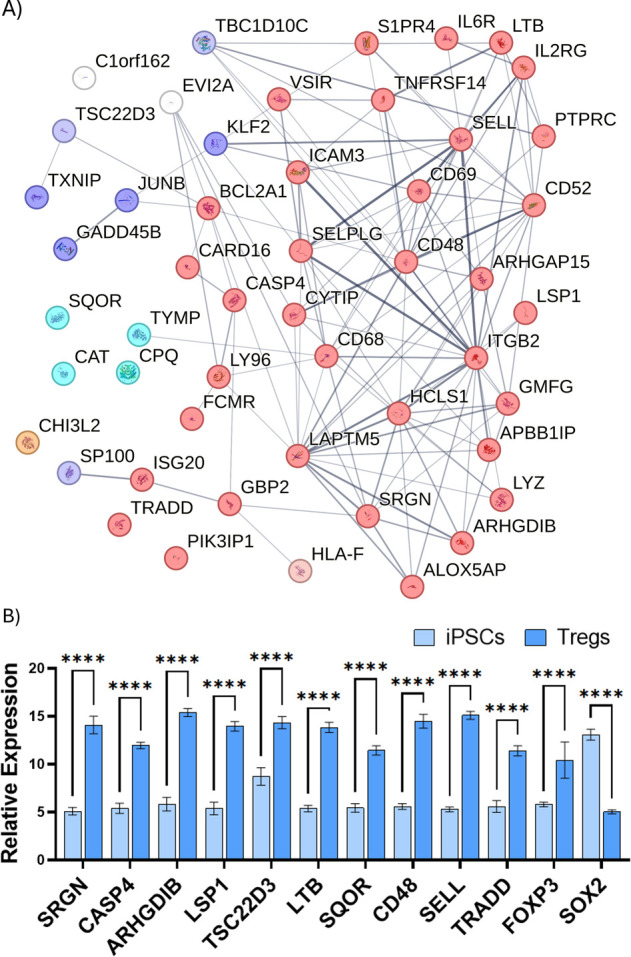
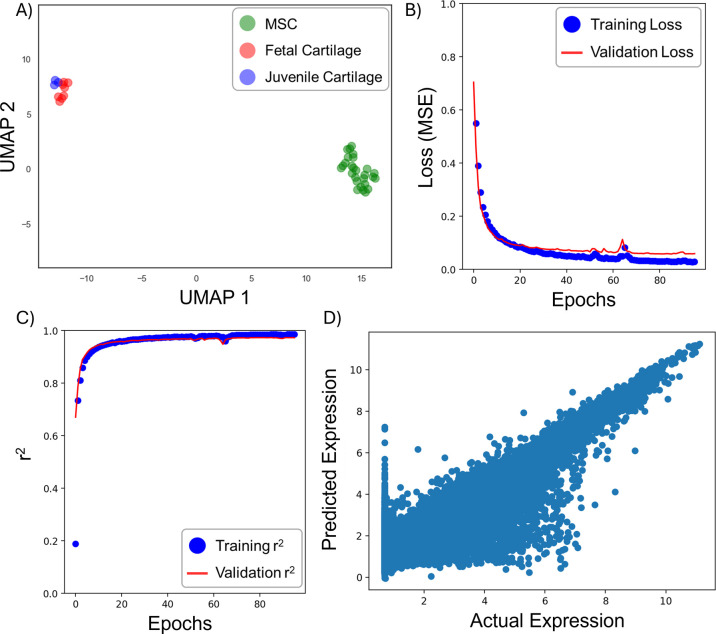
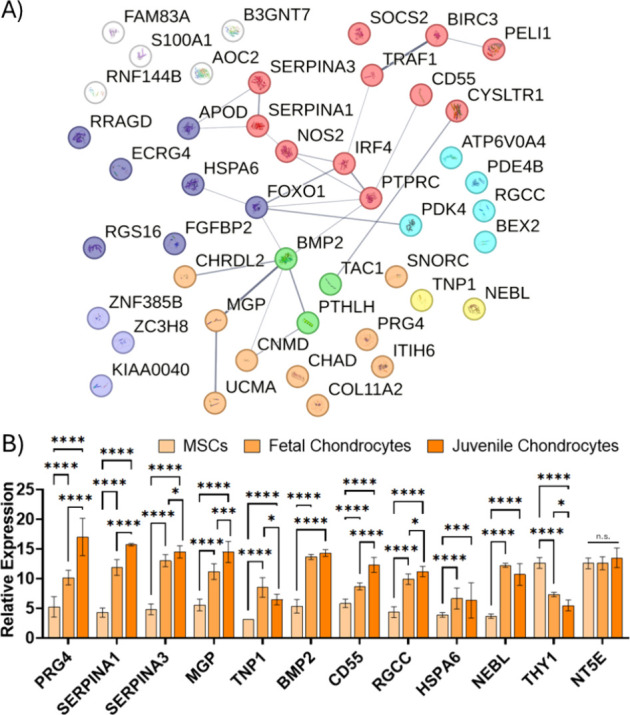
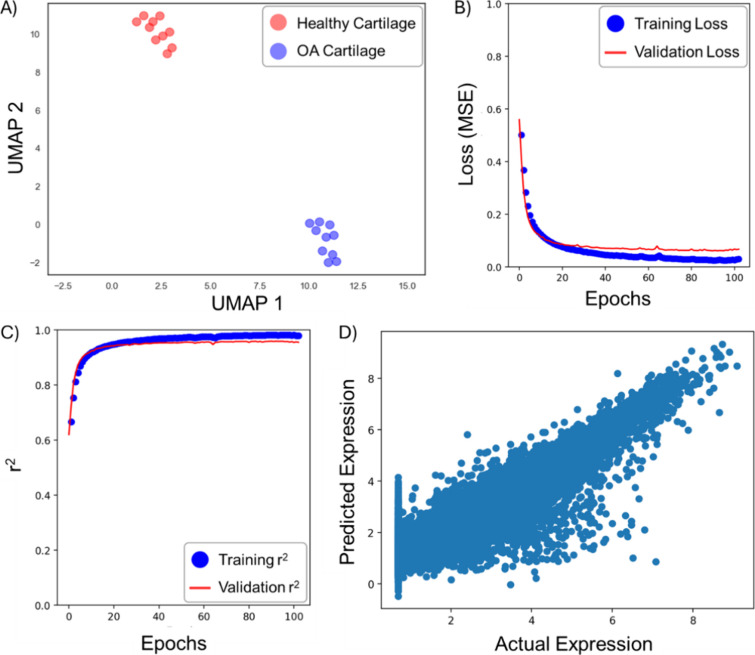
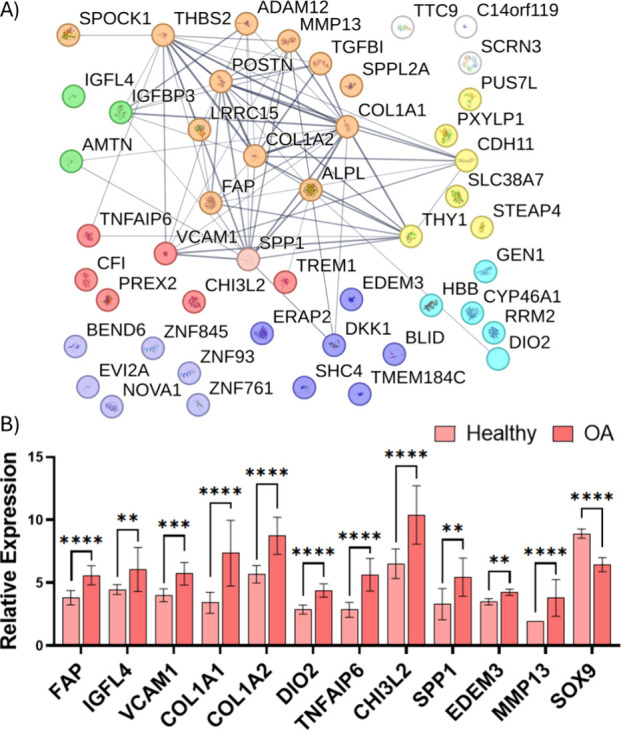
CRISPR gene editing strategies are shaping cell therapies through precise and tunable control over gene expression. However, limitations in safely delivering high quantities of CRISPR machinery demand careful target gene selection to achieve reliable therapeutic effects. Informed target gene selection requires a thorough understanding of the involvement of target genes in gene regulatory networks (GRNs) and thus their impact on cell phenotype. Effective decoding of these complex networks has been achieved using machine learning models, but current techniques are limited to single cell types and focus mainly on transcription factors, limiting their applicability to CRISPR strategies. To address this, we present CRISPR-GEM, a multilayer perceptron (MLP) based synthetic GRN constructed to accurately predict the downstream effects of CRISPR gene editing. First, input and output nodes are identified as differentially expressed genes between defined experimental and target cell/tissue types, respectively. Then, MLP training learns regulatory relationships in a black-box approach allowing accurate prediction of output gene expression using only input gene expression. Finally, CRISPR-mimetic perturbations are made to each input gene individually, and the resulting model predictions are compared to those for the target group to score and assess each input gene as a CRISPR candidate. The top scoring genes provided by CRISPR-GEM therefore best modulate experimental group GRNs to motivate transcriptomic shifts toward a target group phenotype. This machine learning model is the first of its kind for predicting optimal CRISPR target genes and serves as a powerful tool for enhanced CRISPR strategies across a range of cell therapies.

Keywords: CRISPR gene editing; MSC chondrogenesis; gene regulatory network; machine learning; osteoarthritis; regulatory T cell.


Conflict of interest statement

The authors declare no competing financial interest.

Figures

Figure 1
Figure 1
Schematic of CRISPR-GEM. A) Constructing tissue specific GRNs to predict gene expression relevant to the selected CRISPR therapy. DeSeq2 is utilized to select plausible CRISPR candidates and identify important genes for distinguishing experimental and target cell/tissue types. The resulting genes are used as input and output nodes respectively to train a MLP to predict the expression of output genes using only the expression of input genes. B) Assessing CRISPR strategies using the constructed GRN. RNA-seq data for the experimental group is perturbed by amplifying or suppressing the relative expression value of each gene individually. The perturbed experimental group data set and an unmodified target group data set are input into the trained MLP and model predictions for each are compared to assess the efficacy of the editing strategy for driving the target group transcriptomic profile.
Figure 2
Figure 2
CRISPR-GEM accurately predicts experimental gene expression changes. A) Experimental RNA-seq data for a CRISPRi experiment where DDX6 was inhibited was downloaded using GEO accession GSE112479. The changes in gene expression resulting from CRISPRi were compared to the predictions made by CRISPR-GEM when simulating the same gene editing approach. B) DNN training resulted in a model that could predict testing data output gene expression with an MSE of 0.0842 ± 0.0016 and C) an r2 of 0.962 ± 0.001. D) This resulted in a strong linear correlation between actual gene expression changes and those predicted by the model (r2 of 0.976 ± 0.0030).
Figure 3
Figure 3
Model Training results given by CRISPR-GEM predictions for CRISPRa candidates to drive Treg differentiation. A) Treg cells display distinct phenotypes from iPSCs as visualized in reduced dimension via UMAP projection, B) Model training predicted output gene expression with an MSE of 0.051 ± 0.002, C) an r2 of 0.952 ± 0.002 (p = 1.11 · 10–16). These results suggest that the CRISPR-GEM neural network can predict over 95% of the transcriptomic variance throughout the iPSC-Treg transition, and D) The strong linear trend between actual and predicted output gene expression values verifies model accuracy.
Figure 4
Figure 4
Assessment of model predictions for the optimal CRISPRa targets to drive Treg differentiation from iPSCs. A) STRING analysis of the top 50 ranked genes reveals a highly connected network of surface receptors and immunomodulatory genes predicted to strongly encourage iPSCs to commit to the Treg differentiation. The encoded proteins are associated with many pathways including immunomodulation (red), growth and differentiation (green), ECM composition (orange), cell structure (yellow), signal transduction (dark blue), transcription factors (light blue), and metabolism (teal). B) All gene targets identified by CRISPR-GEM are highly upregulated in Treg cells, most were more confidently upregulated than FOXP3, the genetic signature specific to Treg cells. Expression of SOX2, a pluripotency factor, is also given as a reference for iPSC function. Data given as mean ± standard deviation n = 38, Tregs; n = 56, iPSC. **** denotes significance (padj < 0.0001) provided by DeSeq2 analysis.
Figure 5
Figure 5
Group selection and model training for MSC chondrogenic characterization. MSCs, fetal cartilage, and mature cartilage were selected for experimental, intermediate, and target groups respectively. A) UMAP analysis confirms the clustering of cartilage cells and MSCs with fetal and mature cartilage subpopulations, B) The neural network was then trained with mean squared error (MSE) as the loss function, C) the resulting model was able to predict over 95% of the variance in the expression of chondrogenic genes as demonstrated by r2, and D) The model resulted in a clear linear trend between actual and predicted expression values for each gene.
Figure 6
Figure 6
CRISPR-GEM results for CRISPRa induced chondrogenesis. A) STRING coexpression matrix for top scoring genes demonstrating the importance of ECM catabolism and immune regulation in the chondrogenic process. The encoded proteins are associated with many pathways including immunomodulation (red), growth and differentiation (green), ECM composition (orange), cell structure (yellow), signal transduction (dark blue), transcription factors (light blue), and metabolism (teal). B) All top scoring genes are significantly upregulated during the chondrogenic process. THY1 and NT5E, two MSC surface receptors, demonstrate the shift from progenitor cells to chondrocytes. Data given as mean ± standard deviation n = 27, MSC; n = 8, Fetal Cartilage; n = 4, Fetal Cartilage. * denotes significance (padj < 0.05), ** (padj < 0.01), ***(padj < 0.001), **** (padj < 0.0001) provided by DeSeq2 analysis. n.s. denotes no significance.
Figure 7
Figure 7
Group selection and model training for the reversal of OA using CRISPRi. Osteoarthritic and healthy cartilage tissues were selected as the experimental and target groups, respectively. A) UMAP clustering confirms the substantial variance between diseased and healthy cartilage, B) Neural network training resulted in a mean squared error (MSE) of 0.088 ± 0.0021 while predicting output gene expression, C) prompting an r2 of 0.943 ± 0.001. D) The model resulted in a clear linear trend between actual and predicted expression values for each gene.
Figure 8
Figure 8
Visualizing the results for the top ranking CRISPRi targets to prevent OA. A) STRING coexpression matrix for top scoring genes shows a large network containing proteins involved in fibrosis, ECM catabolism, and immune regulation implicating these processes in OA. The encoded proteins are associated with many pathways including immunomodulation (red), growth and differentiation (green), ECM composition (orange), cell structure (yellow), signal transduction (dark blue), transcription factors (light blue), and metabolism (teal). B) The top ten scoring genes given by CRISPR-GEM are all upregulated during OA progression. These results positively correlated with MMP13 expression, a key OA marker; but they negatively correlated to the pro-regenerative, anti-inflammatory SOX9. Data given as mean ± standard deviation n = 6. * denotes significance (padj < 0.05), ** (padj < 0.01), ***(padj < 0.001), **** (padj < 0.0001) provided by DeSeq2 analysis.

Update of

Similar articles

References

    1. Jinek M.; Chylinski K.; Fonfara I.; Hauer M.; Doudna J. A.; Charpentier E. A Programmable Dual-RNA–Guided DNA Endonuclease in Adaptive Bacterial Immunity. Science 2012, 337 (6096), 816–821. 10.1126/science.1225829. - DOI - PMC - PubMed
    1. Graham J.; Werba L.; Federico I.; Gonzalez-Fernandez T. CRISPR Strategies for Stem Cell Engineering: A New Frontier in Musculoskeletal Regeneration. Eur. Cell. Mater. 2023, 46, 91–118. 10.22203/eCM.v046a05. - DOI
    1. Farhang N.; Davis B.; Weston J.; Ginley-Hidinger M.; Gertz J.; Bowles R. D. Synergistic CRISPRa-Regulated Chondrogenic Extracellular Matrix Deposition Without Exogenous Growth Factors. Tissue Eng. Part A 2020, 26 (21–22), 1169–1179. 10.1089/ten.tea.2020.0062. - DOI - PMC - PubMed
    1. Yoshikawa T.; Wu Z.; Inoue S.; Kasuya H.; Matsushita H.; Takahashi Y.; Kuroda H.; Hosoda W.; Suzuki S.; Kagoya Y. Genetic Ablation of PRDM1 in Antitumor T Cells Enhances Therapeutic Efficacy of Adoptive Immunotherapy. Blood 2022, 139 (14), 2156–2172. 10.1182/blood.2021012714. - DOI - PubMed
    1. Langfelder P.; Horvath S. WGCNA: An R Package for Weighted Correlation Network Analysis. BMC Bioinformatics 2008, 9 (1), 559.10.1186/1471-2105-9-559. - DOI - PMC - PubMed

Publication types

MeSH terms