. 2024 Dec;115(12):3928-3942.
doi: 10.1111/cas.16339. Epub 2024 Oct 7.

Genomic and transcriptomic profiling of pre- and postneoadjuvant chemotherapy triple negative breast cancer tumors

Affiliations

Genomic and transcriptomic profiling of pre- and postneoadjuvant chemotherapy triple negative breast cancer tumors

Tomomi Nishimura et al. Cancer Sci. 2024 Dec.

Abstract

Our understanding of neoadjuvant treatment with microtubule inhibitors (MTIs) for triple negative breast cancer (TNBC) remains limited. To advance our understanding of the role of breast cancer driver genes' mutational status with pathological complete response (pCR; ypT0/isypN0) prediction and to identify distinct gene sets for MTIs like eribulin and paclitaxel, we carried out targeted genomic (n = 50) and whole transcriptomic profiling (n = 64) of TNBC tumor samples from the Japan Breast Cancer Research Group 22 (JBCRG-22) clinical trial. Lower PIK3CA, PTEN, and HRAS mutations were found in homologous recombination deficiency (HRD)-high (HRD score ≥ 42) tumors with higher pCR rates. When HRD-high tumors were stratified by tumor BRCA mutation status, the pCR rates in BRCA2-mutated tumors were higher (83% vs. 36%). Transcriptomic profiling of TP53-positive tumors identified downregulation of FGFR2 (false discovery rate p value = 2.07e-7), which was also the only common gene between HRD-high and -low tumors with pCR/quasi-pCR treated with paclitaxel and eribulin combined with carboplatin, respectively. Differential enrichment analysis of the HRD-high group posttreatment tumors revealed significant correlation (p = 0.006) of the glycan degradation pathway. FGFR2 expression and the differentially enriched pathways play a role in the response and resistance to MTIs containing carboplatin treatment in TNBC patients.

Keywords: FGFR2; HRD; eribulin; microtubule inhibitor; triple negative breast cancer.


Conflict of interest statement

SO, SOg, and MT are editorial board members of Cancer Science. Annual profit from shares is received by SOg from Asahi Genomics Co., Ltd. Total annual value of lecture fees, honoraria, or other fees paid by a single company or for‐profit organization for the time or labor of a researcher engaged for conference attendance is received by: NM from Chugai, Pfizer, Astra Zeneca (AZ), Eli Lilly (EL), Daiichi Sankyo (DS), and Eisai; KoK from Eisai, Chugai, and Takeda; MTa from Yakult, DS, AZ, Kyoto Breast Cancer Research Network (KBCRN), and JBCRG; YK from Eisai, Novartis, Pfizer, EL, Taiho, and Chugai; HB from Chugai and Eisai; RN from EL, AZ, DS, Chugai, Eisai, and Novartis; YY from AZ, Chugai, and MSD; TU from Chugai, Eisai, AZ, and Novartis; SM from AZ, Bristol‐Myers Squibb (BMS), Chugai, Eisai, EL, MSD, Pfizer, Taiho, and Novartis; SO from MSD, Lilly, Nippon Kayaku (NK), and Chugai; and MT from BERTIS, Inc., Kansai‐Med net, EL (KMN), Pfizer, DS, Terumo, Pfizer, and AZ. Total annual value of research funds (joint research funds, contract research funds, clinical trial funds, etc.) is received by: NM from Chugai, EL, AZ, Pfizer, DS, MSD, Eisai, Novartis, Sanofi, and Kyowa‐Kirin (KyK); NK from Ono‐Pharma; KK from TERUMO, Astellas, EL, and KBCRN; MTa from Yakult, DS, AZ, KBCRN, and JBCRG; YY from Chugai and KyK; TU from Lilly; HI from Nipro, Eisai, DS, Chugai, Takeda, and AZ; SM from Eisai; SO from Eisai and Taiho; and MT from TERUMO, Astellas, EL, KBCRN, JBCRG, Yakult, Zene, KMN, Shimazu, AFI, Taiho, and Sanwa‐Syurui. Total annual value of scholarship (incentive) endowments provided directly from a single company or for‐profit organization, or research grants provided directly from a private academic support organization is received by MT from Eisai, Chugai, KyK, and NK. SOg declares an endowed chair etc. funded by a company or for‐profit organization, or has accepted a researcher, etc. from a company or for‐profit organization where the declarer is a research facility representative from Chordia Therapeutics Inc., Nanpuh Hospital. The other authors declare no conflicts of interest.

Figures

FIGURE 1
FIGURE 1
Landscape of the mutations detected in triple negative breast cancer tumors by targeted sequencing. The distribution and types of recurrent gene mutations in the tumors are shown. C4, biopsy samples after four cycles of chemotherapy; CR, complete response; HRD, homologous recombination deficiency; NA, not analyzed; ope, surgical samples after chemotherapy; pCR, pathological complete response (ypT0/is+ypN0); PD, progressive disease; PR, partial response; pre, biopsy samples before chemotherapy; SD, stable disease; SNV, single nucleotide variant.
FIGURE 2
FIGURE 2
Correlations between tumor mutation profile, homologous recombination deficiency (HRD) score, and comprehensive pathological complete response (pCR), indicated by ypT0/is+ypN0, in triple negative breast cancer. (A) Mutation rate of recurrently mutated genes in HRD‐positive (score ≥42) cases (groups A1 [n = 8] and A2 [n = 13]) and HRD‐negative (score <42) cases (groups B1 [n = 10] and B2 [n = 8]), in which both the Myriad HRD test and targeted sequencing were successfully carried out. (B) pCR rates in cases with mutations in each recurrently mutated gene. The case number corresponding to each bar has been added to the bar chart, with q values (q) from two‐sided Fisher's exact test with Benjamini–Hochberg adjustment. *Significant difference (q < 0.1).
FIGURE 3
FIGURE 3
Correlations between the homologous recombination deficiency (HRD) score, comprehensive pathological complete response (pCR), and tumor BRCA mutation (tBRCA1/2m) status in triple negative breast cancer. The correlation between pCR and tBRCA1/2m status was analyzed in 74/78 (94.9%) Myriad‐tested cases in which the HRD score was successfully determined. (A) Correlation between tBRCAm status and HRD score.(B) Correlation between the HRD score and comprehensive pCR as ypT0/is + ypN0.
FIGURE 4
FIGURE 4
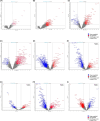
Differential expression analysis of genes in triple negative breast cancer tumors with different characteristics, depicted as volcano plots. (A) BRCA1/2‐mutated (pos) versus ‐negative (neg) tumors in groups A and B. (B) Tumor size <30.5 versus ≥30.5 mm (n = 24 vs. 25) in groups A and B. (C) TP53‐mutated versus ‐negative (n = 22 vs. 34) tumors in groups A and B. (D) PIK3CA‐mutated versus ‐negative (n = 7 vs. 42) tumors in groups A and B. (E) Homologous recombination deficiency (HRD)‐high versus HRD‐low (n = 27 vs. 9) tumors in groups A and B. (F) Pre‐ and posttreatment (n = 11 vs. 10) tumors from patients in group A without a pathological complete response (NpCR), (G) pre‐ and posttreatment tumors (n = 3 vs. 3) from patients in group A1 classified as NpCR. (H) Pre‐ and posttreatment (n = 8 vs. 7) tumors from patients in group A2 classified as NpCR. (I) Pretreatment tumors from patients in group A who achieved a pathological complete response (pCR) (1) and those that did not (0) (n = 16 vs. 11).
FIGURE 5
FIGURE 5
Gene Set Enrichment Analysis (GSEA) Constellation Map Kyoto Encyclopedia of Genes and Genomes (KEGG) pathway enrichment heatmap of group A triple negative breast cancer tumors. (A) GSEA Constellation Map enrichment heatmap of A1 and A2 posttreatment tumors with area under the curve (AUC), AUC p value (AUC.pval), t‐statistic (t‐stat), and t‐statistic p value (t.pval) between A1 and A2 posttreatment tumors. Heatmap of differentially enriched KEGG pathway gene sets between A1 (n = 5) and A2 (n = 8) posttreatment tumors identified glycan degradation as a significantly enriched gene set with AUC.pval of 0.009 and t.pval of 0.006. (B) GSEA Constellation Map enrichment heatmap of group A pre‐ and posttreatment tumors with AUC, AUC.pval, t‐stat, and t.pval between the A pre‐and posttreatment tumors. Heatmap of differentially enriched KEGG pathway gene sets between A pretreatment (n = 11) and A posttreatment (n = 10) tumors identified the top 10 oncogenic signature gene sets with a significant AUC.pval and t‐pval.
FIGURE 6
FIGURE 6
Hierarchical and radial FGFR2 networks in group A and B triple negative breast cancer tumors. (A) Hierarchical FGFR2 network in group A pretreatment tumors from patients who achieved a pathological complete response (pCR), showing FGFR2 as a regulatory protein upstream of DLK1, ERK1/2, CSN2, LALBA, and other proteins. (B) Causal network of NRG2 in group A pretreatment tumors from patients who achieved a pathological complete response. (C) Radial FGFR2 networks consisting of FGFR2 and its interacting partners in group A pretreatment tumors from patients who achieved a pCR. (D) Radial network consisting of FGFR2 and its interacting partners in group B pretreatment tumors from patients who achieved pCR.

References

    1. Tutt A, Tovey H, Cheang MCU, et al. Carboplatin in BRCA1/2‐mutated and triple‐negative breast cancer BRCAness subgroups: the TNT trial. Nat Med. 2018;5:628‐637. doi:10.1038/s41591-018-0009-7 - DOI - PMC - PubMed
    1. Zhao EY, Shen Y, Pleasance E, et al. Homologous recombination deficiency and platinum‐based therapy outcomes in advanced breast cancer. Clin Cancer Res. 2017;23(24):7521‐7530. doi:10.1158/1078-0432.CCR-17-1941 - DOI - PubMed
    1. Lehmann BD, Bauer JA, Chen X, et al. Identification of human triple‐negative breast cancer subtypes and preclinical models for selection of targeted therapies. J Clin Invest. 2011;121(7):2750‐2767. doi:10.1172/JCI45014 - DOI - PMC - PubMed
    1. Craig DW, O'Shaughnessy JA, Kiefer JA, et al. Genome and transcriptome sequencing in prospective metastatic triple‐negative breast cancer uncovers therapeutic vulnerabilities. Mol Cancer Ther. 2013;12(1):104‐116. doi:10.1158/1535-7163.MCT-12-0781 - DOI - PubMed
    1. Jiang YZ, Ma D, Suo C, et al. Genomic and transcriptomic landscape of triple‐negative breast cancers: subtypes and treatment strategies. Cancer Cell. 2019;35(3):428‐440.e5. doi:10.1016/j.ccell.2019.02.001 - DOI - PubMed

MeSH terms

Grants and funding