. 2024 Sep 23:15:1448041.
doi: 10.3389/fimmu.2024.1448041. eCollection 2024.

Increased peritoneal TGF-β1 is associated with ascites-induced NK-cell dysfunction and reduced survival in high-grade epithelial ovarian cancer

Affiliations

Increased peritoneal TGF-β1 is associated with ascites-induced NK-cell dysfunction and reduced survival in high-grade epithelial ovarian cancer

Ralph J A Maas et al. Front Immunol. .

Abstract

Natural killer (NK) cell therapy represents an attractive immunotherapy approach against recurrent epithelial ovarian cancer (EOC), as EOC is sensitive to NK cell-mediated cytotoxicity. However, NK cell antitumor activity is dampened by suppressive factors in EOC patient ascites. Here, we integrated functional assays, soluble factor analysis, high-dimensional flow cytometry cellular component data and clinical parameters of advanced EOC patients to study the mechanisms of ascites-induced inhibition of NK cells. Using a suppression assay, we found that ascites from EOC patients strongly inhibits peripheral blood-derived NK cells and CD34+ progenitor-derived NK cells, albeit the latter were more resistant. Interestingly, we found that higher ascites-induced NK cell inhibition correlated with reduced progression-free and overall survival in EOC patients. Furthermore, we identified transforming growth factor (TGF)-β1 to correlate with ascites-induced NK cell dysfunction and reduced patient survival. In functional assays, we showed that proliferation and anti-tumor reactivity of CD34+ progenitor-derived NK cells are significantly affected by TGF-β1 exposure. Moreover, inhibition of TGF-β1 signaling with galunisertib partly restored NK cell functionality in some donors. For the cellular components, we showed that the secretome is associated with a different composition of CD45+ cells between ascites of EOC and benign reference samples with higher proportions of macrophages in the EOC patient samples. Furthermore, we revealed that higher TGF-β1 levels are associated with the presence of M2-like macrophages, B cell populations and T-regulatory cells in EOC patient ascites. These findings reveal that targeting TGF-β1 signaling could increase NK cell immune responses in high-grade EOC patients.

Keywords: TGF-β; ascites; natural killer (NK) cells; ovarian cancer; tumor microenvironment.


Conflict of interest statement

The authors declare that the research was conducted in the absence of any commercial or financial relationships that could be construed as a potential conflict of interest. The author(s) declared that they were an editorial board member of Frontiers, at the time of submission. This had no impact on the peer review process and the final decision.

Figures
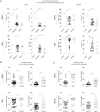
Figure 1
Figure 1
Ascites from EOC patients inhibits NK cell activity. (A) Percent positive CD107a and IFN-γ PB-derived (left) and HPC-derived (right) NK cells stimulated with SKOV-3 (top) or K562 (bottom) target cells in the presence of PBS (open triangles), EOC patient ascites (filled circles, n=31) or benign fluid (open squares, n=15). Cells were incubated overnight with aforementioned fluids with addition of 1nM rhIL-15 and challenged with target cells for 4 hours. For control quadruplicates are shown, and for EOC patient and benign control fluids the average of duplicates are depicted and were used for statistics. Kruskal-Wallis with Dunn’s Multiple Comparison Test was used for statistical analysis, * p < 0.05, ** p < 0.01 and *** p < 0.001. (B) and (C) Fold change CD107a and IFN-γ inhibition of the same assay compared to control of EOC patient ascites (n=31) with for (B) HPC-derived (open circles) and PB-derived (filled squares) NK cells stimulated with SKOV-3 (top) and K562 (bottom) or for (C) stimulated with SKOV-3 (filled triangles) and K562 (open diamonds) on PB-NK (top) or HPC-NK cells (bottom). Wilcoxon signed-rank test was used for statistical analysis, *** p < 0.001 (C).
Figure 2
Figure 2
Inhibitory properties of ascites on NK cells correlates to patient survival and CA-125 levels. (A, B) Spearman correlograms of mean fold change of suppression by EOC patient ascites between all tested conditions, i.e. HPC-NK vs PB-NK, SKOV-3 vs K562 and CD107a vs IFN-γ (A), or those conditions versus OS, PFS, CA-125 (serum and ascites) (B); with color intensity and circle size indicating the Spearman’s rank correlation coefficient between biomarkers, and * denoting p < 0.05. (C) Scatter plots illustrating the relationship between PFS and OS in months versus PB-NK CD107a (top) or IFN-γ (right) response to SKOV-3 (left) and K562 (right). Spearman’s rank correlation coefficient (ρ) shown, * p < 0.05 (D) Scatter plots illustrating the relationship between CD107a (left) or IFN-γ (right) and CA-125 serum levels in PB-NK (top) and HPC-NK cells (bottom).
Figure 3
Figure 3
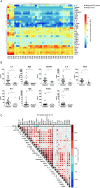
TGF-β1 as a discrete suppressive cytokine in EOC patient ascites. (A) Log scaled soluble cytokine levels by Luminex or ELISA on of EOC patient (n=31) and benign control (n=8) peritoneal fluids visualized in a heatmap. Each row represents a different cytokine, while columns represent patients or donors (M=malignant and B=benign). The log scaled cytokine level of patients or donors is reported and visualized with a color scale from blue (low levels) to red (high levels). (B) Cytokine levels of significantly different cytokines in the panel of EOC patient and benign control ascites fluids. A Mann-Whitney test was used for statistical analysis, * p < 0.05 and ** p < 0.01. (C) Spearman correlogram of mean fold change of suppression by EOC patient ascites in all tested condition and clinical parameters versus cytokine levels. A heat map is used to indicate the Spearman’s rank correlation coefficient (ρ) of associations between biomarkers. Red indicates a positive correlation, and blue indicates a negative correlation. * p < 0.05.
Figure 4
Figure 4
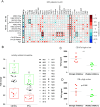
TGF-β1 is a main driver of ascites-induced NK cell inhibition. (A) Spearman correlogram of mean fold change of suppression by EOC patient ascites, PFS, OS, CA-125 levels in serum and peritoneal fluids and age versus soluble cytokine levels. A heat map is used to indicate the ρ2 of associations between biomarkers. Red indicates a positive correlation, and blue indicates a negative correlation. (B) Mean fold change CD107a and IFN-γ inhibition of all conditions for each EOC patient ascites. All red labelled patients indicate the 25% strongest inhibitory ascites’, and all green labelled patients indicate the 25% least inhibitory ascites’. (C, D) TGF-β1 levels of most and least inhibitory ascites’ defined in (B) based on CD107a (C) and IFN-γ (D). A Mann-Whitney test was used for statistical analysis, * p < 0.05, *** p < 0.001.
Figure 5
Figure 5
TGF-β1 inhibits NK cell functionality that can be partially rescued by a TGF-β1 small molecule inhibitor. (A) TGF-βR2 expression (black) and isotype control (light grey) unstimulated HPC-NK cells in histograms (left) and the percentage of TGF-βR2+ HPC-NK cells shown for 5 different donors (right). (B) Cell Proliferation Dye-stained HPC-NK cells in a proliferation assay measured by a decrease in eFluor450 fluorescence. The left panel shows triplicate unstimulated, IL-2+IL-15 stimulated (with or without DMSO or galunisertib) controls with eFluor450 MFI on y-axis. The right panels shows reference triplicates of HPC-NK cells stimulated with IL-2+IL-15 control with or without decreasing amounts (50, 5 or 0.5ng/mL) of rhTGF-β1 with or without galunisertib. Both panels include data from the same experiment. The Friedman test was used to calculate statistical significance. (C) Percentage of HPC-NK cells that are double positive for CD107a and IFN-γ after stimulation with K562 or SKOV-3 cells in the presence or absence of TGF-β1(n=5). One-way ANOVA with post-hoc Bonferroni test was used for statistical analysis. ns, not significant, *p<0.05, **p<0.01, ***p<0.001.
Figure 6
Figure 6
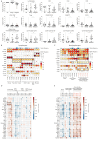
M2 like macrophages, Tregs and B cells are associated to the secretome including TGF-β1 in EOC patient ascites. (A) Frequency of cell populations within CD45+ cells in PBMCs (as circulating reference, PB), benign peritoneal fluids and malignant ascites based on manual gating, Kruskal-Wallis with Dunn’s Multiple Comparison Test was used for statistical analysis, ** p < 0.01, *** p < 0.001. (B, C) Scaled MFI values of FlowSOM clusters for the lymphocyte (B) and non-lymphocyte (C) fraction of malignant ascites in a balloon plot. Each row represents a marker, while columns represent a cluster. Balloon size represents frequency while balloon color represents MFI (red is high MFI, yellow is low MFI). On top of the balloon plot the cluster size is presented as percent of total where red indicate large clusters and green small clusters. All clusters smaller than 1% of the total cell population were excluded to prevent overfitting of rare populations. (D, E) Spearman correlogram of cytokine levels versus clusters of the lymphocyte (D) and non-lymphocyte (E) fraction of EOC patient ascites. A heat map is used to indicate the Spearman’s rank correlation coefficient (ρ) of associations between biomarkers. Red indicates a positive correlation, and blue indicates a negative correlation. All clusters smaller than 1% of the total cell population were excluded to prevent overfitting of rare populations. ns, not significant, * p < 0.05, L, lymphocyte and NL, non-lymphocyte.
Figure 7
Figure 7
Frequencies of FlowSOM clustering for each individual cluster. (A, B) Box and whiskers plots showing the percentage of FlowSOM clusters, based on the lymphocyte fraction (A) and non-lymphocyte fraction (B), showing different cell cluster distribution in healthy donors (grey, n=14), benign patients (blue, n=12) and patients with malignancy (red, n=27). All clusters smaller than 1% of the total cell population were excluded to prevent overfitting of rare populations. Kruskal-Wallis with Dunn’s Multiple Comparison Test was used for statistical analysis * p < 0.05, * p < 0.05, ** p < 0.01 and *** p < 0.001.

References

    1. Siegel RL, Giaquinto AN, Jemal A. Cancer statistics, 2024. CA: A Cancer J Clin. (2024) 74(1):12–49. doi: 10.3322/caac.21820 - DOI - PubMed
    1. Ahmed N, Stenvers KL. Getting to know ovarian cancer ascites: opportunities for targeted therapy-based translational research. Front Oncol. (2013) 3:256. doi: 10.3389/fonc.2013.00256 - DOI - PMC - PubMed
    1. Lane D, Goncharenko-Khaider N, Rancourt C, Piché A. Ovarian cancer ascites protects from TRAIL-induced cell death through alphavbeta5 integrin-mediated focal adhesion kinase and Akt activation. Oncogene. (2010) 29(24):3519–31. doi: 10.1038/onc.2010.107 - DOI - PubMed
    1. Puiffe ML, Le Page C, Filali-Mouhim A, Zietarska M, Ouellet V, Tonin PN, et al. . Characterization of ovarian cancer ascites on cell invasion, proliferation, spheroid formation, and gene expression in an in vitro model of epithelial ovarian cancer. Neoplasia. (2007) 9(10):820–9. doi: 10.1593/neo.07472 - DOI - PMC - PubMed
    1. Rickard BP, Conrad C, Sorrin AJ, Ruhi MK, Reader JC, Huang SA, et al. . Malignant ascites in ovarian cancer: cellular, acellular, and biophysical determinants of molecular characteristics and therapy response. Cancers (Basel). (2021) 13(17):4318. doi: 10.3390/cancers13174318 - DOI - PMC - PubMed