. 2024 Sep 20:15:1422206.
doi: 10.3389/fimmu.2024.1422206. eCollection 2024.

Exploring the impact of tertiary lymphoid structures maturity in NSCLC: insights from TLS scoring

Affiliations

Exploring the impact of tertiary lymphoid structures maturity in NSCLC: insights from TLS scoring

Julie Berthe et al. Front Immunol. .

Abstract

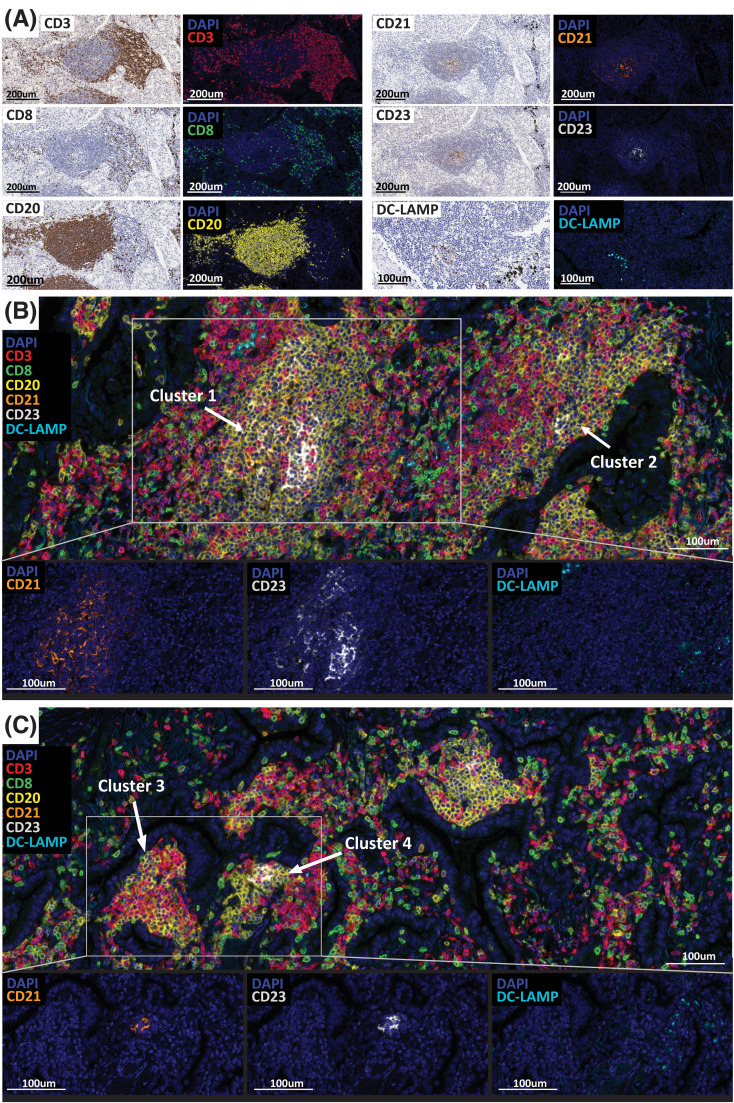
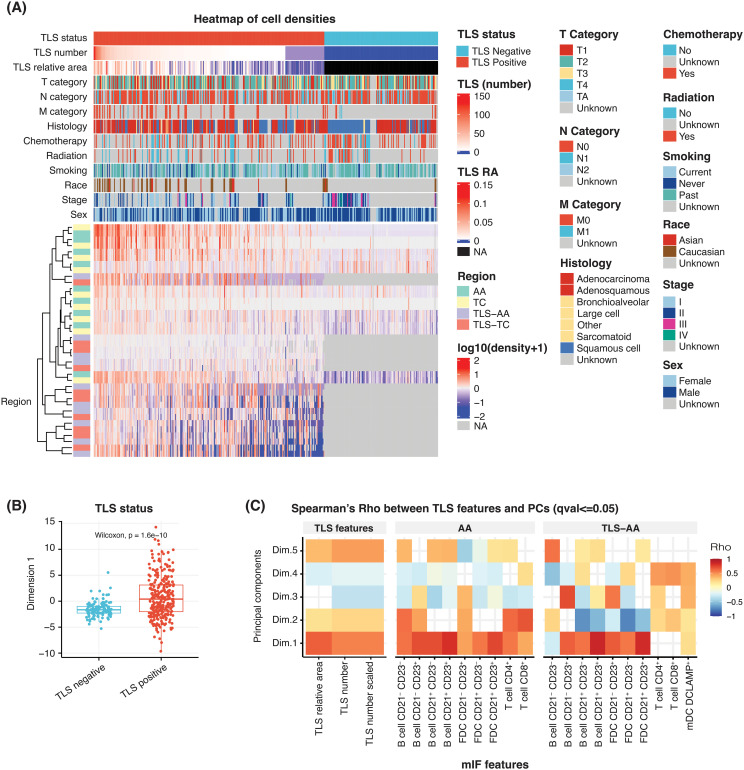
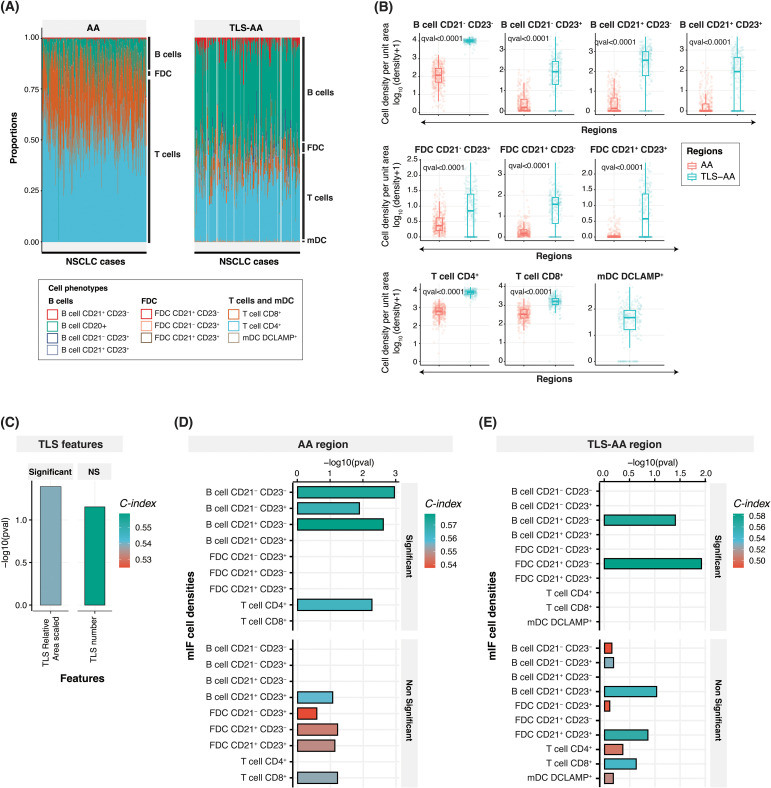
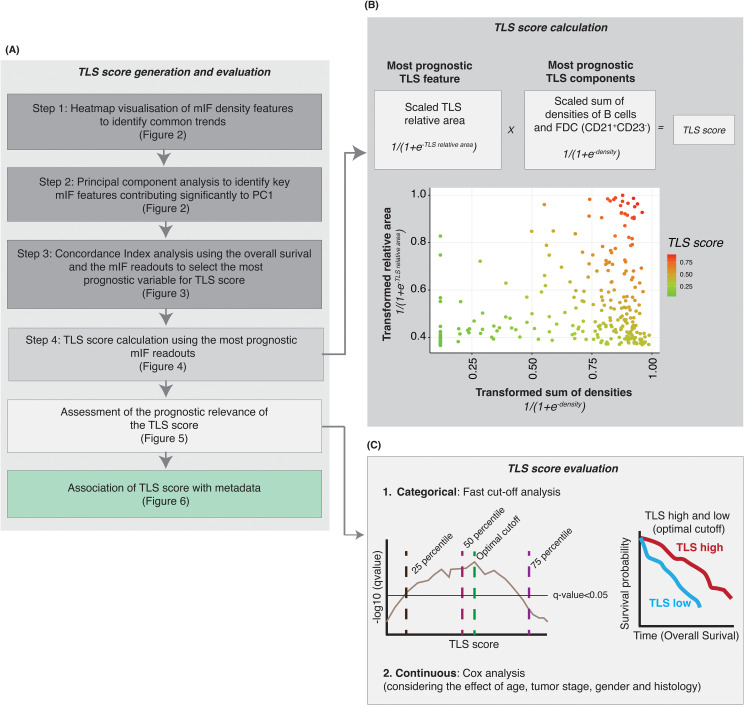
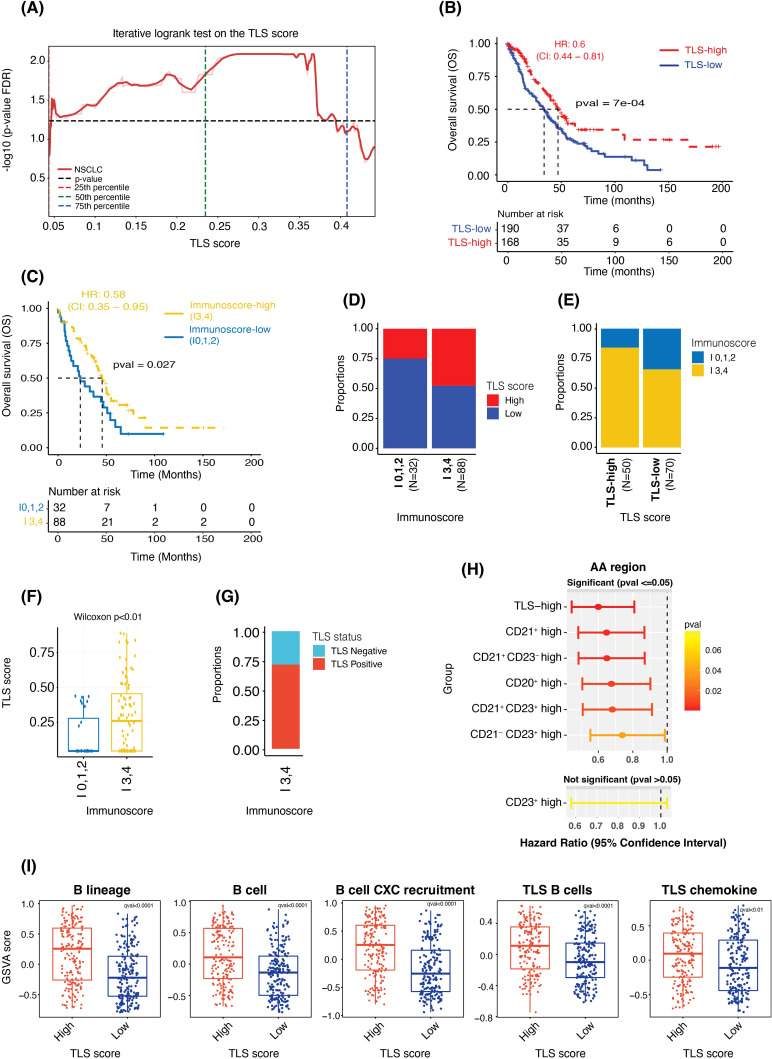
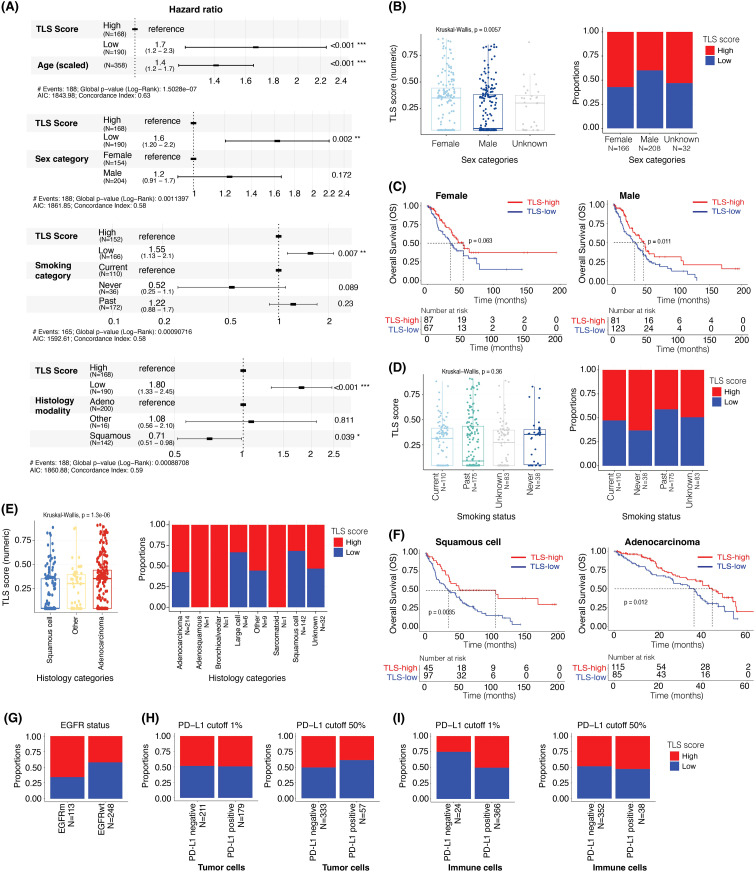
Tertiary Lymphoid Structures (TLS) are lymphoid structures commonly associated with improved survival of cancer patients and response to immunotherapies. However, conflicting reports underscore the need to consider TLS heterogeneity and multiple features such as TLS size, composition, and maturation status, when assessing their functional impact. With the aim of gaining insights into TLS biology and evaluating the prognostic impact of TLS maturity in Non-Small Cell Lung Carcinoma (NSCLC), we developed a multiplex immunofluorescent (mIF) panel including T cell (CD3, CD8), B cell (CD20), Follicular Dendritic cell (FDC) (CD21, CD23) and mature dendritic cell (DC-LAMP) markers. We deployed this panel across a cohort of primary tumor resections from NSCLC patients (N=406) and established a mIF image analysis workstream to specifically detect TLS structures and evaluate the density of each cell phenotype. We assessed the prognostic significance of TLS size, number, and composition, to develop a TLS scoring system representative of TLS biology within a tumor. TLS relative area, (total TLS area divided by the total tumor area), was the most prognostic TLS feature (C-index: 0.54, p = 0.04). CD21 positivity was a marker driving the favorable prognostic impact, where CD21+ CD23- B cells (C-index: 0.57, p = 0.04) and CD21+ CD23- FDC (C-index: 0.58, p = 0.01) were the only prognostic cell phenotypes in TLS. Combining the three most robust prognostic TLS features: TLS relative area, the density of B cells, and FDC CD21+ CD23- we generated a TLS scoring system that demonstrated strong prognostic value in NSCLC when considering the effect of age, sex, histology, and smoking status. This TLS Score also demonstrated significant association with Immunoscore, EGFR mutational status and gene expression-based B-cell and TLS signature scores. It was not correlated with PD-L1 status in tumor cells or immune cells. In conclusion, we generated a prognostic TLS Score representative of the TLS heterogeneity and maturity undergoing within NSCLC tissues. This score could be used as a tool to explore how TLS presence and maturity impact the organization of the tumor microenvironment and support the discovery of spatial biomarker surrogates of TLS maturity, that could be used in the clinic.

Keywords: NSCLC; multiplex immunofluorescence; tertiary lymphoid structures; tissue scoring; tumor immunity.


Conflict of interest statement

Authors JB, HA, PP, EJ, SW, JB, MSa, FN and MSu were employed by the company AstraZeneca and are shareholders. Authors FS, EJ, MV, TG, AA, HH and MH-B were employed by the company AstraZeneca. Author JG was employed by the company Veracyte. The remaining author declares that the research was conducted in the absence of any commercial or financial relationships that could be construed as a potential conflict of interest. The authors declare that this study received funding from AstraZeneca. Additionally, Author TG received research funding from Idera Pharmaceuticals, consulting fees from Mendus, LAVA Therapeutics and GE Health, and is shareholder of LAVA Therapeutics. Author RV received research funding from Genmab BV. However, none of these funders, except AstraZeneca, were involved in the study design, data collection and analysis, decision to publish, or preparation of the manuscript. The author(s) declared that they were an editorial board member of Frontiers, at the time of submission. This had no impact on the peer review process and the final decision.

Figures

Figure 1
Figure 1
TLS detection and maturity assessment in 406 NSCLC cases. (A) Multiplex immunofluorescence assay validation (CD3, CD8, CD20, CD21, CD23, DC-LAMP) by comparing the IF to the chromogenic IHC staining performed on serial tissue sections. CD3 (T cells, red), CD8 (CTL T cells, green), CD20 (B cells, yellow), CD21 (FDC, orange), CD23 (GC B cells, white), DC-LAMP (mDC, cyan). (B, C) Representative images of large (B) and small (C) TLS/B-cell clusters positive for the maturation markers CD21, CD23 and DC-LAMP detected in NSCLC cases. Slides were imaged using the PhenoImager HT automated imaging system. Scale bars are indicated.
Figure 2
Figure 2
Heatmap of multiplex IF features to identify the key cell phenotypes associated with TLS structures. (A) Heatmap showing the scaled (following the log10 transformation) density of 10 cell phenotypes and their association with sex, stage, race, smoking status, therapy (radiation and chemotherapy), histology, TNM categories, TLS relative area (RA), TLS number and TLS status. Individual patients are represented in each column. Each row represents the cell density of a specific cell phenotype located within the indicated tissue region. For cases TLS negative, TLS RA and cell densities are treated as missing value NA. (B) A box plot comparing the first principal component scores according to the TLS status of the NSCLC cases. (C) A heatmap showing the correlation between multiple multiplex IF features, namely: TLS relative area, TLS number (unscaled), TLS number (scaled), densities of 10 cell phenotypes in ‘AA’ and ‘TLS-AA’ (x-axis), with the first principal component (y-axis).
Figure 3
Figure 3
Cell densities within the tumor and TLS-specific area, and prognostic relevance. (A) Bar plot showing the relative proportion of ten cell phenotypes captured using the multiplex IF panel in the tumor ‘AA’ (left panel) and TLS-specific area ‘TLS-AA’ (right panel) regions. The proportion has been calculated by dividing the specific cell type density by the total cell density. (B) Box plots comparing the densities (number of cells per unit area) of these ten cell phenotypes between the ‘AA’ and ‘TLS-AA’ regions. The q-value in the plot refers to the FDR adjusted p-value from Wilcoxon rank sum test. (C–E) Bar plots showing concordance index (C-index), and -log10(p-values) for TLS relative area (scaled) and TLS number (C) and cell phenotypes within the tumor area ‘AA’ (D) or within TLS specific areas ‘TLS-AA’ (E). NS, Non-significant.
Figure 4
Figure 4
Generation of a TLS score after identifying the most consistently prognostic TLS mIF features. (A) Steps performed to identify the key multiplex IF cell phenotypes and TLS features to generate a TLS score with prognostic value. (B) Based on the results from heatmap, principal component analysis and survival analysis we selected the most prognostic (i) TLS feature (relative area of the TLS) and (ii) TLS components (densities of B cells and follicular dendritic cells CD21+ CD23-) to generate a TLS score. The TLS relative area was scaled, and the logistic function was applied. For the CD21+ CD23- cells (B cells and FDC), cell densities were scaled and summed followed by transformation of data using the logistic function. The TLS score is the product of (i) and (ii). (C) A log-rank test was performed to assess the prognostic relevance of TLS score, at multiple cut-off points, and the optimal cut-off was selected to categorize the NSCLC samples into TLS-high and -low groups. The optimal cut-off was selected based on two criteria – minimizing the FDR-adjusted p-value and balancing the number of samples in the TLS-high and TLS-low categories. Kaplan-Meier survival analysis was performed to assess the survival difference between the TLS-high and TLS-low samples, using the optimal cut-off-based TLS stratification.
Figure 5
Figure 5
TLS score is prognostic independent of the cutoff used to categorize the data and shows significant association with Immunoscore and gene expression-based signature scores. (A) Plot showing FDR-adjusted p-values (from the log-rank test) observed at multiple cut-off points between the TLS-high and TLS-low samples. (B, C) Kaplan-Meier survival curves showing the difference in overall survival between the TLS-high and -low groups (B) and between the Immunoscore-high (I3,4) and Immunoscore-low (I0,1,2) groups (C). (D, E) Bar plots showing the proportions of TLS-high and TLS-low samples in the Immunoscore-high and -low groups (D) and the proportions of Immunoscore-high and -low samples in TLS-high and TLS-low groups (E). (F) Box plot comparing the TLS Score (as a continuous value) between Immunoscore-high and Immunoscore-low groups. (G) Bar plot showing the proportions of TLS-high and TLS-low samples in the Immunoscore-high group. (H) A plot showing hazard ratios, the 95% confidence interval of HR and the p-value from the Wald test of TLS-high (vs TLS-low, used as reference), CD21+ high (vs CD21+ low), CD21+ CD23- high (vs CD21+ CD23- low), CD20+ high (vs CD20+ low), CD21+ CD23+ high (vs CD21+ CD23+ low), CD21- CD23+ high (vs CD21- CD23+ low) and CD23+ high (vs CD23+ low) cases. (I) Box plots showing the difference in the gene expression-based enrichment scores of B cells and TLS signatures between the TLS-high and TLS-low groups.
Figure 6
Figure 6
TLS score is prognostic after adjusting for age, sex, smoking status, and is associated with EGFR mutational status but not PD-L1 positivity status. (A) The hazard ratios and 95% confidence interval of TLS scores adjusted for the effect of (i) age, (ii) sex, (iii) smoking status, and (iv) histology using multivariable Cox regression analysis and overall survival data. (B) Box plot showing the difference in TLS scores (as a continuous value) in male and female samples (left panel). Bar plot showing the proportions of TLS-high and -low samples in male and female (right panel). (C) Kaplan-Meier plots showing the difference in overall survival between TLS-high and TLS-low groups in female (left panel) and male (right panel). (D) Box plot comparing the TLS scores (as a continuous value) by smoking status (left panel). Bar plot showing the proportions of TLS-high and -low samples in current, never, and past smokers (right panel). (E) Box plot comparing the TLS score (as a continuous value) in different histological subtypes of NSCLC (left panel). Bar plot showing the proportions of TLS-high and -low in different histological subtypes of NSCLC samples (right panel). (F) Kaplan-Meier plots showing the difference in overall survival between the TLS-high and TLS-low groups in squamous cell carcinoma (left panel) and adenocarcinoma (right panel). (G) Bar plot showing the proportions of TLS-high and -low samples in EGFR mutant and wildtype samples. (H, I) Bar plots showing the proportions of TLS-high and TLS-low groups in PD-L1 staining positive and negative samples in tumor cells ‘TC’ (H) and immune cells ‘IC’ (I) at 1% (left panels) or 50% (right panels) PD-L1 positivity cut-offs.

References

    1. Galon J, Mlecnik B, Bindea G, Angell HK, Berger A, Lagorce C, et al. . Towards the introduction of the ‘Immunoscore’ in the classification of Malignant tumours. J Pathol. (2014) 232:199–209. doi: 10.1002/path.4287 - DOI - PMC - PubMed
    1. Bruni D, Angell HK, Galon J. The immune contexture and Immunoscore in cancer prognosis and therapeutic efficacy. Nat Rev Cancer. (2020) 20:662–80. doi: 10.1038/s41568-020-0285-7 - DOI - PubMed
    1. Bai R, Lv Z, Xu D, Cui J. Predictive biomarkers for cancer immunotherapy with immune checkpoint inhibitors. biomark Res. (2020) 8:34. doi: 10.1186/s40364-020-00209-0 - DOI - PMC - PubMed
    1. Cabrita R, Lauss M, Sanna A, Donia M, Skaarup Larsen M, Mitra S, et al. . Tertiary lymphoid structures improve immunotherapy and survival in melanoma. Nature. (2020) 577:561–5. doi: 10.1038/s41586-019-1914-8 - DOI - PubMed
    1. Vanhersecke L, Brunet M, Guegan JP, Rey C, Bougouin A, Cousin S, et al. . Mature tertiary lymphoid structures predict immune checkpoint inhibitor efficacy in solid tumors independently of PD-L1 expression. Nat Cancer. (2021) 2:794–802. doi: 10.1038/s43018-021-00232-6 - DOI - PMC - PubMed

MeSH terms

Substances