. 2024 Nov;11(44):e2406428.
doi: 10.1002/advs.202406428. Epub 2024 Oct 8.

USP26 Combats Age-Related Declines in Self-Renewal and Multipotent Differentiation of BMSC by Maintaining Mitochondrial Homeostasis

Affiliations

USP26 Combats Age-Related Declines in Self-Renewal and Multipotent Differentiation of BMSC by Maintaining Mitochondrial Homeostasis

Yiming Xu et al. Adv Sci (Weinh). 2024 Nov.

Abstract

Age-related declines in self-renewal and multipotency of bone marrow mesenchymal stem cells (BMSCs) limit their applications in tissue engineering and clinical therapy. Thus, understanding the mechanisms behind BMSC senescence is crucial for maintaining the rejuvenation and multipotent differentiation capabilities of BMSCs. This study reveals that impaired USP26 expression in BMSCs leads to mitochondrial dysfunction, ultimately resulting in aging and age-related declines in the self-renewal and multipotency of BMSCs. Specifically, decreased USP26 expression results in decreased protein levels of Sirtuin 2 due to its ubiquitination degradation, which leads to mitochondrial dysfunction in BMSCs and ultimately resulting in aging and age-related declines in self-renewal and multilineage differentiation potentials. Additionally, decreased USP26 expression in aging BMSCs is a result of dampened hypoxia-inducible factor 1α (HIF-1α) expression. HIF-1α facilitates USP26 transcriptional expression by increasing USP26 promoter activity through binding to the -191 - -198 bp and -262 - -269 bp regions on the USP26 promoter. Therefore, the identification of USP26 as being correlated with aging and age-related declines in self-renewal and multipotency of BMSCs, along with understanding its expression and action mechanisms, suggests that USP26 represents a novel therapeutic target for combating aging and age-related declines in the self-renewal and multipotent differentiation of BMSCs.

Keywords: BMSC; USP26; aging; mitochondrial homeostasis; multipotency; self‐renewal.


Conflict of interest statement

The authors declare no conflict of interest.

Figures
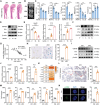
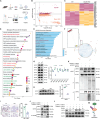
Figure 1
Figure 1
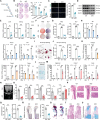
The decreased USP26 expression is correlated with aging of BMSCs. A) Representative H&E staining images of the femurs from 2‐month‐old, 15‐month‐old, and 20‐month‐old mice. n = 5 in each group. Scale bar, 500 µm. B) Representative Micro‐CT images of the femurs from 2‐month‐old, 15‐month‐old, and 20‐month‐old mice. n = 5 in each group. C) Quantitative analysis of the trabecular bone from 2‐month‐old, 15‐month‐old, and 20‐month‐old mice including BV/TV, Tb.N, Tb.Th, Tb.Sp, and BMD. n = 5 in each group. D) Western‐blot analysis of USP26, P21, and P16 protein levels in BMSCs from mice of different ages (2, 15, and 20 months). n = 3 in each group. E) qPCR analysis of Usp26, P16, and P21 mRNA expressions in BMSCs from mice of different ages (2, 15, and 20 months). n = 3 in each group. F) Western blot analysis of USP26, P21, and P16 protein levels in BMSCs of different generations (1, 5, 10, and 15). n = 3 in each group. G) qPCR analysis of Usp26 mRNA expressions from the bone marrow of different patients (n = 15) and evaluation of the relevance between Usp26 mRNA expression and age. H) Representative SA‐β‐Gal staining images and percentage of SA‐β‐Gal positive cells of BMSCs from control and cKO mice. n = 5 in each group. Scale bar, 10 µm. I) Western blot analysis of USP26, P21, and P16 protein levels of BMSCs from control and cKO mice. n = 3 in each group. J) qPCR analysis of Usp26, P16, and P21 mRNA expressions of BMSCs from control and cKO mice. n = 3 in each group. K) qPCR analysis of SASP‐related gene (Il‐1α, Il‐1β, Il‐6, Cxcl1, Cxcl10, Ccl2, and Ccl5) mRNA expressions of BMSCs from control and cKO mice. n = 3 in each group. L) Representative Immunohistochemistry (IHC) staining of IL‐6 of the femurs from control and cKO mice. IL‐6 positive cells number as a quantitative measurement. n = 6 in each group. Scale bar, 50 µm (black) and 10 µm (red). M) Total protein lysates of bone marrow supernatant from the femurs of control and cKO mice were analyzed for TNF‐α, IL‐1α, IL‐6, MMP3, and MMP13. n = 6 in each group. N) Representative immunofluorescent images of γ‐H2AX foci in BMSCs from control and cKO mice and quantification of the number of γ‐H2AX foci per cell. n = 6 in each group. Mice age in H), I), J), K), L), M), and N), 2‐month‐old. BMSCs from mice were used in D), E), F), H), I), J), K), M), and N); BMSCs from Human were used in G). Data are represented as mean ± SD. Statistical significance was determined by one‐way ANOVA in C) and E), and two‐sided student's t test in H), J), L), M) and N). *p < 0.05, **p < 0.01, ***p < 0.001.
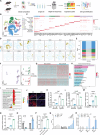
Figure 2
Figure 2
The decrease of USP26 resulted in self‐renewal and multipotency declines of BMSCs in vitro and in vivo. A) Schematic diagram of the serial colony formation unit (CFU) assay through re‐plating. B) Representative images of CFU assay of Usp26 cKO BMSCs and their WT controls after the indicated number of serial re‐plating. Colony number as a quantitative measurement. n = 6 in each group. C) Representative EdU staining images and percentage of EdU positive cells in BMSCs from control and cKO mice. n = 8 in each group. Scale bar, 20 µm. D) Western‐blot analysis of OCT4, NANOG, and SOX2 protein levels in BMSCs from control and cKO mice. n = 3 in each group. E) qPCR analysis of Oct4, Sox2, and Nanog mRNA expressions in BMSCs from control and cKO mice. n = 3 in each group. F) Representative images of ARS and ALP of BMSCs from control and cKO mice after 14 days of osteogenic induction. n = 6 in each group. G) Statistical analysis of the absorbance at 450 nm after ARS and the absorbance at 560 nm after ALP staining. n = 6 in each group. H) qPCR analysis of Alp, Runx2, and Ocn mRNA expressions in BMSCs from control and cKO mice after different days (0, 5, and 10 days) of osteogenic induction. n = 3 in each group. I) Representative images of Oil red O staining of BMSCs from control and cKO mice after 21 days of adipogenic induction. n = 6 in each group. Scale bar, 20 µm (black) and 5 µm (red). J) Statistical analysis of the absorbance at 450 nm after Oil red O staining and percentage of Oil red O positive cells in BMSCs from control and cKO mice. n = 6 in each group. K) qPCR analysis of C/ebpβ, Fabp4, and Pparg mRNA expressions in BMSCs from control and cKO mice after different days (0, 4, and 8 days) of adipogenic induction. n = 3 in each group. L) Representative images of Alcian blue staining of BMSCs from control and cKO mice after 7 days of chondrogenic induction. n = 6 in each group. Scale bar, 50 µm. M) qPCR analysis of Aggrecan, Col2a1, and Sox9 mRNA expressions in BMSCs from control and cKO mice after different days (0, 3, and 7 days) of chondrogenic induction. n = 3 in each group. N) Representative Micro‐CT images of the femurs from control and cKO mice. n = 6 in each group. O) Quantitative analysis of the trabecular bone from control and cKO mice including BV/TV, Tb.N, Tb.Th, Tb.Sp, and BMD. n = 6 in each group. P) Representative H&E staining images of the femurs from control and cKO mice. n = 6 in each group. Scale bar, 500 µm (black) and 100 µm (red). Q) Adipocyte number per tissue area and area of adipocytes per tissue area were measured based on H&E staining images. n = 6 in each group. R) Representative IHC staining of FABP4 of the femurs from control and cKO mice. FABP4 positive cells number serves as a quantitative measurement. n = 6 in each group. Scale bar, 500 µm (black) and 200 µm (red). S) Representative images of the whole skeleton of control and cKO embryos at E16.5. Red arrows indicate delayed alizarin red staining in the femurs. n = 6 in each group. Scale bar, 2.5 mm. T) Representative H&E staining images of the femurs from control and cKO embryos at E16.5. n = 6 in each group. Scale bar, 150 µm (black) and 50 µm (red). U) Representative images of Alcian blue staining of the femurs from control and cKO embryos at E16.5. n = 6 in each group. Scale bar, 150 µm (black) and 50 µm (red). Mice age in B) to R), 2‐month‐old. Mice age in S) to U), E16.5. BMSCs from mice at P5 were used in C)‐M). Data are represented as mean ± SD. Statistical significance was determined by two‐sided Student's t test in C), E), O), Q) and R), one‐way ANOVA in G), and J), and two‐way ANOVA in B), H), K), and M). *p < 0.05, **p < 0.01, ***p < 0.001.
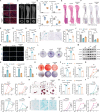
Figure 3
Figure 3
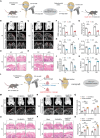
USP26 facilitated the repair of cartilage defects and regeneration. A) 0.6 mm holes were generated in the femoral bones of 8‐week‐old Usp26 cKO male mice and their WT littermate controls. The defects penetrated the bone marrow, and the defect bone samples were collected for Micro‐CT scanning and histological analysis after the surgery. B,C) Representative Micro‐CT images, coronal view, and transaxial view of the femur osteoarticular bone of 8‐week‐old Usp26 cKO male mice and their WT littermate controls at 7 and 14 days after surgery. n = 6 in each group. Scale bar, 500 µm (white) and 300 µm (red). D,E) Representative H&E staining images of the femoral bones of 8‐week‐old Usp26 cKO male mice and their WT littermate controls. n = 6 in each group. Scale bar, 200 µm (black) and 100 µm (red). F) Analysis of ICRS macroscope score for the harvested samples. n = 6 in each group. G) Histological score for the harvested samples. n = 6 in each group. H‐K) Quantitative analysis of the trabecular bone from Usp26 cKO male mice and their WT littermate controls, including BV/TV, Tb.Th, Tb.Sp, and BMD. n = 6 in each group. L) 0.6 mm holes were generated in femoral bones of 8‐week‐old male WT mice. The defects do not penetrate the subchondral bone, and the defects were filled with blank hydrogel, control BMSCs + hydrogel or Usp26 OE BMSCs + hydrogel. The defect bone samples were collected for Micro‐CT scanning and histological analysis after the surgery. M,N) Representative Micro‐CT images and coronal view of the femoral osteoarticular bone from different groups at 7 and 14 days after surgery. n = 6 in each group. Scale bar, 500 µm (white) and 300 µm (red). O‐P) Representative H&E staining images of femoral osteoarticular from different groups. n = 6 in each group. Scale bar, 200 µm (black) and 100 µm (red). Q) Analysis of ICRS macroscope score for the harvested samples. n = 6 in each group. R) Histological score for the harvested samples. n = 6 in each group. Mice age in A) to R), 8‐week‐old. BMSCs from mice at P5 were used in A) and L). Data are represented as mean ± SD. Statistical significance was determined by one‐way ANOVA. *p < 0.05, **p < 0.01, ***p < 0.001.
Figure 4
Figure 4
Supplementation of Usp26 reverses aging and age‐related self‐renewal and multipotent differentiation declines of BMSCs. A) Schematic diagram illustrating Y‐BMSCs and O‐BMSCs transfected with different lentivirus. B) qPCR analysis of Usp26 mRNA expressions in young BMSCs, O‐BMSCs, and O‐BMSCs after being treated with Usp26 overexpression lentivirus. n = 3 in each group. C) Representative SA‐β‐Gal staining images and percentage of SA‐β‐Gal positive cells from young BMSCs, O‐BMSCs, and O‐BMSCs after treated with Usp26 overexpression lentivirus. n = 6 in each group. Scale bar, 10 µm. D) qPCR analysis of P16 and P21 mRNA expressions in young BMSCs, O‐BMSCs, and O‐BMSCs after being treated with Usp26 overexpression lentivirus. n = 3 in each group. E) Representative EdU staining images and percentage of EdU positive cells from young BMSCs, O‐BMSCs, and O‐BMSCs after being treated with Usp26 overexpression lentivirus. n = 6 in each group. Scale bar, 20 µm. F) Representative images of CFU assay in young BMSCs, O‐BMSCs, and O‐BMSCs after being treated with Usp26 overexpression lentivirus. Colony number serves as a quantitative measurement. n = 6 in each group. G) qPCR analysis of Oct4, Nanog, and Sox2 mRNA expressions in young BMSCs, O‐BMSCs, and O‐BMSCs after being treated with Usp26 overexpression lentivirus. n = 3 in each group. H) Representative images of ARS and ALP from particular groups after 14 days of osteogenic induction. n = 6 in each group. I) Statistical analysis of the absorbance at 450 nm of ARS and the absorbance at 560 nm of ALP staining. n = 6 in each group. J) qPCR analysis of Alp, Runx2, and Ocn mRNA expressions in BMSCs from particular groups after different days (0, 5, and 10 days) of osteogenic induction. n = 3 in each group. K) Representative images of Oil red O staining from particular groups after 21 days of adipogenic differentiation. n = 6 in each group. Scale bar, 20 µm (black) and 5 µm (red). L) Statistical analysis of the absorbance at 450 nm of Oil red O staining and percentage of Oil red O positive cells from particular groups. n = 6 in each group. M) qPCR analysis of C/ebpβ, Fabp4, and Pparg mRNA expressions in BMSCs from particular groups after different days (0, 4, and 8 days) of adipogenic differentiation. n = 3 in each group. N) Representative images of Alcian blue staining of BMSCs from particular groups after 7 days of chondrogenic differentiation. n = 6 in each group. Scale bar, 25 µm. O) qPCR analysis of Aggrecan, Col2a1, and Sox9 mRNA expressions in BMSCs from particular groups after different days (0, 3, and 7 days) of chondrogenic differentiation. n = 3 in each group. P) Representative H&E staining images of the femurs from young mice (Y), old mice (O), and old mice treated with Usp26 overexpression adenovirus (O+U). n = 5 in each group. Scale bar, 500 µm. Q) Representative Micro‐CT images of the femurs from young mice, old mice, and old mice treated with Usp26 overexpression adenovirus. n = 5 in each group. R) Quantitative analysis of the trabecular bone from young mice, old mice, and old mice treated with Usp26 overexpression adenovirus, including BV/TV, Tb.N, Tb.Th, Tb.Sp, and BMD. n = 5 in each group. Young mice age, 2‐month‐old. Old mice age, 20‐month‐old. BMSCs from mice at P5 were used in B)‐O). Data are represented as mean ± SD. Statistical significance was determined by one‐way ANOVA in B), C), D), E), F), G), I), L), and R), or two‐way ANOVA in J), M), and O). *p < 0.05, **p < 0.01, ***p < 0.001.
Figure 5
Figure 5
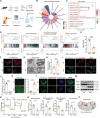
The decrease of USP26 resulted in impaired mitochondrial function of BMSCs. A) Schematic diagram depicting RNA‐Seq and downstream analysis. B) The rose chart of KEGG enrichment analysis for differentially expressed mRNA between BMSCs from control and cKO mice. C) The bubble chart of GO analysis for differentially expressed mRNA between BMSCs from control and cKO mice. D) GSEA showing significant differential enrichment of genes in pathways related to stem cell proliferation, stem cell differentiation, signaling pathways regulating the multipotency of stem cells, and oxidative phosphorylation. E) The ratio of NAD+/NADH in BMSCs from control and cKO mice. n = 5 in each group. F) Representative images of MitoTracker Red staining in BMSCs from control and cKO mice. n = 6 in each group. Scale bar, 2 µm (white) and 0.5 µm (red). G) Representative TEM images of mitochondria in BMSCs from control and cKO mice. n = 8 in each group. Scale bar, 500 nm (black) and 200 nm (red). H) Relative abnormal mitochondria rates in BMSCs from control and cKO mice. n = 8 in each group. I) Detection of JC‐1 monomers (green) and aggregates (red) by confocal fluorescence microscopy in BMSCs from control and cKO mice. n = 6 in each group. Scale bar, 4 µm. J) The ratio of JC‐1 aggregates/JC‐1 monomers in BMSCs from control and cKO mice. n = 6 in each group. K) Representative images of the DCFH‐DA assay showing intracellular ROS levels in BMSCs from control and cKO mice. ROS fluorescence intensity serves as a quantitative measurement. n = 5 in each group. Scale bar, 20 µm. L) Representative images of mtROS in BMSCs from control and cKO mice visualized with MitoSOX (red) staining. n = 5 in each group. Scale bar, 2 µm. M) Western blot analysis of MFN1, MFN2, and FIS1 protein levels in BMSCs from control and cKO mice. n = 3 in each group. N) Detection of the oxygen consumption rates (OCR) in BMSCs from control and cKO mice in response to indicated mitochondrial modulators (Oligomycin, FCCP, Antimycin & Rotenone). n = 5 in each group. O) Calculation of basal respiration, maximal respiration capacity, spare respiration capacity, and ATP production of BMSCs from control and cKO mice by the OCR values. n = 5 in each group. P) Schematic diagram depicting the impaired mitochondria. Mice age in A), E), F), G), H), I), J), K), L), M), N), and O), 2‐month‐old. BMSCs from mice at P5 were used in E)‐O). Data are represented as mean ± SD. Statistical significance was determined by two‐sided student's t test. *p < 0.05, **p < 0.01, ***p < 0.001.
Figure 6
Figure 6
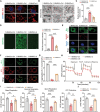
USP26 supplementation reversed age‐related declines in mitochondrial function of BMSCs. A) Representative images of mitochondria in young BMSCs, O‐BMSCs, and O‐BMSCs treated with Usp26 overexpression lentivirus visualized with MitoTracker Red staining. n = 5 in each group. Scale bar, 2 µm (white) and 0.5 µm (yellow). B) Representative TEM images of mitochondria in Young BMSCs, O‐BMSCs, and O‐BMSCs treated with Usp26 overexpression lentivirus. n = 8 in each group. Scale bar, 500 nm (black) and 200 nm (red). C) Relative abnormal mitochondria rates in BMSCs from particular groups. n = 8 in each group. D) Representative images of DCFH‐DA assay showing intracellular ROS levels in young BMSCs, O‐BMSCs, and O‐BMSCs treated with Usp26 overexpression lentivirus. ROS fluorescence intensity serves as a quantitative measurement. n = 5 in each group. Scale bar, 20 µm. E) Representative images of mtROS in young BMSCs, O‐BMSCs, and O‐BMSCs treated with Usp26 overexpression lentivirus visualized with MitoSOX (red) staining. n = 5 in each group. Scale bar, 2 µm. F) Detection of JC‐1 monomers (green) and aggregates (red) by confocal fluorescence microscopy in young BMSCs, O‐BMSCs, and O‐BMSCs treated with Usp26 overexpression lentivirus. n = 6 in each group. Scale bar, 4 µm. G) The ratio of JC‐1 aggregates/JC‐1 monomers in BMSCs from particular groups. n = 6 in each group. H) Detection of the OCR in young BMSCs, O‐BMSCs, and O‐BMSCs treated with Usp26 overexpression lentivirus in response to indicated mitochondrial modulators (Oligomycin, FCCP, Anitimycin & Rotenone). n = 5 in each group. I) Calculation of basal respiration, maximal respiration capacity, spare respiration capacity, and ATP production of BMSCs from particular groups by the OCR values. n = 5 in each group. J) The ratio of NAD+/NADH in young BMSCs, O‐BMSCs, and O‐BMSCs treated with Usp26 overexpression lentivirus. n = 5 in each group. Young mice age, 2‐month‐old. Old mice age, 20‐month‐old. BMSCs from mice at P5 were used in A)‐J). Data are represented as mean ± SD. Statistical significance was determined by one‐way ANOVA. *p < 0.05, **p < 0.01, ***p < 0.001.
Figure 7
Figure 7
The decrease of USP26 results in the ubiquitination degradation of SIRT2 in BMSCs. A) Schematic diagram depicting proteomics and downstream analysis. B) Volcano plots showing differentially expressed proteins in BMSCs from controls and cKO mice. The purple and orange dots represent the up‐regulated and down‐regulated proteins, respectively. C) Heatmap showing differentially expressed proteins of BMSCs from controls and cKO mice. D) The bubble chart of GO analysis for differentially expressed biological process of BMSCs from control and cKO mice. E) Bar plots showing KEGG enrichment analysis for differentially expressed proteins of BMSCs from controls and cKO mice. F) A network diagram of interactions among differentially expressed proteins in BMSCs from control and cKO mice. G) Western‐blot analysis and quantification of SIRT1, SIRT2, SIRT3, SIRT4, SIRT5, SIRT6, and SIRT7 protein levels in BMSCs from controls and cKO mice. n = 3 in each group. H) Western‐blot analysis and quantification of SIRT2 protein level in bone tissue from femurs of control and cKO mice. n = 3 in each group. I) Representative IHC staining of SIRT2 of the femurs from control and cKO mice. n = 6 in each group. Scale bar, 100 µm (black) and 10 µm (red). J) Co‐immunoprecipitation of USP26 with ectopically expressed SIRT2 in HEK‐293 T cells. K) Overexpression of Usp26 decreases the level of ubiquitinated of SIRT2 and increases the expression of SIRT2 protein. L) Western‐blot analysis of the protein level of SIRT2 in HEK‐293 T cells with or without Usp26 overexpression and treated with cycloheximide (CHX) for indicated time intervals. M) The schematic graph reflects the underlying mechanisms of USP26 in decreasing SIRT2 protein degradation by reducing the level of ubiquitinated SIRT2. Mice age in A), G), H), and I), 2‐month‐old. BMSCs from mice at P5 were used in G) and H). Data are represented as mean ± SD. Statistical significance was determined by two‐sided student's t test. ***p < 0.001.
Figure 8
Figure 8
The decrease in the expression of SIRT2 was responsible for the impaired mitochondrial function and the decline in self‐renewal and multipotency of Usp26 cKO BMSCs. A) Representative images of mitochondria from control BMSCs, cKO BMSCs, and cKO BMSCs treated with SIRT2 overexpression lentivirus visualized with MitoTracker Red staining. n = 5 in each group. Scale bar, 2 µm (white) and 0.5 µm (yellow). B) Representative TEM images of mitochondria from control BMSCs, cKO BMSCs, and cKO BMSCs treated with SIRT2 overexpression lentivirus. n = 8 in each group. Scale bar, 500 nm (black) and 200 nm (red). C) Relative abnormal mitochondria rates in BMSCs from particular groups. n = 8 in each group. D) Detection of JC‐1 monomers (green) and aggregates (red) by confocal fluorescence microscopy in control BMSCs, cKO BMSCs, and cKO BMSCs treated with SIRT2 overexpression lentivirus. n = 6 in each group. Scale bar, 4 µm. E) The ratio of JC‐1 aggregates/JC‐1 monomers in BMSCs from particular groups. n = 6 in each group. F) Representative images of the DCFH‐DA assay showing intracellular ROS levels in BMSCs from particular groups. ROS fluorescence intensity serves as a quantitative measurement. n = 5 in each group. Scale bar, 20 µm. G) Representative images of mtROS in control BMSCs, cKO BMSCs, and cKO BMSCs treated with SIRT2 overexpression lentivirus visualized with MitoSOX (red) staining. n = 5 in each group. Scale bar, 2 µm. H) Detection of the OCR of control BMSCs, cKO BMSCs, and cKO BMSCs treated with SIRT2 overexpression lentivirus in response to indicated mitochondrial modulators (Oligomycin, FCCP, Antimycin & Rotenone). n = 5 in each group. I) Calculation of basal respiration, maximal respiration capacity, spare respiration capacity, and ATP production of BMSCs from particular groups by the OCR values. n = 5 in each group. J) The ratio of NAD+/NADH from control BMSCs, cKO BMSCs, and cKO BMSCs treated with Sirt2 overexpression lentivirus. n = 5 in each group. K) Representative SA‐β‐Gal staining images and percentage of SA‐β‐Gal positive cells of control BMSCs, cKO BMSCs and cKO BMSCs treated with SIRT2 overexpression lentivirus. n = 5 in each group. Scale bar, 10 µm. L) qPCR analysis of P16 and P21 mRNA expressions in BMSCs from particular groups. n = 3 in each group. M) Western‐blot analysis of P21, P16, OCT4, NANOG, SOX2, MFN2, FIS1, and SIRT2 protein levels in BMSCs from particular groups. n = 3 in each group. N) Representative EdU staining images and percentage of EdU positive cells of control BMSCs, cKO BMSCs, and cKO BMSCs treated with Sirt2 overexpression lentivirus. n = 8 in each group. Scale bar, 20 µm. O) qPCR analysis of Oct4, Nanog, and Sox2 mRNA expressions in BMSCs from particular groups. n = 3 in each group. P) Representative images of CFU in BMSCs from particular groups are shown. Q) Colony number serves as a quantitative measurement. n = 8 in each group. Mice age in A) to Q), 2‐month‐old. Data are represented as mean ± SD. BMSCs from mice at P5 were used in A)‐Q). Statistical significance was determined by one‐way ANOVA. *p < 0.05, **p < 0.01, ***p < 0.001.
Figure 9
Figure 9
Decreased USP26 expression in aged BMSCs results from reduced HIF‐1α expression. A) Schematic diagram depicting Single‐cell RNA‐Seq and downstream analysis. B) Bone marrow cells of 2‐month‐old and 20‐month‐old mice were isolated for Single‐cell RNA‐seq analysis. t‐SNE plots showing all cell clusters identified using the computational pipeline. C) The bubble chart of the average expression of canonical marker genes for different cell types. D) t‐SNE plots showing the average expression of canonical marker genes for different cell types. E) The proportion of cell types in the single‐cell transcriptome data. F) t‐SNE plots showing BMSCs from 2‐month‐old and 20‐month‐old mice. G) Heatmap of differentially expressed mRNA in BMSCs from 2‐month‐old and 20‐month‐old mice. H) Bar plots showing KEGG enrichment analysis for differentially expressed mRNA in BMSCs from 2‐month‐old and 20‐month‐old mice. I) The peak chart of GSEA analysis for REACTOM Pathways. J) Representative immunofluorescent images of HIF‐1α from the femurs of 2‐month‐old and 20‐month‐old mice. n = 5 in each group. Scale bar, 500 µm (white) and 125 µm (yellow). K) qPCR analysis of Vegf mRNA expressions in BMSCs from 2‐month‐old and 20‐month‐old mice after cultured with normoxia or hypoxia conditions. n = 5 in each group. L) qPCR analysis of Usp26 mRNA expressions in BMSCs from 2‐month‐old and 20‐month‐old mice after cultured with normoxia or hypoxia conditions. n = 5 in each group. M) qPCR analysis of Usp26 mRNA expressions of BMSCs after being treated with different concentrations of DFO (0, 100, and 200 µM). n = 5 in each group. N) qPCR analysis of Usp26 mRNA expressions of BMSCs after treated with different concentrations of CoCl2 (0, 50, and 100 µM). n = 5 in each group. O) qPCR analysis of Vhl and Usp26 mRNA expressions in BMSCs following the treatment with control or Vhl Cre adenoviruses. n = 5 in each group. P) qPCR analysis of Usp26 mRNA expressions of BMSCs in different groups. n = 5 in each group. Q) Dual‐luciferase reporter assays showing the effects of different truncated mutants on Usp26 promoter transcriptional activity. n = 5 in each group. R) ChIP‐qPCR shows the binding sites in HIF‐1α protein and Usp26 promoter. n = 3 in each group. Young mice age, 2‐month‐old. Old mice age, 20‐month‐old. BMSCs from mice at P5 were used in K)‐P). Data are represented as mean ± SD. Statistical significance was determined by two‐way ANOVA in K) and L), one‐way ANOVA in M), N), P), and Q), and two‐sided student's t test in O) and R). **p < 0.01, ***p < 0.001.
Figure 10
Figure 10
Activation of the HIF‐1α‐USP26 pathway combats aging and improves the self‐renewal and multipotent differentiation of aged BMSCs. A) Representative immunofluorescent images of HIF‐1α of the femurs from control, Vhl cKO, and Vhl/Usp26 dKO mice. n = 5 in each group. Scale bar, 500 µm (white) and 125 µm (yellow). B) qPCR analysis of Usp26 mRNA expression in BMSCs from control, Vhl cKO, and Vhl/Usp26 dKO mice. n = 3 in each group. C) Representative Micro‐CT images of the femurs from control, Vhl cKO, and Vhl/Usp26 dKO mice. n = 6 in each group. D) Quantitative analysis of the trabecular bone from control, Vhl cKO, and Vhl/Usp26 dKO mice, including BV/TV, Tb.N, Tb.Th, and Tb.Sp. n = 6 in each group. E) Representative H&E staining images of the femurs from control, Vhl cKO, and Vhl/Usp26 dKO mice. n = 6 in each group. Scale bar, 500 µm (black) and 100 µm (red). F) Representative IHC staining of FABP4 in the femurs from control, Vhl cKO, and Vhl/Usp26 dKO mice. n = 6 in each group. Scale bar, 500 µm (black) and 100 µm (red). G) FABP4 positive cells number as a quantitative measurement. n = 6 in each group. H)Area of adipocytes per tissue area measured based on H&E staining images. n = 6 each group. I) Representative SA‐β‐Gal staining images and percentage of SA‐β‐Gal positive cells in BMSCs from control, Vhl cKO, and Vhl/Usp26 dKO mice. n = 6 in each group. Scale bar, 10 µm. J) qPCR analysis of P16 and P21 mRNA expressions in BMSCs from control, Vhl cKO, and Vhl/Usp26 dKO mice. n = 3 in each group. K) Representative EdU staining images and percentage of EdU positive cells in BMSCs from control, Vhl cKO, and Vhl/Usp26 dKO mice. n = 8 in each group. Scale bar, 20 µm. L) Representative images of CFU in BMSCs from control, Vhl cKO, and Vhl/Usp26 dKO mice. Colony number serves as a quantitative measurement. n = 8 in each group. M) Western‐blot analysis of SIRT2, OCT4, NANOG, and SOX2 protein levels in BMSCs from control, Vhl cKO, and Vhl/Usp26 dKO mice. n = 3 in each group. N) qPCR analysis of Oct4, Nanog, and Sox2 mRNA expressions in BMSCs from control, Vhl cKO, and Vhl/Usp26 dKO mice. n = 3 in each group. O) Representative images of ARS and ALP of BMSCs from control, Vhl cKO, and Vhl/Usp26 dKO mice after 14 days of osteogenic differentiation. n = 6 in each group. P) Statistical analysis of the absorbance at 450 nm of ARS and the absorbance at 560 nm of ALP staining. n = 6 in each group. Q) qPCR analysis of Alp, Runx2, and Ocn mRNA expressions in BMSCs from control, Vhl cKO, and Vhl/Usp26 dKO mice after different days (0, 5, and 10 days) of osteogenic differentiation. n = 3 in each group. R) Representative images of Oil red O staining of BMSCs from control, Vhl cKO, and Vhl/Usp26 dKO mice after 21 days of adipogenic differentiation. n = 6 in each group. Scale bar, 20 µm (black) and 5 µm (red). S) Statistical analysis of the absorbance at 450 nm of Oil red O staining and percentage of Oil red O positive cells in BMSCs from control, Vhl cKO, and Vhl/Usp26 dKO mice. n = 6 in each group. T) qPCR analysis of C/ebpβ, Fabp4, and Pparg mRNA expressions in BMSCs from control, Vhl cKO, and Vhl/Usp26 dKO mice after different days (0, 4, and 8 days) of adipogenic differentiation. n = 3 in each group. U) Representative images of alcian blue staining of BMSCs from control, Vhl cKO, and Vhl/Usp26 dKO mice after 7 days of chondrogenic differentiation. n = 6 in each group. Scale bar, 50 µm. V) qPCR analysis of Aggrecan, Col2a1, and Sox9 mRNA expressions in BMSCs from control, Vhl cKO, and Vhl/Usp26 dKO mice after different days (0, 3, and 7 days) of chondrogenic differentiation. n = 3 in each group. Mice age in A) to H), 6‐month‐old. Mice age in I) to V), 18‐month‐old. BMSCs from mice at P5 were used in I)‐V). Data are represented as mean ± SD. Statistical significance was determined by one‐way ANOVA in B), D), G), H), I), J), K), L), N), P), and S), two‐way ANOVA in Q), T), and V). *p < 0.05, **p < 0.01, ***p < 0.001.
Figure 11
Figure 11
Schematic of the HIF‐1α/USP26/SIRT2 axis combats age‐related declines in self‐renewal and multipotent differentiation of BMSC by maintaining mitochondrial homeostasis. As BMSCs age, decreased HIF‐1α expression reduces its binding to the −191— −198 and −262— −269 bp on the USP26 promoter, thereby dampening Usp26 transcriptional expression. This leads to reduced protein expression of SIRT2 through the promotion of its ubiquitination and degradation. Consequently, mitochondrial dysfunction occurs in BMSCs, resulting in senescence phenotypes characterized by decreased self‐renewal and impaired multilineage differentiation potentials.

References

    1. a) Hoang D. M., Pham P. T., Bach T. Q., Ngo A. T. L., Nguyen Q. T., Phan T. T. K., Nguyen G. H., Le P. T. T., Hoang V. T., Forsyth N. R., Heke M., Nguyen L. T., Signal Transduction Targeted Ther. 2022, 7, 272; - PMC - PubMed
    2. b) Uccelli A., Moretta L., Pistoia V., Nat. Rev. Immunol. 2008, 8, 726. - PubMed
    1. a) Deng P., Yuan Q., Cheng Y., Li J., Liu Z., Liu Y., Li Y., Su T., Wang J., Salvo M. E., Wang W., Fan G., Lyons K., Yu B., Wang C.‐Y., Cell Stem Cell 2021, 28, 1057; - PMC - PubMed
    2. b) Rauch A., Mandrup S., Nat. Rev. Mol. Cell Biol. 2021, 22, 465; - PubMed
    3. c) Zhang P., Dong J., Fan X., Yong J., Yang M., Liu Y., Zhang X., Lv L., Wen L., Qiao J., Tang F., Zhou Y., Signal Transduction Targeted Ther. 2023, 8, 126; - PMC - PubMed
    4. d) Liu F., Yuan Y., Bai L., Yuan L., Li L., Liu J., Chen Y., Lu Y., Cheng J., Zhang J., Redox Biol. 2021, 43, 101963. - PMC - PubMed
    1. a) Lin H., Sohn J., Shen H., Langhans M. T., Tuan R. S., Biomaterials 2019, 203, 96; - PMC - PubMed
    2. b) Dhoke N. R., Kaushik K., Das A., Mol. Ther. 2020, 28, 1314; - PMC - PubMed
    3. c) Gurtner G. C., Werner S., Barrandon Y., Longaker M. T., Nature 2008, 453, 314. - PubMed
    1. a) Galipeau J., Sensébé L., Cell Stem Cell 2018, 22, 824; - PMC - PubMed
    2. b) Baker N., Boyette L. B., Tuan R. S., Bone 2015, 70, 37; - PubMed
    3. c) Krampera M., Le Blanc K., Cell Stem Cell 2021, 28, 1708. - PubMed
    1. a) Jung S., Lee S., Kim H. J., Kim S., Moon J. H., Chung H., Kang S.‐J., Park C.‐G., Exp. Mol. Med. 2023, 55, 665; - PMC - PubMed
    2. b) Mishima K., Kitoh H., Ohkawara B., Okuno T., Ito M., Masuda A., Ishiguro N., Ohno K., eBioMedicine 2015, 2, 2046. - PMC - PubMed

Substances

LinkOut - more resources