. 2025 Jan 12;27(1):237-253.
doi: 10.1093/neuonc/noae179.

MYC-dependent upregulation of the de novo serine and glycine synthesis pathway is a targetable metabolic vulnerability in group 3 medulloblastoma

Affiliations

MYC-dependent upregulation of the de novo serine and glycine synthesis pathway is a targetable metabolic vulnerability in group 3 medulloblastoma

Magretta Adiamah et al. Neuro Oncol. .

Abstract

Background: Group 3 medulloblastoma (MBGRP3) represents around 25% of medulloblastomas and is strongly associated with c-MYC (MYC) amplification, which confers significantly worse patient survival. Although elevated MYC expression is a significant molecular feature in MBGRP3, direct targeting of MYC remains elusive, and alternative strategies are needed. The metabolic landscape of MYC-driven MBGRP3 is largely unexplored and may offer novel opportunities for therapies.

Methods: To study MYC-induced metabolic alterations in MBGRP3, we depleted MYC in isogenic cell-based model systems, followed by 1H high-resolution magic-angle spectroscopy (HRMAS) and stable isotope-resolved metabolomics, to assess changes in intracellular metabolites and pathway dynamics.

Results: Steady-state metabolic profiling revealed consistent MYC-dependent alterations in metabolites involved in one-carbon metabolism such as glycine. 13C-glucose tracing further revealed a reduction in glucose-derived serine and glycine (de novo synthesis) following MYC knockdown, which coincided with lower expression and activity of phosphoglycerate dehydrogenase (PHGDH), the rate-limiting enzyme in this pathway. Furthermore, MYC-overexpressing MBGRP3 cells were more vulnerable to pharmacological inhibition of PHGDH compared to those with low expression. Using in vivo tumor-bearing genetically engineered and xenograft mouse models, pharmacological inhibition of PHGDH increased survival, implicating the de novo serine/glycine synthesis pathway as a pro-survival mechanism sustaining tumor progression. Critically, in primary human medulloblastomas, increased PHGDH expression correlated strongly with both MYC amplification and poorer clinical outcomes.

Conclusions: Our findings support a MYC-induced dependency on the serine/glycine pathway in MBGRP3 that represents a novel therapeutic treatment strategy for this poor prognosis disease group.

Keywords: MYC; PHGDH; medulloblastoma; metabolism; serine.


Conflict of interest statement

O.D.K.M. is a co-founder, shareholder, and board member of Faeth Therapeutics and has contributed to patent application WO/2017/144877 by CRUK Cancer Research Technology. All other authors declare no competing interests.

Figures
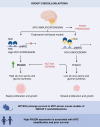
Graphical Abstract
Graphical Abstract
Figure 1.
Figure 1.
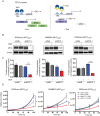
Downregulation of MYC expression in MYC-driven MBGRP3 models shows retained MYC addiction. (A) Schematic diagram demonstrating doxycycline-inducible knockdown of MYC expression. TetR, Tetracycline; TRE, Trans-regulatory elements (created using Biorender.com). (B) Immunoblot analysis and (C) quantification of MYC protein expression in D425med, HDMB03, and D283med medulloblastoma cells expressing shRNAs targeting non-silencing (shNS) and MYC (shMYC1) upon addition of 1 µg/mL doxycycline (Dox) which induces MYC knockdown at 72 hours. β-actin was used as a loading control. (D) Effect of MYC knockdown on cell proliferation was assessed using trypan blue dye exclusion viable cell counting over 120 hours. Growth curves depict D425med, HDMB03, D283med shNS, and shMYC1 bearings cells ± Dox. Values are expressed as mean ± SEM of 3 biological replicates. *P < .05, **P < .01, ***P < .001,**** P < .0001.
Figure 2.
Figure 2.
Perturbation of MYC expression alters the metabolite landscape of MBGRP3 cells. D425med, HDMB03, and D283med shNS and shMYC1 transduced cells were treated with 1 µg/mL Dox for 72 hours and subjected to metabolite profiling using 1H HRMAS. (A) Principal component analysis of spectral bins from HRMAS metabolite analysis, labeled by shRNA construct, and Dox treatment. (B) Hierarchically clustered heatmap analysis of relative spectral bin intensities of HRMAS spectra in MBGRP3 shNS and shMYC1 cells ± Dox treatment. (C) Partial least square discrimination analysis (PLS-DA) of identified metabolites from HRMAS spectra of the pooled D425med, HDMB03, and D283med shMYC1 ± Dox treated cells. (D) Variable importance (VIP) scores of the most significant metabolites contributing to the separating shMYC1 (−Dox) and shMYC1 (+Dox) groups as identified by PLS-DA. The red and green boxes to the right indicate whether a metabolite is increased (red) or decreased (green). (E) Normalized concentrations of the top 3 discriminant metabolites (VIP score ≥ 1.5) in the pooled MBGRP3 shMYC1 cells. Data indicates upper, median, and lower quartiles. Arbitrary units (AU). Data represents the means of 3 biological replicates.
Figure 3.
Figure 3.
MYC-driven MBGRP3 cells display upregulation of de novo serine and glycine synthesis pathways. (A) Heatmaps visualizing log2 gene expression values for MYC, PHGDH, PSAT1, PSPH, SHMT1, SHMT2, and GLDC genes in MBGRP3 cell lines. Both shMYC1 and shNS groups are shown and their respective ± Dox conditions, in multiple independent replicates. PHGDH, phosphoglycerate dehydrogenase; PSAT1, phosphoserine aminotransferase 1; PSPH: phosphoserine phosphatase; SHMT1/2, serine hydroxymethyltransferase 1/2; GLDC, glycine decarboxylase. (B) Immunoblot analysis and (C) quantification of SGP pathway enzymes following MYC KD. β-actin was used as a loading control. Data represents mean ± SEM of 3 biological replicates. (D) Quantification of PHGDH activity in shMYC1 ± Dox. Mean ± SEM of 3 biological replicates. * P < .05, ** P < .01. (E). Schematic of isotopologues following 13C-glucose labeling in glycolysis and the de novo SGP. Peak areas of 13C isotopologues (F) phosphoserine (G) serine (H) glycine in D425med cells expressing shMYC1 following the addition of doxycycline and MYC knockdown. Metabolites are denoted with +1, +2, +3 to indicate the number of heavy isotopes. Data represents mean ± SD of 3 biological replicates- **P < .01, ***P < .001
Figure 4.
Figure 4.
MBGRP3 cells are sensitive to pharmacological inhibition of the de novo SGP in a MYC-dependent fashion. (A) Dose–response curves following PHDGH inhibition mediated by NCT-503 treatment in shMYC1 isogenic cell lines ± Dox. Respective IC50 values are indicated. Confidence intervals D425med shMYC1 (− Dox) = 11.5–19.9 µM, D425med shMYC1 (+ Dox) = 32–57.4 µM. HDMB03 shMYC1 (− Dox) = 19.8–27.9 µM, HDMB03 shMYC1 (+ Dox) = 36.7–52.5 µM D283med shMYC1 (− Dox) = 6.7–13.6 µM, D283med shMYC1 (+ Dox) = 30.8–56.5 µM. Data represents the mean of 5 independent experiments ± SEM (B) Quantification of PHGDH activity following NCT-503 treatment in shMYC ± Dox conditions. Data expressed as mean ± SEM of 3 biological replicates. * P < .05, ** P < .01, *** P < .001. (C) Immunoblot analysis of MYC protein expression in MYC-amplified/gained MBGRP3 and non-amplified non-MBGRP3 cells. β-actin was used as a loading control. (D) Comparison of IC50 values of MYC-amplified MBGRP3 cells versus non-amplified non-MBGRP3 to PHGDH inhibitors, NCT-503 and CBR5884. Boxplot representation of IC50 values from 3 MBGRP3 and 2 non-MBGRP3 cell lines. IC50s derived from 3 independent experiments. The median with upper and lower quartiles are shown as appropriate (E). Representative images of clonogenic assays in D425med, D458med, D283med, and HDMB03 cell lines following 10-day treatment with 25 µM and 50 µM NCT-503. Quantifications represent means of 3 biological replicates ± SEM. Significance determined by one-way ANOVA. * P < .05, ** P < .01, *** P < .001, **** P < .0001. (F) Effect of NCT-503 treatment on colony formation on D425med MYC isogenic cells ± Dox treatment. Representative images of the clonogenic assay in D425med shMYC 1 cell ± Dox following 10-day treatment with 12.5 and 25 µM NCT-503 treatment. Colony numbers are shown normalized to their respective untreated controls. Data represents means of 3 biological replicates ± SEM. Significance determined by one-way ANOVA. *** P < .001, **** P < .0001. (G) Cell cycle analysis using propidium iodide staining following 72 hours of NCT-503 treatment. Data represents mean ± SEM from 3 biological replicates. Significance was tested using a two-way ANOVA for each cell line. * P < .05, ** P < .01. *** P < .001, **** P < .0001
Figure 5.
Figure 5.
In vivo pro-survival effect of NCT-503 treatment. (A) Schematic diagram of in vivo NCT-503 treatment study in mice bearing subcutaneous xenografts (created using Biorender.com). (B) Tumor volumes of subcutaneous xenograft models established by flank injection of D425med in NSG mice. Mice with palpable tumors were injected with vehicle control or NCT-503 via IP injections. Data represents mean ± SEM. n = 8 per experimental group. (C) Kaplan–Meier survival curves of the vehicle or NCT-503 treated mice. (D) Schematic diagram of in vivo NCT-503 treatment study in a medulloblastoma GEMM model. Following spontaneous tumor establishment, mice were randomly assigned to teach treatment group (vehicle n = 4, NCT-503 n = 5) (created using Biorender.com). Mice received tumor monitoring by IVIS imaging on indicated days. Mice were euthanized after reaching humane endpoint. (E) Baseline corrected luminescence intensity from tumor-bearing mice. Data represents mean ± SEM. (F) Kaplan–Meier survival curves of vehicle or NCT-503 treated mice. * indicates P < .05
Figure 6.
Figure 6.
Upregulation of PHGDH is a clinically relevant feature in MYC-amplified medulloblastoma patient samples. (A) Hierarchical clustering and heatmap visualization of the SGP gene signature derived from the Cavalli et al., dataset. Expression values are z-score transformed; hierarchical clustering was performed using Ward distances. (B) Immunohistochemical staining of PHGDH in tissue microarrays containing the four molecular medulloblastoma subgroups samples, illustrating staining of PHGDH high and low samples (n = 183). Scare bar = 100 µM. (C) Quantification of PHGDH staining intensity from immunohistochemical analysis across MBWNT (n = 12), MBSHH (n = 58), MBGRP3 (n = 59), and MBGRP4 (n = 53) Boxplots display upper and lower quartiles and median of PHGDH intensity scores. (D-F) Subgroup-specific comparison of PHGDH intensity scores in MYC-amplified and non-amplified tumor samples in MBSHH (MYCN amplified n = 8, non-amplified n = 50), MBGRP3 (MYC amplified n = 9, non-amplified n = 50) and MBGRP4 (MYCN amplified n = 7, non-amplified n = 49). Significance was determined using t-tests. (G) Kaplan–Meier survival curves of overall survival of medulloblastoma patients with PHGDH low and PHGDH high with a table depicting number of patients at risk at a given time period. Significance was tested using log-rank tests. (H) Forest plots of Cox proportional hazard models for the TMA, assessing PHGDH expression and other clinico-pathological parameters. The significance of hazard ratio estimates was evaluated by log-rank tests with * P < .05, *** P < .001. Red signifies features which are significant in univariate and multivariate analysis. Blue signifies features significant in univariate analysis only (I-K) Subgroup-specific Kaplan–Meier curves depicting association of PHGDH expression with overall survival. Indicated in the pie charts are the proportions of MYC-amplified (green) and non-amplified patients (gray) in the PHGDHHigh and PHGDHLow arms.

References

    1. Massimino M, Biassoni V, Gandola L, et al.Childhood medulloblastoma. Crit Rev Oncol Hematol. 2016;105:35–51. - PubMed
    1. Cavalli FMG, Remke M, Rampasek L, et al.Intertumoral heterogeneity within medulloblastoma subgroups. Cancer Cell. 2017;31(6):737–754.e6. - PMC - PubMed
    1. Schwalbe EC, Lindsey JC, Nakjang S, et al.Novel molecular subgroups for clinical classification and outcome prediction in childhood medulloblastoma: A cohort study. Lancet Oncol. 2017;18(7):958–971. - PMC - PubMed
    1. Taylor MD, Northcott PA, Korshunov A, et al.Molecular subgroups of medulloblastoma: The current consensus. Acta Neuropathol. 2012;123(4):465–472. - PMC - PubMed
    1. Sharma T, Schwalbe EC, Williamson D, et al.Second-generation molecular subgrouping of medulloblastoma: An international meta-analysis of Group 3 and Group 4 subtypes. Acta Neuropathol. 2019;138(2):309–326. - PMC - PubMed

MeSH terms

LinkOut - more resources