. 2025 Aug;254(8):902-915.
doi: 10.1002/dvdy.739. Epub 2024 Oct 8.

A network of transient domains for breaking symmetry during anterior-posterior axis formation in the porcine embryo

Affiliations

A network of transient domains for breaking symmetry during anterior-posterior axis formation in the porcine embryo

Ruben Plöger et al. Dev Dyn. 2025 Aug.

Abstract

Breaking radial symmetry for anterior-posterior axis formation is one of the key developmental steps of vertebrate gastrulation and is established through a succession of transient domains defined by morphology or gene expression. Three such domains were interpreted recently in the rabbit to be part of a "three-anchor-point model" for axis formation. To answer the question as to whether the model is generally applicable to mammals, the dynamic expression patterns of four marker genes were analyzed in the pig, where gastrulating epiblast forms from half the inner cell mass: EOMES and PKDCC transcripts display decreasing expression intensities in the anterior hypoblast and-together with WNT3-increasing intensity in the anterior streak domain and the node; TBX6 expression changes from an initial central expression to exclusive expression in the posterior extremity of the primitive streak. The anterior streak domain has thus a molecular footprint similar to the one in the rabbit, the end node shares TBX6 between the species, while the anterior hypoblast-mirroring specific porcine epiblast derivation and fate-is marked by PKDCC instead of WNT3. The molecular similarities in transient domains point to conserved mechanisms for establishing the mammalian anterior-posterior axis and, possibly, breaking radial symmetry.

Keywords: anterior visceral endoderm; gastrulation; gene expression; pig; primitive streak; radial symmetry.


Conflict of interest statement

The authors declare no conflicts of interest.

Figures

FIGURE 1
FIGURE 1
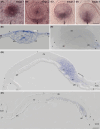
Expression patterns of EOMES in en face views (A–D) using bright‐field illumination and in 5 μm Technovit® sections (E–J) at stage 1 (A, E), 2 (B, F), 3 (C, G–I) and 4 (D, J). In the en face views the embryonic discs are oriented with the anterior pole to the top. Labeled bars in panels A–D indicate the position of sections shown in panels E–J and in Figure 2A–S, respectively. Square brackets in B mark the area of the artifactual dorsal evagination in the embryonic disc center of this specimen which resulted in oblique and tangential sectioning of epiblast and hypoblast illustrated in Figure 2I–S. Photomicrographs of sections are oriented with anterior to the left, rectangles in (G) mark the regions shown at higher magnification in (H, I). Asterisks mark embryonic disc borders; + in (I) indicates the position of bottle cells in the node area, the small circle in (J) indicates the primitive pit. ah, anterior hypoblast; de, definitive epiblast; e, epiblast; exm, extraembryonic mesoderm; m, mesoderm; mt, mural trophoblast; ph, posterior hypoblast; t, trophoblast; y, yolk sac epithelium. The lower left corner of panels E and F contains the alphanumerical identification of individual microscopic sections (MS) within a given series of sections, where five sections are placed on a single microscopical slide. Scale bar in (D) corresponds to 150 μm (A), 133 μm (B), 375 μm (C), and 648 μm for the en face views, the scale bar in (J) corresponds to 200 μm (E), 240 μm (F), 550 μm (G, J), and 360 μm (H, I) for the sections.
FIGURE 2
FIGURE 2
Expression patterns of EOMES in 5 μm Technovit® sections of the stage 1 embryo shown in Figure 1A (A–H) and of the stage 2 embryo shown in Figure 1B (I–S). Orientations and inscriptions as in Figure 1. e, epiblast; mt, mural trophoblast. Open arrowheads in (D–F, L–S) enclose examples of cuboidal hypoblast cells. In the stage 2 embryo (I–S) an artificially folding during the embedding process resulted in oblique and tangential sectioning of epiblast and hypoblast of which examples are marked by the upper and lower brackets, respectively. The scale bar in (s) corresponds to 230 μm in (A–H), 300 μm in (I–S).
FIGURE 3
FIGURE 3
Expression patterns of TBX6 in en face views (a‐d) and in near‐median sagittal Technovit® sections (E–H) at stage 1 (A, E), 2 (B, F), 3 (C, G), and 4 (D, H). Orientations and inscriptions as in Figure 1. The square bracket in (G) indicates the most posterior part of the epiblast. The scale bar in (D) corresponds to 125 μm (A), 160 μm (B), 430 μm (C), and 820 μm (D) for the en face views, the scale bar in (H) corresponds to 200 μm (E), 280 μm (F), 260 μm (G), and 550 μm (H) for the sections.
FIGURE 4
FIGURE 4
Expression patterns of WNT3 in en face views (A–D) and in near‐median sagittal Technovit® sections (E–G) at stage 1 (A), stage 2 (B, E), 3 (C, F), and 4 (D, G). Orientations and inscriptions as in Figures 1, 2, 3, the scale bar in (D) corresponds to 125 μm (A), 150 μm (B), 320 μm (C), and 660 μm (D) for the en face views, the scale bar in (G) corresponds to 400 μm (E, F), and 650 μm (G) for the sections.
FIGURE 5
FIGURE 5
Expression patterns of PKDCC in en face views (A–E) and in near‐median sagittal Technovit® sections (F–J) at stage 1 (A, F) 2 (B, G), 3 (C, H), 4− (D, I) and 4+ (E, J). Orientations and inscriptions as in Figures 1, 2, 3, 4, the dotted line in (D) marks the border of the embryonic disc as determined by dark‐field microscopy, the arrows in (K) and (M) indicate the posterior edge of the epiblast basement membrane defining the position of the node, the scale bar in (E) corresponds to 120 μm (A), 150 μm (B), 400 μm (C), 520 μm (D), and 820 μm (E) for the en face views, the scale bar in (M) corresponds to 200 μm (f), 220 μm (G), 500 μm (H), 260 μm (I), 520 μm (J), 270 μm (K), 800 μm (L), 350 μm (M) for the sections.
FIGURE 6
FIGURE 6
Expression pattern of PKDCC in an en face view (A) and in a near‐median sagittal Technovit® section (B) at stage 1 in a specimen which was overstained due to suboptimal primary tissue fixation. Orientations and inscriptions as in Figure 1. Open arrowheads enclose cuboidal hypoblast cells. The scale bar in (A) corresponds to 120 μm, the scale bar in (B) corresponds to 200 μm.
FIGURE 7
FIGURE 7
Schematic representation of expression pattern of the genes of interest in the domains of the three‐anchor point during a–p axis formation in dorsal view in the rabbit (A) and pig embryo (B). Dashed and dotted lines delineate the embryonic disc at stage 1 and 3, respectively. Gray solid lines and Roman numerals indicate the anchor points of the “Three‐anchor point model,” anterior marginal crescent (I, sickle shape) and anterior hypoblast (I, round shape), anterior streak domain (II, oval shape), end note (III, rhomboid shape). Principal changes in gene expression intensities from stage 1 to stage 3 are schematically represented by the shapes of colored bars. Colors indicate gene of interest: EOMES (yellow), TBX6 (red), WNT3 (green) and PKDCC (blue).
FIGURE 8
FIGURE 8
Schematic representation of domains developing during a–p axis formation in the porcine embryo in dorsal views (A–E) with corresponding sections (F–I), compass needle (J–M) and body (N) symbols to illustrate the decreasing range of possible (J–L) and definitive (M, N) A–P axes. Colors indicating gene expression at stage 2 (O) and 3 (P): EOMES (orange), TBX6 (matt red), WNT3 (dark green) and PKDCC (blue) in the section of stage 2 (O) and 3 (P). Embryonic tissue (skin‐colored) and extraembryonic tissue (gray) with a black dashed line between both tissues anteriorly (B–E). Anterior hypoblast (AHB, green), anterior streak domain (ASD, blue) and end node (EN, yellow) are the three anchors of the putative three‐anchor model. A central zone marked by pkdcc is indicated by the light blue dotted line and the light blue area (C, D). Red dashed line: Border toward the posterior gastrula extension. PS (primitive streak, purple). In the sections for the schematic representation of the expression patterns (O–P) black rectangles mark the border of the cell layers: de, definitive epiblast; h, hypoblast; m, mesoderm; t, trophoblast; y, yolk sac epithelium.

References

    1. Stern CD. Gastrulation in the chick. In: Stern CD, ed. Gastrulation: From Cells to Embryo. 1st ed. Cold Spring Harbor Laboratory Press; 2004.
    1. Viebahn C. Gastrulation in the rabbit. In: Stern CD, ed. Gastrulation: From Cells to Embryo. 1st ed. Cold Spring Harbor laboratory Press; 2004.
    1. Eakin GS, Behringer RR. Gastrulation in other mammals and humans. In: Stern CD, ed. Gastrulation: From Cells to Embryo. 1st ed. Cold Spring Harbor Laboratory Press; 2004.
    1. Stern CD. The chick: a great model system becomes even greater. Dev Cell. 2005;8(1):9‐17. doi: 10.1016/j.devcel.2004.11.018 - DOI - PubMed
    1. Fischer B, Chavatte‐Palmer P, Viebahn C, Santos AN, Duranthon V. Rabbit as a reproductive model for human health. Reproduction. 2012;144(1):1‐10. doi: 10.1530/REP-12-0091 - DOI - PubMed

Substances

LinkOut - more resources