

Small RNAs in plasma extracellular vesicles define biomarkers of premanifest changes in Huntington's disease
- PMID: 39377487
- PMCID: PMC11633361
- DOI: 10.1002/jev2.12522
Small RNAs in plasma extracellular vesicles define biomarkers of premanifest changes in Huntington's disease
Abstract
Despite the advances in the understanding of Huntington's disease (HD), there is a need for molecular biomarkers to categorize mutation carriers during the preclinical stage of the disease preceding functional decline. Small RNAs (sRNAs) are a promising source of biomarkers since their expression levels are highly sensitive to pathobiological processes. Here, using an optimized method for plasma extracellular vesicles (EVs) purification and an exhaustive analysis pipeline of sRNA sequencing data, we show that EV-sRNAs are downregulated early in mutation carriers and that this deregulation is associated with premanifest cognitive performance. Seven candidate sRNAs (tRF-Glu-CTC, tRF-Gly-GCC, miR-451a, miR-21-5p, miR-26a-5p, miR-27a-3p and let7a-5p) were validated in additional subjects, showing a significant diagnostic accuracy at premanifest stages. Of these, miR-21-5p was significantly decreased over time in a longitudinal study; and miR-21-5p and miR-26a-5p levels correlated with cognitive changes in the premanifest cohort. In summary, the present results suggest that deregulated plasma EV-sRNAs define an early biosignature in mutation carriers with specific species highlighting the progression and cognitive changes occurring at the premanifest stage.
Keywords: Huntington's disease; biomarker; extracellular vesicles; miRNA; premanifest; small RNA; tRF.
© 2024 The Author(s). Journal of Extracellular Vesicles published by Wiley Periodicals LLC on behalf of International Society for Extracellular Vesicles.
Conflict of interest statement
The authors have declared that no conflict of interest exists.
Figures

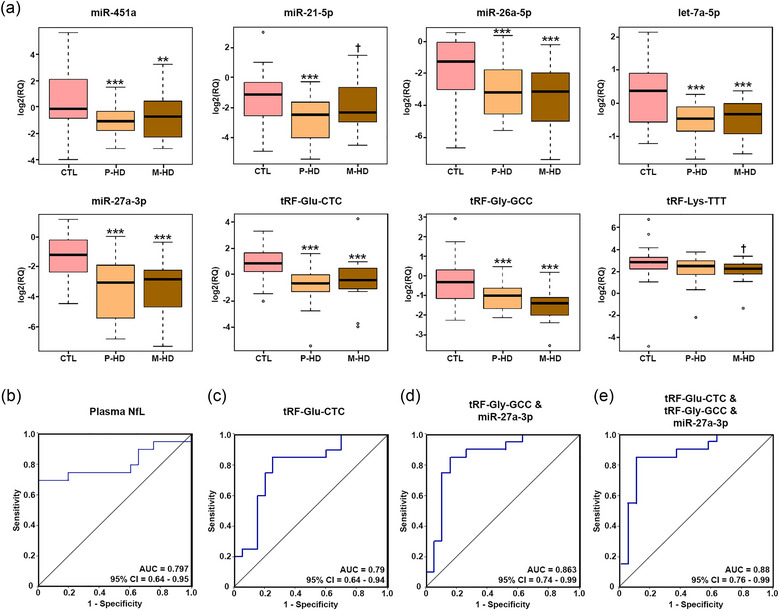
 (p‐value < 0.05). (b) ROC curves analysis of the sensitivity and specificity of plasma NfL between P‐HD and CTL (p‐value = 0.001). (c) Representative ROC curve analysis of the sensitivity and specificity of an individual validated sRNA: tRF‐Glu‐CTC between P‐HD and CTL (p‐value = 0.002). (d) ROC curves analysis of the sensitivity and specificity of a novel 2‐sRNAs‐biosignature: an ensemble of tRF‐Gly‐GCC and miR‐27a‐3p between P‐HD and CTL (p‐value = 0.0001). (e) ROC curves analysis of the sensitivity and specificity of a novel 3‐sRNAs‐biosignature: the ensemble of tRF‐Glu‐CTC, tRF‐Gly‐GCC and miR‐27a‐3p between P‐HD and CTL (p‐value = 0.0001). n = 20‐21 per group.
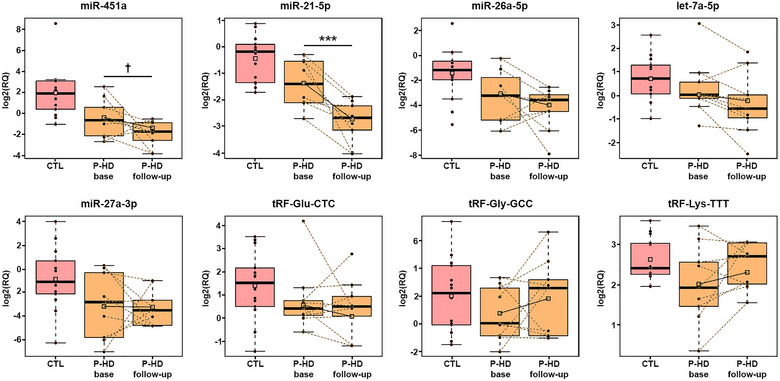 (p‐value < 0.05). n = 9 samples per group.
References
-
- Albanese, M. , Chen, Y. A. , Hüls, C. , Gärtner, K. , Tagawa, T. , Mejias‐Perez, E. , Keppler, O. T. , Göbel, C. , Zeidler, R. , Shein, M. , Schütz, A. K. , & Hammerschmidt, W. (2021). MicroRNAs are minor constituents of extracellular vesicles that are rarely delivered to target cells. PLoS Genetics, 17, e1009951. - PMC - PubMed
-
- Arroyo, J. D. , Chevillet, J. R. , Kroh, E. M. , Ruf, I. K. , Pritchard, C. C. , Gibson, D. F. , Mitchell, P. S. , Bennett, C. F. , Pogosova‐Agadjanyan, E. L. , Stirewalt, D. L. , Tait, J. F. , & Tewari, M. (2011). Argonaute2 complexes carry a population of circulating microRNAs independent of vesicles in human plasma. Proceedings of the National Academy of Sciences, 108, 5003–5008. - PMC - PubMed
-
- Bates, G. P. , Dorsey, R. , Gusella, J. F. , Hayden, M. R. , Kay, C. , Leavitt, B. R. , Nance, M. , Ross, C. A. , Scahill, R. I. , Wetzel, R. , Wild, E. J. , & Tabrizi, S. J. (2015). Huntington disease. Nature Reviews Disease Primers, 1, 1–21. - PubMed
-
- Braisch, U. , Muche, R. , Rothenbacher, D. , Landwehrmeyer, G. B. , Long, J. D. , & Orth, M. (2019). Identification of symbol digit modality test score extremes in Huntington's disease. American Journal of Medical Genetics, Part B: Neuropsychiatric Genetics, 180, 232–245. - PubMed
-
- Byrne, L. M. , Rodrigues, F. B. , Blennow, K. , Durr, A. , Leavitt, B. R. , Roos, R. A. C. , Scahill, R. I. , Tabrizi, S. J. , Zetterberg, H. , Langbehn, D. , & Wild, E. J. (2017). Neurofilament light protein in blood as a potential biomarker of neurodegeneration in Huntington's disease: A retrospective cohort analysis. Lancet Neurology, 16, 601–609. - PMC - PubMed
MeSH terms
Substances
Grants and funding
- FJC2019-039633-I/Postdoctoral fellowship Juan de la Cierva
- PRE2018-085617/PhD Fellowship Spanish Ministry of Science and Innovation
- 2021 Human Biology Project/Huntington's Disease Society of America (HDSA)
- AEI/10.13039/501100011033/Spanish Ministry of Science and Innovation
- PID2020-113953RB-I00/Spanish Ministry of Science and Innovation
LinkOut - more resources
Full Text Sources
Medical
Molecular Biology Databases
