. 2024 Nov 19;9(11):e0106024.
doi: 10.1128/msystems.01060-24. Epub 2024 Oct 8.

Protein aggregation is a consequence of the dormancy-inducing membrane toxin TisB in Escherichia coli

Affiliations

Protein aggregation is a consequence of the dormancy-inducing membrane toxin TisB in Escherichia coli

Florian H Leinberger et al. mSystems. .

Abstract

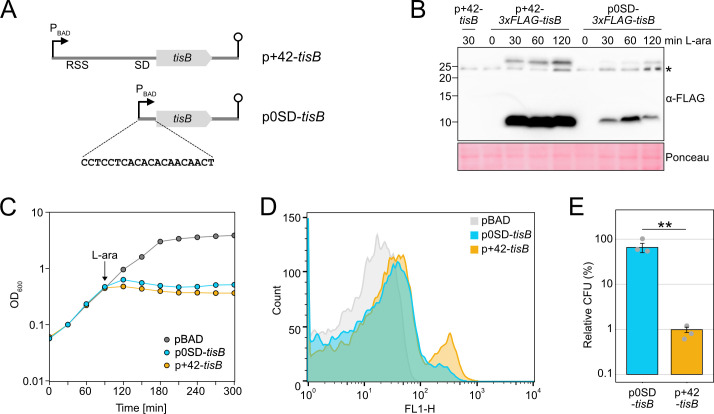
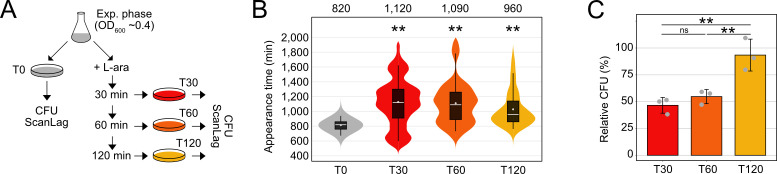
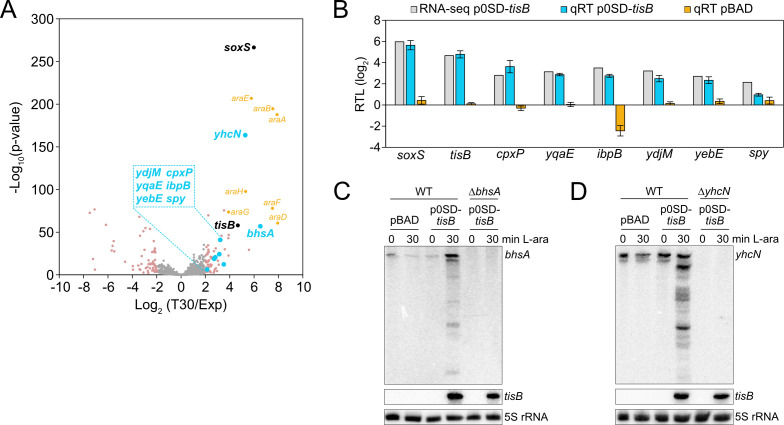
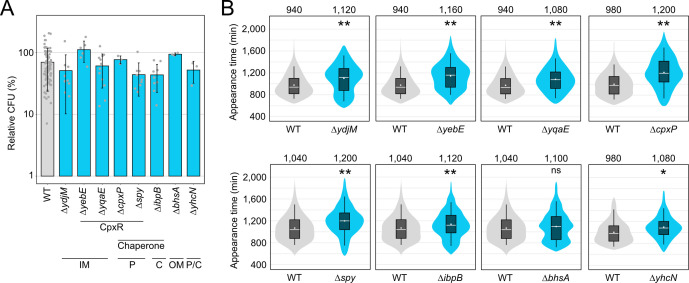
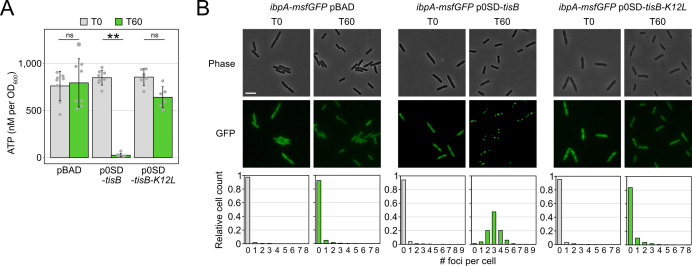
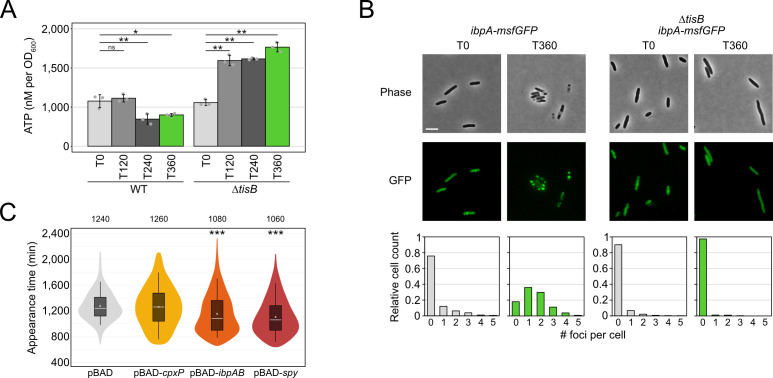
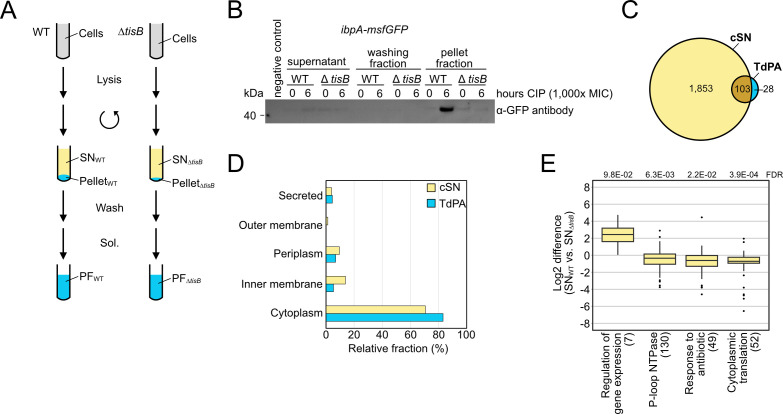
Bacterial dormancy is a valuable strategy to survive stressful conditions. Toxins from chromosomal toxin-antitoxin systems have the potential to halt cell growth, induce dormancy, and eventually promote a stress-tolerant persister state. Due to their potential toxicity when overexpressed, sophisticated expression systems are needed when studying toxin genes. Here, we present a moderate expression system for toxin genes based on an artificial 5' untranslated region. We applied the system to induce expression of the toxin gene tisB from the chromosomal type I toxin-antitoxin system tisB/istR-1 in Escherichia coli. TisB is a small hydrophobic protein that targets the inner membrane, resulting in depolarization and ATP depletion. We analyzed TisB-producing cells by RNA-sequencing and revealed several genes with a role in recovery from TisB-induced dormancy, including the chaperone genes ibpAB and spy. The importance of chaperone genes suggested that TisB-producing cells are prone to protein aggregation, which was validated by an in vivo fluorescent reporter system. We moved on to show that TisB is an essential factor for protein aggregation upon DNA damage mediated by the fluoroquinolone antibiotic ciprofloxacin in E. coli wild-type cells. The occurrence of protein aggregates correlates with an extended dormancy duration, which underscores their importance for the life cycle of TisB-dependent persister cells.

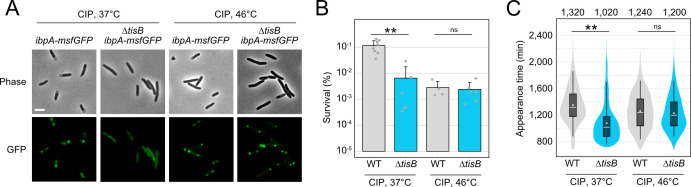
Importance: Protein aggregates occur in all living cells due to misfolding of proteins. In bacteria, protein aggregation is associated with cellular inactivity, which is related to dormancy and tolerance to stressful conditions, including exposure to antibiotics. In Escherichia coli, the membrane toxin TisB is an important factor for dormancy and antibiotic tolerance upon DNA damage mediated by the fluoroquinolone antibiotic ciprofloxacin. Here, we show that TisB provokes protein aggregation, which, in turn, promotes an extended state of cellular dormancy. Our study suggests that protein aggregation is a consequence of membrane toxins with the potential to affect the duration of dormancy and the outcome of antibiotic therapy.

Keywords: antibiotics; dormancy; protein aggregation; toxin-antitoxin systems; type I toxins.


Conflict of interest statement

The authors declare no conflict of interest.

Figures

Fig 1
Fig 1
Characterization of a moderate tisB expression system. (A) Schematic representation of different tisB expression systems. The p+42-tisB plasmid contains the native tisB 5′ UTR, including a RSS and a SD sequence. Transcription from the PBAD promoter starts at the tisB +42 position. The p0SD-tisB plasmid contains the tisB coding sequence preceded by an artificial 20 bp 5′ UTR. Lollipop structures indicate Rho-independent terminators. (B) Detection of 3×FLAG-TisB. Wild-type MG1655 harboring 3×FLAG-tag variants of p+42-tisB and p0SD-tisB were grown to an OD600 of ~0.4 (exponential phase) and treated with L-ara (0.2%). Samples were collected at the indicated time points. Total protein was separated using Tricine-SDS-PAGE and transferred to PVDF membranes by electro-blotting. 3×FLAG-TisB was detected using an HRP-conjugated monoclonal α-FLAG antibody. As a negative control, p+42-tisB was used. Two TisB-specific bands are visible, one at ~10 kDa and one above 25 kDa. The asterisk indicates an unspecific band. Ponceau staining is shown as loading control. (C) Growth inhibition by TisB. Wild-type MG1655, harboring p0SD-tisB, p+42-tisB or an empty pBAD plasmid, was treated with the inducer L-ara (0.2%) at an OD600 of ~0.4 (exponential phase; arrow). The OD600 was measured over time. Data points indicate the mean of three biological replicates. (D) TisB-dependent membrane depolarization. Wild-type MG1655 cells, harboring p0SD-tisB, p+42-tisB or an empty pBAD plasmid, were treated with the inducer L-ara (0.2%) for 1 hour when an OD600 of ~0.4 was reached (exponential phase). Staining with the potential-sensitive probe DiBAC4(3) was applied to assess depolarization. DiBAC4(3) fluorescence was measured using flow cytometry and the FL1-H detector. 10,000 events are displayed for each strain. (E) TisB toxicity with different expression systems. Wild-type MG1655, harboring p0SD-tisB or p+42-tisB was treated with L-ara (0.2%) during the exponential phase (OD600 ~0.4) for 1 hour. Pre- and post-treatment samples were used to determine relative CFU (%). Bars represent the mean of three biological replicates and error bars indicate the standard deviation. Dots show individual data points. ANOVA with post-hoc Tukey HSD test was performed (**P < 0.01).
Fig 2
Fig 2
Dynamic phenotypic features upon moderate tisB expression. (A) Schematic representation of the performed experiment. Wild-type MG1655, harboring the p0SD-tisB plasmid, was treated with L-ara (0.2%) in the exponential phase (OD600 ~0.4). At the indicated time points (T30, T60, and T120), cells were plated on LB agar without L-ara and colony growth was analyzed using the ScanLag method (see Material and Methods). As a control, cells were analyzed before L-ara was added (T0). (B) ScanLag analysis was applied to determine the colony appearance time after tisB expression. For each time point, colony appearance times are illustrated as violin box plots. Colonies from three biological replicates were combined (T0: n = 154; T30: n = 59; T60: n = 103; T120: n = 124). The white dot indicates the mean. The respective median appearance time (white bar) is shown on top of each plot. L-ara-treated samples were compared to the control (T0) using a pairwise Wilcoxon rank-sum test (**P < 0.0001). (C) Colony counts increase upon progressing tisB expression. LB agar plates from panel B were used to determine colony counts. Pre-treatment (T0) and post-treatment (T30, T60, and T120) samples were used to determine relative CFU (%). Bars represent the mean of three biological replicates and error bars indicate the standard deviation. Dots show individual data points. ANOVA with post hoc Tukey HSD test was performed (**P < 0.01; ns: not significant).
Fig 3
Fig 3
Identification of TisB-responsive genes by RNA-seq. (A) Global response to tisB expression. Wild-type MG1655, harboring the p0SD-tisB plasmid, was treated with L-ara (0.2%) during the exponential phase (OD600 ~0.4) for 30 min. RNA samples extracted before (Exp) and after treatment (T30) were analyzed using RNA-seq. The volcano plot illustrates the log2 fold change on the x-axis and the ‒log10(P-value) on the y-axis. Differentially expressed genes (log2 fold change > 2 or < ‒2, P-value < 0.01) are shown in pink. Selected candidates are highlighted in blue, while genes affected by L-ara are shown in orange (araBAD, araE, araFGH), and tisB and soxS are shown in black. (B) Confirmation of RNA-seq using qRT-PCR. Wild-type MG1655, harboring p0SD-tisB (blue bars) or an empty pBAD plasmid (orange bars), was treated with L-ara (0.2%) during exponential phase (OD600 ~0.4) for 30 min. Relative transcript levels (RTL; log2) were assessed by qRT-PCR (qRT). Log2 fold changes from the RNA-seq analysis are shown for comparison (gray bars). Bars represent the mean of three biological replicates, with two technical replicates each, and error bars indicate the standard deviation. (C, D) Confirmation of RNA-seq using northern blot analysis. Wild-type MG1655, harboring p0SD-tisB or an empty pBAD plasmid, was treated with L-ara (0.2%) during the exponential phase (OD600 ~0.4) for 30 min. Total RNA was separated using urea-polyacrylamide gels and blotted onto nylon membranes. Radioactive probes binding to the coding region of (C) bhsA or (D) yhcN were applied for the detection of transcripts. Corresponding deletion mutants (ΔbhsA or ΔyhcN) were used to show the specificity of the probes. A tisB probe was applied to verify tisB induction from p0SD-tisB, and 5S rRNA was probed as loading control.
Fig 4
Fig 4
TisB-responsive genes mainly affect the recovery after tisB expression. (A) TisB toxicity in selected deletion mutants. WT MG1655 and deletion mutants, harboring the p0SD-tisB plasmid, were treated with L-ara (0.2%) during the exponential phase (OD600 ~0.4) for 1 hour. Pre- and post-treatment samples were used to determine relative CFU (%). Bars represent the mean of at least three biological replicates and error bars indicate the standard deviation. Dots show individual data points (WT: n = 102; ΔydjM: n = 9; ΔyebE: n = 6; ΔyqaE: n = 12; ΔcpxP: n = 3; Δspy: n = 9; ΔibpB: n = 9; ΔbhsA: n = 3; ΔyhcN: n = 3). ANOVA with post hoc Tukey HSD was performed (no significant difference between deletion mutants and the wild type was detected). It is indicated whether the genes are CpxR-dependent or have a chaperone activity. Their proposed cellular localization is given (C: cytoplasm, IM: inner membrane, P: periplasm, OM: outer membrane). (B) ScanLag analysis of selected deletion mutants. WT MG1655 and deletion mutants, harboring the p0SD-tisB plasmid, were treated with L-ara (0.2%) during the exponential phase (OD600 ~0.4) for 1 hour. ScanLag was applied to determine the colony appearance time after tisB expression. For each deletion mutant, colony appearance times are illustrated as violin box plots and compared to a corresponding wild type. Colonies from at least three biological replicates were combined (WT: n ≥ 192; ΔydjM: n = 452; ΔyebE: n = 383; ΔyqaE: n = 393; ΔcpxP: n = 252; Δspy: n = 356; ΔibpB: n = 682; ΔbhsA: n = 365; ΔyhcN: n = 192). The white dot indicates the mean. The respective median appearance time (white bar) is shown on top of each plot. Deletion mutants were compared to wild-type MG1655 using a pairwise Wilcoxon rank-sum test (*P < 0.001, **P < 0.0001, ns: not significant). It should be noted that ScanLag results vary between individual runs. For every mutant, statistical testing refers to the corresponding control strain (WT) from the same experimental run.
Fig 5
Fig 5
Expression of tisB causes cytoplasmic protein aggregation. (A) TisB-dependent ATP depletion. Wild-type MG1655, harboring either an empty pBAD plasmid, the p0SD-tisB plasmid, or the p0SD-tisB-K12L variant, was treated with L-ara (0.2%) during the exponential phase (OD600 ~0.4) for 60 min. A luciferase-based assay was applied to measure cellular ATP levels (nM per OD600) before (T0) and after L-ara treatment (T60). Bars represent the mean of at least six biological replicates and error bars indicate the standard deviation. Dots show individual data points (pBAD: n = 8; p0SD-tisB: n = 8; p0SD-tisB-K12L: n = 6). ANOVA with post hoc Tukey HSD test was performed (**P < 0.01; ns: not significant). (B) TisB-dependent protein aggregation in the cytoplasm. Strain MG1655 ibpA-msfGFP, harboring an empty pBAD plasmid, the p0SD-tisB plasmid, or the p0SD-tisB-K12L variant, was treated with L-ara (0.2%) during exponential phase (T0; OD600 ~0.4) for 60 min (T60). Phase contrast images are displayed together with corresponding fluorescence images (GFP). White bars represent a length scale of 2 µm. Representative images from three biological replicates are shown. In the lower panel, msfGFP foci were quantified from three biological replicates. All images were evaluated using a U-Net neural network analysis and in-house image processing tools to automatically count msfGFP foci per cell. At least 507 cells were analyzed for each condition (pBAD T0: n = 507; pBAD T60: n = 3,019; p0SD-tisB T0: n = 730; p0SD-tisB T60: n = 1,474; p0SD-tisB-K12L T0: n = 1,405; p0SD-tisB-K12L T60: n = 1,896).
Fig 6
Fig 6
Analysis of TisB-dependent protein aggregates in wild-type cultures upon CIP treatment. (A) WT MG1655 and a tisB deletion mutant were treated with CIP (10 µg/mL; 1,000× MIC) during the exponential phase (OD600 ~0.4) for 360 min. A luciferase-based assay was applied to measure cellular ATP levels (nM per OD600) before (T0) and after 120 min (T120), 240 min (T240), and 360 min (T360) of L-ara treatment. Bars represent the mean of three biological replicates, with two technical replicates each, and error bars indicate the standard deviation. Dots show individual data points. ANOVA with post hoc Tukey HSD test was performed (*P < 0.05, **P < 0.01, ns: not significant). (B) Strain MG1655 ibpA-msfGFP and ΔtisB ibpA-msfGFP were treated with CIP (10 µg/mL; 1,000× MIC) during exponential phase (T0; OD600 ~0.4) for 360 min (T360). Phase contrast images are displayed together with corresponding fluorescence images (GFP). White bars represent a length scale of 2 µm. Representative images from three biological replicates are shown. In the lower panel, msfGFP foci were quantified from three biological replicates. All images were evaluated using a U-Net neural network analysis and in-house image processing tools to automatically count msfGFP foci per cell. At least 577 cells were analyzed for each condition (ibpA-msfGFP T0: n = 766; ibpA-msfGFP T360: n = 577; ΔtisB ibpA-msfGFP T0: n = 1,621; ΔtisB ibpA-msfGFP T360: n = 901). (C) Influence of chaperone overexpression on recovery. Wild-type MG1655, harboring pBAD-cpxP, pBAD-ibpAB, pBAD-spy, or an empty pBAD plasmid, was pre-treated with the inducer L-ara (0.2%) for 30 min prior to the addition of CIP (10 µg/mL; 1,000× MIC) during exponential phase (OD600 ~0.4) for 6 hours. ScanLag was applied to determine the colony appearance time after CIP treatment. Colony appearance times are illustrated as violin box plots. Colonies from at least six biological replicates were combined (pBAD: n = 471; pBAD-cpxP: n = 266; pBAD-ibpAB: n = 479; pBAD-cpxP: n = 373). The white dot indicates the mean. The respective median appearance time (white bar) is shown on top of each plot. The chaperone overexpression strains were compared to the empty pBAD plasmid using a pairwise Wilcoxon rank-sum test (***P < 0.0001).
Fig 7
Fig 7
Proteome analysis of aggregates. (A) Schematic representation of the protein aggregate purification procedure. WT MG1655 and a tisB deletion mutant (ΔtisB) were treated with CIP (10 µg/mL; 1,000× MIC) during the exponential phase (OD600 ~0.4) for 6 hours. After cell lysis and centrifugation, SNs were collected for LC-MS analysis. The pellet fractions were washed three times and solubilized (Sol.) to receive pellet fractions (PF) for LC-MS analysis. (B) Western blot validation of protein aggregate purification. WT MG1655 ibpA-msfGFP and ΔtisB ibpA-msfGFP were treated with CIP (10 µg/mL; 1,000× MIC) during exponential phase (OD600 of ~0.4) and samples were collected at the indicated time points as described in Materials and Methods. A western blot was performed to detect IbpA-msfGFP using an α-GFP antibody. (C) Euler diagram of proteins identified by LC-MS. All proteins that were identified in at least two biological replicates of either wild-type or ΔtisB supernatant samples were combined (combined supernatant; cSN) and used as a reference data set. All proteins that were exclusively present or enriched in wild-type pellet fractions in comparison to ΔtisB were defined as TisB-dependent protein aggregates (TdPA). (D) Protein localization was predicted using LocTree3. The relative fractions of different protein localizations are shown for the combined supernatant (cSN) and TisB-dependent protein aggregates (TdPA). (E) 1D annotation enrichment results of differentially abundant proteins in the SNWT versus SNΔtisB (number of enriched terms in brackets; Benjamini-Hochberg FDR provided on top).
Fig 8
Fig 8
Heat-induced protein aggregates affect recovery from CIP. (A) Strain MG1655 ibpA-msfGFP and ΔtisB ibpA-msfGFP were treated with CIP (10 µg/mL; 1,000× MIC) during the exponential phase (OD600 ~0.4) for 6 hours at 37°C or 46°C. Phase contrast images are displayed together with corresponding fluorescence images (GFP). White bars represent a length scale of 2 µm. (B) WT MG1655 and a tisB deletion mutant were treated with ciprofloxacin (10 µg/mL; 1,000× MIC) during the exponential phase (OD600 ~0.4) for 6 hours at 37°C or 46°C. Pre- and post-treatment samples were used to determine relative CFU (%). Bars represent the mean of at least four biological replicates and error bars indicate the standard deviation. Dots show individual data points (WT 37°C: n = 8; ΔtisB 37°C: n = 6; WT 46°C: n = 4; ΔtisB 46°C: n = 6). ANOVA with post-hoc Tukey HSD was performed (**P < 0.01, ns: not significant). (C) WT MG1655 and a tisB deletion mutant were treated with ciprofloxacin (10 µg/mL; 1,000×MIC) during exponential phase (OD600 ~0.4) for 6 hours at 37°C or 46°C. ScanLag was applied to determine the colony appearance time after CIP treatment. Colony appearance times are illustrated as violin box plots. Colonies from at least three biological replicates were combined (WT 37°C: n = 1,431; ΔtisB 37°C: n = 272; WT 46°C: n = 476; ΔtisB 46°C: n = 1,026). The white dot indicates the mean. The respective median appearance time (white bar) is shown on top of each plot. The ΔtisB mutant was compared to the corresponding wild type MG1655 using a pairwise Wilcoxon rank-sum test (**P < 0.0001, ns: not significant).

References

    1. Ayrapetyan M, Williams T, Oliver JD. 2018. Relationship between the viable but nonculturable state and antibiotic persister cells. J Bacteriol 200:e00249-18. doi:10.1128/JB.00249-18 - DOI - PMC - PubMed
    1. Lewis K. 2007. Persister cells, dormancy and infectious disease. Nat Rev Microbiol 5:48–56. doi:10.1038/nrmicro1557 - DOI - PubMed
    1. Veening J-W, Smits WK, Kuipers OP. 2008. Bistability, epigenetics, and bet-hedging in bacteria. Annu Rev Microbiol 62:193–210. doi:10.1146/annurev.micro.62.081307.163002 - DOI - PubMed
    1. McDonald MD, Owusu-Ansah C, Ellenbogen JB, Malone ZD, Ricketts MP, Frolking SE, Ernakovich JG, Ibba M, Bagby SC, Weissman JL. 2024. What is microbial dormancy? Trends Microbiol 32:142–150. doi:10.1016/j.tim.2023.08.006 - DOI - PubMed
    1. Lennon JT, Jones SE. 2011. Microbial seed banks: the ecological and evolutionary implications of dormancy. Nat Rev Microbiol 9:119–130. doi:10.1038/nrmicro2504 - DOI - PubMed

MeSH terms