. 2024 Dec;51(6):919-934.
doi: 10.1007/s10928-024-09940-9. Epub 2024 Oct 8.

Computing optimal drug dosing regarding efficacy and safety: the enhanced OptiDose method in NONMEM

Affiliations

Computing optimal drug dosing regarding efficacy and safety: the enhanced OptiDose method in NONMEM

Freya Bachmann et al. J Pharmacokinet Pharmacodyn. 2024 Dec.

Abstract

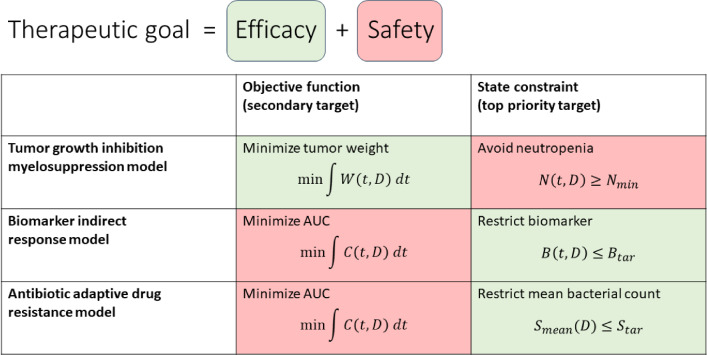
Recently, an optimal dosing algorithm (OptiDose) was developed to compute the optimal drug doses for any pharmacometrics model for a given dosing scenario. In the present work, we enhance the OptiDose concept to compute optimal drug dosing with respect to both efficacy and safety targets. Usually, these are not of equal importance, but one is a top priority, that needs to be satisfied, whereas the other is a secondary target and should be achieved as good as possible without failing the top priority target. Mathematically, this leads to state-constrained optimal control problems. In this paper, we elaborate how to set up such problems and transform them into classical unconstrained optimal control problems which can be solved in NONMEM. Three different optimal dosing tasks illustrate the impact of the proposed enhanced OptiDose method.

Keywords: Dose optimization; Efficacy; Optimal control; Optimal dosing; Safety; State constraints.


Conflict of interest statement

Declarations. Competing interests: The authors declare no competing interests.

Figures

Fig. 1
Fig. 1
Illustration of the state constraint. The red line at N(t)=1 separates feasible (neutrophils above 1, the state constraint Ineq. (1) is satisfied) from infeasible model states (neutrophils below 1, indicated as dashed red area) where the state constraint is violated. The black line shows a feasible neutrophil level over time, resulting from drug administration starting at day 12 (Color figure online)
Fig. 2
Fig. 2
Tumor growth inhibition and myelosuppression example. In a, the tumor weight W for the optimal solution (black) is depicted, and green area represents CFV. In b, we see the neutrophil level N (black) for the optimal solution and the threshold (red) these should not fall below. The dashed red area indicates infeasible model states with undesirably low neutrophil levels. Initially, neutrophils are at their baseline of 7, shortly after drug administration starts, they drop down towards the threshold but remain above. In c, corresponding drug concentration C for optimal dosing in black and optimal doses D administered via IV bolus at dosing time points (blue crosses) are displayed (Color figure online)
Fig. 3
Fig. 3
Tumor growth inhibition and myelosuppression example. For different penalty parameters, tumor weight is depicted in a and neutrophils in b. For ρ=10 (blue), we observe the lowest tumor weight, however, the neutrophil level drops visibly below the threshold (black). For increasing penalty parameters, we observe numerical convergence of tumor weight and neutrophils (Color figure online)
Fig. 4
Fig. 4
Tumor growth inhibition and myelosuppression example with additional state constraints. In a, the tumor weight W for the optimal solution (black) is depicted, and green area represents CFV. Towards the end and at final time, we observe a larger tumor weight than in Fig. 2a, due to the additional dose-limiting state constraints, and thus a larger CFV. In b, we see the neutrophil level N (black) for the optimal solution and the threshold (solid red) these should not fall below. The dashed red line is the threshold of 1.5 indicating mild neutropenia, neutrophils are below for maximal allowed 5 days. At final time, neutrophils have recovered to the level of 3. In c, corresponding drug concentration C for optimal dosing in black and optimal doses D administered via IV bolus at dosing time points (blue crosses) are displayed, especially third and fourth dose are lower compared to Fig. 2c to achieve the requested higher neutrophil levels at final time (Color figure online)
Fig. 5
Fig. 5
Biomarker example. For different penalty parameters, we see the biomarker levels on the full time interval in a and zoomed in to week three in b. ρ=1 (blue), the state constraint (black) is still visibly violated at day 14, for increased penalty parameters, the state constraint is enforced (up to small violation). Due to the dosing scenario allowing only for weekly dose changes, for large penalty parameters, e.g., ρ=104 (yellow) and ρ=106 (purple), the biomarker levels reach Btar by day 14, but drop down even further to 9 in the third week before they approach the threshold of 10 again (Color figure online)
Fig. 6
Fig. 6
Antibiotic example. The top row shows the optimal solution for optimization of doses administered at fixed dosing time points 0 h and 12 h. The bottom row shows the optimal solution for dosing interval optimization for fixed dose of 50mgkg. In a and d, drug concentration C in the central compartment for the optimal solution (black) is depicted, resulting AUC of the drug is indicated as red area. In b and e, we see the bacterial count S for the optimal solution and the threshold of 100 (dashed black), the mean value Smean is indicated as the green areas above and below the threshold (these have the same area, note the logarithmic scaling). In c and f, corresponding drug concentration in the central compartment (black) for optimal dosing and doses administered via IV infusion at dosing time points (blue crosses) are displayed (Color figure online)
Fig. 7
Fig. 7
Therapeutic goals of the presented examples

References

    1. Bachmann F, Koch G, Pfister M, Szinnai G, Schropp J (2021) OptiDose: computing the individualized optimal drug dosing regimen using optimal control. J Optim Theory Appl 189:46–65 - PMC - PubMed
    1. Bachmann F, Koch G, Pfister M, Szinnai G, Schropp J (2023) OptiDose: computing optimal drug dosing with OptiDose: implementation in NONMEM. J Pharmacokinet Pharmacodyn 50(3):173–188 - PubMed
    1. Beal SL, Sheiner LB, Boeckmann AJ, Bauer RJ (eds) NONMEM 7.5.1 users guides (1989-2024). ICON plc, Gaithersburg. https://nonmem.iconplc.com/nonmem751
    1. Koch G, Walz A, Lahu G, Schropp J (2009) Modeling of tumor growth and anticancer of combination therapy. J Pharmacokinet Pharmacodyn 36(2):179–197 - PubMed
    1. Friberg LE, Henningsson A, Mass H, Nguyen L, Karlsson MO (2002) Model of chemotherapy-induced myelosuppression with parameter consistency across drugs. J Clin Oncol 20(24):4713–4721 - PubMed

Substances

LinkOut - more resources