. 2025 Feb 7;15(2):329-345.
doi: 10.1158/2159-8290.CD-23-1541.

The Evolutionary Forest of Pancreatic Cancer

Affiliations

The Evolutionary Forest of Pancreatic Cancer

Katelyn M Mullen et al. Cancer Discov. .

Abstract

Although the pancreatic cancer genome has been described, it has not been explored with respect to stages of diagnosis or treatment bottlenecks. We now describe and quantify the genomic features of PDAC in the context of evolutionary metrics and in doing so have identified a novel prognostic biomarker.


Conflict of interest statement

H. Zhang reports other support from Valar Labs outside the submitted work. A.P. Makohon-Moore reports grants from the NCI, the American Cancer Society, the Scott Mackenzie Foundation, the American Association for Cancer Research, and the New Jersey Health Foundation during the conduct of the study. A. Zucker reports grants from Ruth L Kirschstein T32 MD/PD Training Grant outside the submitted work. N.D. Socci reports grants from NIH during the conduct of the study. C.A. Iacobuzio-Donahue reports other support from Bristol Myers Squibb outside the submitted work. No disclosures were reported by the other authors.

Figures
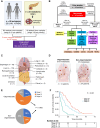
Figure 1.
Figure 1.
Overview of study and clinical features of cohort. A, Schematic illustrating the source of samples from each institution. B, Overview of analysis pipeline and sequencing strategy for identification of somatic alterations in tumor tissues from 91 PDAC cases. Mutations were annotated using five independent tools available from OpenCRAVAT. C, Locations of all metastatic samples in the study. D, Proportion of patients with oligometastatic disease in the study. Oligometastatic disease was considered to be any patient with 0–5 metastases cumulatively from diagnosis to death. E, Proportion of patients with oligometastatic disease stratified by stage at diagnosis. F, Kaplan–Meier survival curve of all 91 patients stratified by the stage at diagnosis. JHH, Johns Hopkins School of Medicine; MSK, Memorial Sloan Kettering Cancer Center. (Created with BioRender.com.)
Figure 2.
Figure 2.
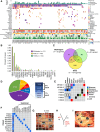
Genetic alterations within multiregion cohort. A, Overview of somatic alterations detected in tumor samples of 90 PDAC cases. One case (PAM30) was not included due to lack of driver mutations identified by three sequencing modalities. Only those genes with mutations in at least two patients, one of which had a driver score of 3 or higher, are shown. The complete list of annotated driver mutations for all patients can be found in Supplementary Table S4. B, Frequency of somatic alteration for driver gene mutations identified in two or more patients in the current study compared with the ICGC and TCGA. C, Overlap of driver genes with two or more nonsynonymous mutations in the current study, ICGC (1), and TCGA (4) PDAC cohorts. The list of genes corresponding to the Venn diagram are in Supplementary Table S6. D, Frequency of KRAS alleles identified. E, OncoPrint illustrating KRAS-mutant PDACs with mutations in genes also associated with increased ERK signaling. F, OncoPrint illustrating driver gene alterations found in KRAS WT PDACs. G, Image of resection specimen MPAM09 sampled at four independent regions. H, Phylogeny of MPAM09 indicating a truncal KRAS mutation and a subtruncal NF1 inactivating mutation. I, Overlay of phylogeny onto sample site from MPAM09. Sample PT4 was found to have no tumor cells. (Created with BioRender.com.)
Figure 3.
Figure 3.
CNAs within multiregion cohort as determined by HATCHet. A, Genome wide frequency of CNAs in the cohort. Copy-number gains and losses are indicated in red and blue respectively. Clonal CNAs are shown in darker and subclonal CNAs in lighter shades of their respective colors. Genomic regions containing known driver mutations are indicated. B, CNAs for seven major driver genes in PDAC, stratified by ploidy status. C, Percent of genome wide copy-number loss events that are clonal vs. subclonal in origin. D, Percent of genome wide copy-number gain events that are clonal vs. subclonal in origin. E, Relationship of clonal/subclonal loss events to ploidy. F, Relationship of clonal/subclonal gain events to ploidy. *, P < 0.05; ***, P < 0.001. (Created with BioRender.com.)
Figure 4.
Figure 4.
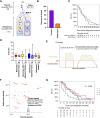
Timing of somatic alterations in PDAC as determined by DeCiFer. A, Schematic illustrating timing of occurrence of truncal vs. subtruncal somatic nucleotide variants (SNV) and their role in determining CCF of truncal mutations (occur prior to MRCA) vs. descendent cell fraction (DCF) of subtruncal mutations (occur after MRCA). B, Proportion of SNVs determined to be truncal vs. subtruncal in PDACs in current cohort. C, Kaplan–Meier survival curve illustrating no OS difference in PDACs with 0–2 vs. >2 truncal driver gene alterations. D, Box plot illustrating the median number of truncal and subtruncal drivers in the four clinical categories represented in the cohort. No differences in the number of truncal or subtruncal drivers were found. E, Schematic illustrating the method for how (sub)truncal densities are derived from sequencing data. F, Scatterplot illustrating the relationship of truncal density to subtruncal density for each patient in which it could be derived. Subtruncal densities are larger than truncal densities. No correlation between the number of samples sequenced per patient and (sub)truncal densities were found nor were differences found between the four clinical categories represented within the dataset. Red arrows indicate PDACs with mutations in DNA damage or mismatch repair genes. See also Supplementary Table S11. G, Kaplan–Meier survival curve based on quartiles of truncal density. The highest quartile of truncal density (#4, green line) is significantly correlated with worse OS. GL, germline. (Created with BioRender.com.)
Figure 5.
Figure 5.
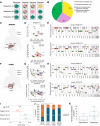
Subclonal copy-number events define PDAC subclones. A, Schematic of possible clonal compositions of PDAC progressive disease. Unlike monoclonal PDACs, polyclonal PDACs may be mixtures of clones within the same site or different sites. B, Proportion of patients with polyclonal or monoclonal metastases. C, Anatomical locations of discrete metastases used for bulk DNA sequencing from patient MPAM01. D, Inferred copy-number states for clones identified in MPAM01. Each point represents a genomic bin whose position corresponds to its inferred mirrored haplotype B-allele frequency (BAF; x-axis) and fractional copy number (y-axis) seen in E. F, Anatomical locations of discrete metastases used for bulk DNA sequencing from patient PAM01. G, Inferred copy-number states for clones identified in PAM01. Each point represents a genomic bin whose position corresponds to its inferred mirrored haplotype BAF (x-axis) and fractional copy number (y-axis) seen in H. In H, points labeled a, b denote the corresponding haplotype-specific copy-number state with “a” indicating copies of the major haplotype and “b” indicating copies of the minor haplotype. I, Multivariate analysis illustrating the odds of having polyclonal disease in relation to age, stage, and prior treatment. J, Proportion of patients with monoclonal vs. polyclonal disease, categorized by four clinical scenarios of management of patients with PDAC. *, P < 0.05; ***; P < 0.001. K, Number of metastatic samples found to have monoclonal vs. polyclonal compositions. Dx, diagnosis (Created with BioRender.com.)
Figure 6.
Figure 6.
Genetic features of patients with oligometastatic disease. Shown are the comparisons of the total number of driver gene mutations (A), the prevalence of LOH and copy-number gain events (B) and the proportions of mono- vs. polyclonal disease (C) identified in oligometastatic PDACs compared with non-oligometastatic PDACs. *, P < 0.05; ***, P < 0.001; ns, nonsignificant.
Figure 7.
Figure 7.
Schematic illustration of truncal density, a novel biomarker of PDAC prognosis. Two identical phylogenies are shown with colored circles indicating distinct clonal populations defined by copy-number states. The location of the MRCA within the evolutionary life history of each PDAC is also shown. Truncal mutations (blue x) are those that occur at any time in the cell lineage spanning oocyte fertilization to the MRCA of the neoplasm, whereas subtruncal mutations (red x) occur on shared or private branches corresponding to distinct subclones. Patients with high truncal densities (fourth quartile) were found to have poor prognosis in a multivariate analysis after controlling for age, stage at diagnosis, and smoking history. (Created with BioRender.com.)

References

    1. Waddell N, Pajic M, Patch A-M, Chang DK, Kassahn KS, Bailey P, et al. . Whole genomes redefine the mutational landscape of pancreatic cancer. Nature 2015;518:495–501. - PMC - PubMed
    1. Bailey P, Chang DK, Nones K, Johns AL, Patch AM, Gingras MC, et al. . Genomic analyses identify molecular subtypes of pancreatic cancer. Nature 2016;531:47–52. - PubMed
    1. Notta F, Chan-Seng-Yue M, Lemire M, Li Y, Wilson GW, Connor AA, et al. . A renewed model of pancreatic cancer evolution based on genomic rearrangement patterns. Nature 2016;538:378–82. - PMC - PubMed
    1. Raphael BJ, Hruban RH, Aguirre AJ, Moffitt RA, Yeh JJ, Stewart C, et al. . Integrated genomic characterization of pancreatic ductal adenocarcinoma. Cancer Cell 2017;32:185–203.e13. - PMC - PubMed
    1. Gerstung M, Jolly C, Leshchiner I, Dentro SC, Gonzalez S, Rosebrock D, et al. . The evolutionary history of 2,658 cancers. Nature 2020;578:122–8. - PMC - PubMed

MeSH terms

Substances