. 2024 Oct 15;121(42):e2323052121.
doi: 10.1073/pnas.2323052121. Epub 2024 Oct 8.

Injury-induced myosin-specific tissue-resident memory T cells drive immune checkpoint inhibitor myocarditis

Affiliations

Injury-induced myosin-specific tissue-resident memory T cells drive immune checkpoint inhibitor myocarditis

Hannah Kalinoski et al. Proc Natl Acad Sci U S A. .

Abstract

Cardiac myosin-specific (MyHC) T cells drive the disease pathogenesis of immune checkpoint inhibitor-associated myocarditis (ICI-myocarditis). To determine whether MyHC T cells are tissue-resident memory T (TRM) cells, we characterized cardiac TRM cells in naive mice and established that they have a distinct phenotypic and transcriptional profile that can be defined by their upregulation of CD69, PD-1, and CXCR6. We then investigated the effects of cardiac injury through a modified experimental autoimmune myocarditis mouse model and an ischemia-reperfusion injury mouse model and determined that cardiac inflammation induces the recruitment of autoreactive MyHC TRM cells, which coexpress PD-1 and CD69. To investigate whether the recruited MyHC TRM cells could increase susceptibility to ICI-myocarditis, we developed a two-hit ICI-myocarditis mouse model where cardiac injury was induced, mice were allowed to recover, and then were treated with anti-PD-1 antibodies. We determined that mice who recover from cardiac injury are more susceptible to ICI-myocarditis development. We found that murine and human TRM cells share a similar location in the heart and aggregate along the perimyocardium. We phenotyped cells obtained from pericardial fluid from patients diagnosed with dilated cardiomyopathy and ischemic cardiomyopathy and established that pericardial T cells are predominantly CD69+ TRM cells that up-regulate PD-1. Finally, we determined that human pericardial macrophages produce IL-15, which supports and maintains pericardial TRM cells.

Keywords: ICI-myocarditis; PD-1; cardiac immunology; tissue-resident memory T cells.


Conflict of interest statement

Competing interests statement:Dr. Čiháková has research grants with CSL Behring and Cantargia. Neither grant conflicts with this project.

Figures

Fig. 1.
Fig. 1.
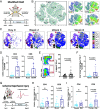
CD69 and PD-1 expression distinguishes cardiac TRM cells from circulating T cells. (A) Graphical depiction of the intravascular labeling technique. (B) Gating strategy for determining infiltrating and resident T cells. (CG) Comparing the expression of CD69, PD-1, and cardiac myosin tetramer in infiltrating (CD45IV+) and resident (CD45IV) cardiac T cells. (H) Determining the proportion of regulatory T cells (Tregs) compared to all resident myosin-specific T cells. (I) Determining the proportion of Tregs and conventional T cells (Tconv) from all resident MyHC+ T cells. Naive A/J male, female, young (10 wk), and aged (40 wk) mice were included in this analysis. Group size was n = 17. Statistical significance was determined through a paired t test.
Fig. 2.
Fig. 2.
Cardiac CD69+ TRM cells are transcriptionally distinct from circulating T cells. (A) Peripheral and resident cardiac T cells were isolated from naive A/J mice and FACS sorted into distinct TN, TCM, TEM, and TRM cell populations. Graphs depict the Ct values as a ratio over the housekeeping gene Gapdh, meaning that lower ratios depict higher expression levels. n = 3 or 4 with each n representing 4 to 5 mice that were pooled together. Aged (46 wk) retired male and female breeders were used for pooling. Statistical significance was determined through a one-way Brown–Forsythe and Welch ANOVA. A t test was used to determine the significance of Pmp2 expression. (B) Uniform Manifold Approximation and Projection (UMAP) clustering of cardiac T cells. (C) Feature plots showing gene expression of Cd69, Pdcd1, Cxcr6, and S1pr1 in the various T cell clusters. (D) Bubble plot showing genes differentially expressed by distinct cardiac T cell populations. Statistical significance was assessed by a Wilcoxon signed-rank test. (E) Graphical depiction of the significantly up-regulated genes by each cardiac T cell subcluster.
Fig. 3.
Fig. 3.
Cardiac injury induces autoreactive cardiac CD69+PD-1+ TRM cells. (A) Graphical description of mEAM mouse model timeline. (B) A/J mice from all groups were concatenated into a single file before unsupervised t-SNE clustering was performed on the cardiac CD4+ T cells. T-SNE clusters were assigned conventional T cell populations based on the expression of CD62L, CD44, KLRG1, and CD69. Infiltrating T cells (CD45IV) and resident immune T cells (CD45R) were labeled. Heat map illustrating the expression of the core TRM cell genes CD69, CD44, PD-1, and CXCR6. The experiment has a total of n = 12. (C) Time course of mEAM showing the distribution of CD4+ T cells on weeks 0, 2, 3, and 8. (D) mEAM was induced in A/J mice, and after 8 wk, the number of TRM cells was assessed by flow cytometry. Quantifying the proportion of CD4+ and CD8+ TRM cells after mEAM compared to naive A/J mice. Group size was n = 9 or 10 mice. Statistical significance was determined through a Welch t test. (E) Representative flow graph showing expression of PD-1 and TCR specificity for cardiac myosin on resident CD69 and CD69+ CD4+ T cells. Both naive mice and mEAM mice were included in this analysis. Group size was n = 19. Statistical significance was determined through a paired t test. (F) Graph quantifying the proportion of autoreactive myosin-specific CD69+PD-1+CD4+ TRM cells after mEAM. Group size was n = 9 or 10 mice. Statistical significance was determined through a Welch t test. (G) Graphical description of I/R mouse model timeline. (H) I/R injury was induced in male A/J mice; after 8 wk, the number of TRM cells was assessed by flow cytometry. Quantifying the proportion of CD4+ and CD8+ TRM cells after I/R injury compared to A/J mice who received sham surgery. Group size was n = 9. Statistical significance was determined through a Welch t test. (I) Quantifying the proportion of CD4+ and CD8+ TRM cells in young mice (15 wk) to aged mice (53 wk). Group size was n = 13 or 11. Statistical significance was determined through a Welch t test.
Fig. 4.
Fig. 4.
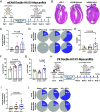
Cardiac injury causes accumulation of TRM cells along the perimyocardium. (A) Representative H&E histology of a mouse heart induced with mEAM. (B) Immunohistochemistry (IHC) showing the distribution of CD3+ T cells on representative histology of murine atria, myocardium, and pericardium in naive mice or mice who have recovered from mEAM. (C) IHC showing staining of CD3, PD-1, Runx3, and CXCR6 on representative histology from mice who recovered from mEAM.
Fig. 5.
Fig. 5.
Previous cardiac injury increases the susceptibility of mice to develop ICI-myocarditis. (A) Graphical description of ICI-myocarditis mouse model where cardiac TRM cells were induced in A/J mice through mEAM. (B) Representative H&E histology of mice hearts, where mice received αPD-1, EAM+Isotype, or EAM + αPD-1. (C) Histological assessment was used to determine the severity of myocarditis in mice. Group size was n = 8 or 9. Statistical significance was determined by the Kruskal–Wallis test. (D) Pie charts showing the incidence of atrial and ventricular myocarditis between. (EG) Bar graphs showing the proportion of cardiac leukocytes, CD3+ T cells, and CD8+ T cells as determined by flow cytometry. Group size was n = 8 or 9. Statistical significance was determined by the Brown–Forsythe and Welch ANOVA test. (H) Graphical description of ICI-myocarditis mouse model where cardiac TRM cells are induced by I/R injury in male A/J mice. (I) Histological assessment was used to determine the severity of myocarditis in mice. Group size was n = 9, 11, or 12. Statistical significance was determined by the Kruskal–Wallis test. (J) Pie charts showing the incidence of atrial and ventricular myocarditis.
Fig. 6.
Fig. 6.
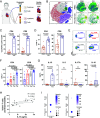
Human pericardial fluid is enriched with CD69+PD-1+ TRM cells. (A) Graphical depiction of deidentified human patient samples received from the biorepository at the Institute for Clinical and Experimental Medicine (IKEM). Samples were collected from patients diagnosed with either dilated cardiomyopathy (DCM) or ischemic cardiomyopathy (iCMP). (B) Patient PBMCs and pericardial cells concatenated into a single file before unsupervised t-SNE clustering was performed on the CD4+ T cells. Heat mapping illustrating CD69 and PD-1 expression on CD4+ T cells from patient PBMCs and pericardial cells. (C and D) Expression of CD69 and PD-1 on CD4+ and CD8+ T cells on patient PBMCs and pericardial cells. Group size was n = 14. Statistical significance was determined by the Wilcoxon test. (E) Representative flow plots showing the expression of PD-1 on TN, TCM, TEM, and TRM pericardial CD4+ T cells. (F) Expression of PD-1 on different pericardial T cell populations. Group size was n = 14. Statistical significance was determined by the RM one-way ANOVA. (G) Comparing the concentrations of cytokines in human pericardial fluid compared to matched patient plasma. Group size was n = 10. Statistical significance was determined by the Wilcoxon test. (H) Simple linear regression analysis comparing the pericardial fluid concentration of IL-15 to the proportion of CD3+ T cells (from lineage gate). Group size was n = 14. (I) Bubble plot showing gene expression of IL-15 and IL-10 by pericardial macrophages and NK and T cells.

References

    1. Freeman G. J., et al. , Engagement of the Pd-1 immunoinhibitory receptor by a novel B7 family member leads to negative regulation of lymphocyte activation. J. Exp. Med. 192, 1027–1034 (2000). - PMC - PubMed
    1. Chambers C. A., Sullivan T. J., Allison J. P., Lymphoproliferation in CTLA-4–deficient mice is mediated by costimulation-dependent activation of CD4+ T cells Immunity 7, 885–895 (1997). - PubMed
    1. Ueda H., et al. , Association of the T-cell regulatory gene CTLA4 with susceptibility to autoimmune disease. Nature 423, 506–511 (2003). - PubMed
    1. Nishimura H., Minato N., Nakano T., Honjo T., Immunological studies on PD-1 deficient mice: Implication of PD-1 as a negative regulator for B cell responses. Int. Immunol. 10, 1563–1572 (1998). - PubMed
    1. Martins F., et al. , Adverse effects of immune-checkpoint inhibitors: Epidemiology, management and surveillance. Nat. Rev. Clin. Oncol. 16, 563–580 (2019). - PubMed

MeSH terms

LinkOut - more resources