. 2024 Oct 15;121(42):e2319246121.
doi: 10.1073/pnas.2319246121. Epub 2024 Oct 8.

HCN1 hyperpolarization-activated cyclic nucleotide-gated channels enhance evoked GABA release from parvalbumin-positive interneurons

Affiliations

HCN1 hyperpolarization-activated cyclic nucleotide-gated channels enhance evoked GABA release from parvalbumin-positive interneurons

Eric W Buss et al. Proc Natl Acad Sci U S A. .

Abstract

Hyperpolarization-activated, cyclic nucleotide-gated (HCN) channels generate the cationic Ih current in neurons and regulate the excitability of neuronal networks. The function of HCN channels depends, in part, on their subcellular localization. Of the four HCN isoforms (HCN1-4), HCN1 is strongly expressed in the dendrites of pyramidal neurons (PNs) in hippocampal area CA1 but also in presynaptic terminals of parvalbumin-positive interneurons (PV+ INs), which provide strong inhibitory control over hippocampal activity. Yet, little is known about how HCN1 channels in these cells regulate the evoked release of the inhibitory transmitter GABA from their axon terminals. Here, we used genetic, optogenetic, electrophysiological, and imaging techniques to investigate how the electrophysiological properties of PV+ INs are regulated by HCN1, including how HCN1 activity at presynaptic terminals regulates the release of GABA onto PNs in CA1. We found that application of HCN1 pharmacological blockers reduced the amplitude of the inhibitory postsynaptic potential recorded from CA1 PNs in response to selective optogenetic stimulation of PV+ INs. Homozygous HCN1 knockout mice also show reduced IPSCs in postsynaptic cells. Finally, two-photon imaging using genetically encoded fluorescent calcium indicators revealed that HCN1 blockers reduced the probability that an extracellular electrical stimulating pulse evoked a Ca2+ response in individual PV+ IN presynaptic boutons. Taken together, our results show that HCN1 channels in the axon terminals of PV+ interneurons facilitate GABAergic transmission in the hippocampal CA1 region.

Keywords: HCN channel; hippocampus; interneuron; parvalbumin; synapse.


Conflict of interest statement

Competing interests statement:The authors declare no competing interest.

Figures
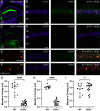
Fig. 1.
Fig. 1.
Confocal images of double and triple immunofluorescence staining in the hippocampus. (A) Low-magnification overlay image of dual staining for synaptotagmin 2 (SYT 2, purple) and HCN1 (green) of the entire hippocampus. The scale bar represents 400 µm. (B) High-magnification images of area CA1, showing stratum oriens (SO), stratum pyramidale (SP), and stratum radiatum (SR); Left: stained for synaptotagmin 2 (SYT2, purple); Middle: stained for HCN1 (green); Right: overlay of the two stainings (colocalization shown in white). The scale bar represents 50 µm. (C) Low-magnification overlay image of dual staining for synaptotagmin 2 (SYT 2, purple) and HCN2 (green) of the entire hippocampus. The scale bar represents 400 µm. (D) High-magnification images of area CA1, showing SO, SP, and stratum radiatum (SR); Left: stained for synaptotagmin 2 (SYT2, purple); Middle: stained for HCN2 (green); Right: overlay of the two stainings (colocalization shown in white). Note: The cell soma, visible in the HCN2 labeling, is a putative oligodendrocyte. The scale bar represents 50 µm. (E) High-magnification images of area CA1 of a wild-type mouse, showing SP; far Left: stained for parvalbumin (PV, orange); Middle Left: stained for HCN1 (green); Middle Right: overlay of the PV and HCN1 stainings; far Right: overlay of the three stainings for PV, HCN1, and synaptotagmin 2 (SYT2, purple, three-way colocalization shown in white). The scale bar represents 50 µm. (F) Same as (E), but images are taken from a HCN1 knockout mouse. (G) Mander’s overlay coefficient of HCN1 and PV in SP of CA1 in the wild-type (WT) and HCN1 knockout mice. n = 12 slices from 2 mice for WT and 20 slices from 3 animals from Hcn1−/−, P < 0.0001 with the unpaired t test. (H) Mander’s overlay coefficient of HCN1 and SYT 2 in the same images as (G). P < 0.0001 with the unpaired t test. (I) Mander’s overlay coefficient of PV and SYT 2 in the same images as (G). P = 0.45 with the unpaired t test.
Fig. 2.
Fig. 2.
Confocal images of HCN and PV labeling in wild-type and conditional PV+ In-HCN1 knockout mice. (A) Low-magnification image, showing HCN1 labeling (green) throughout the hippocampus in wild-type (Left) and PV+-IN-specific HCN1 knockout mouse (Right). SP: stratum pyramidale, SR: stratum radiatum, SLM: stratum lacunosum moleculare. The white arrow shows the area at high magnification in panel B. The scale bar represents 400 µm. (B) Top: High-magnification image, showing HCN1 labeling (green) in SP of CA1 in wild-type (WT, Left) and PV+-IN-specific conditional HCN1 knockout (cKO, Right) mice. The scale bar represents 50 µm. Middle: Parvalbumin (PV) labeling (purple) in the same images as seen on the Top. Bottom: Merge of the Middle and Top images. Colocalization of HCN1 and PV labeling can be seen in white. (C) Average fluorescence of immunostaining for the HCN1 channel, using the PV fluorescence as a mask, normalized by HCN1 fluorescence in SLM for each slice (n = 8 slices of 2 WT mice and 9 slices of 3 cKO mice, P < 0.0001 with the unpaired t test).
Fig. 3.
Fig. 3.
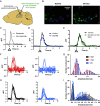
Impact of HCN channel block on somatic properties of PV+ INs. (A) Confocal section of parvalbumin immunofluorescence staining and tdTomato expression in PV-Cre mice crossed to the tdTomato reporter line. The scale bar represents 200 µm. (B) Example voltage traces from two cells in response to a series of hyperpolarizing current steps ranging from 0 to −175 pA (in steps of −25 pA, upper traces) and to a single +250 pA depolarizing current step (lower traces). Top traces are from a cell exhibiting no voltage sag during hyperpolarization. Bottom traces are from a cell exhibiting voltage sag. Voltage responses shown before (black/red traces) and during (blue/pink traces) bath application of ZD7288. (CF) Summary graphs of the effects of ZD 7288 (before: black/red; after: blue/pink) on indicated passive membrane parameters, for “sag” and “non-sag” cells. (G) AP firing frequency in response to positive current steps (F–I curve) before (black/red) and after (blue/pink) ZD7288. (HJ) Summary graphs of the effects of ZD7288 (before: black/red; after: blue/pink) on action potential frequency at a stimulus current of 350 pA, AP threshold and average AP peak respectively, for sag (red controls) and non-sag (black controls) cells. For all panels, small circles show individual cells, large circles show means, error bars show standard error. (**** means P < 0.0001 with the paired t test after KS normality test.)
Fig. 4.
Fig. 4.
Block of HCN channels decreases IPSCs evoked by stimulation of PV+ INs. (A) (Left and Top) Schematic of voltage clamp recordings from CA1 PNs with a stimulating electrode in the pyramidal cell layer. (Bottom) Example trace of an IPSC evoked by a 35 V 0.2 ms extracellular stimulus before (back) and after (blue) ZD7288 (10 µM) application. Excitatory transmission was blocked with CNQX (25 µM) and D-APV (50 µM). QX-314 (5 mM) was used in the recording pipette to block postsynaptic HCN channels. (B) Amplitude of evoked IPSCs using extracellular electrical stimulation before (black) and after (blue) bath application of ZD7288. (C) (Top) Schematic of voltage clamp recordings from CA1 PNs optogenetically stimulating ChR2-expressing PV+ INs using blue light pulses (2 ms). (Left) neuron filled with biocytin in red and ChR2, expressed in PV INs in green. The scale bar represents 150 µm. (Bottom) Example trace of an IPSC, elicited by light pulse stimulation of PV+ IN axons before (back) and after (blue) ZD7288 (10 µM) application. QX-314 (5mM0 was used in the recording pipette to block postsynaptic HCN channels. (D) Light pulse stimulation of PV+ IN axons expressing ChR2 before (black) and after (blue) bath application of ZD7288. (**** means P < 0.0001 with the paired t test after KS normality test.)
Fig. 5.
Fig. 5.
The impact of HCN channel block on IPSCs is occluded in homozygous HCN1 knockout mice. (A) Evoked IPSCs using extracellular electrical stimulation before (black) and after (blue) bath application of ZD7288 in wild-type (Hcn1+/+) littermates of HCN1 KO mice. (B) Evoked IPSCs using extracellular electrical stimulation before (yellow) and after (blue) bath application of ZD7288 in heterozygous (Hcn1+/−) mice. (C) Evoked IPSCs using extracellular electrical stimulation before (red) and after (blue) bath application of ZD7288 in homozygous (Hcn1−/−) mice. (D) Comparison of the evoked IPSC amplitudes of wild-type (black), Hcn1+/−(yellow), and Hcn1−/− (red) mice before bath application ZD7288.(* means P < 0.05, ** means P < 0.01, and *** means P < 0.001; statistics in (AC) with the paired t test after KS normality test and statistics in (D) with one-way ANOVA with the Tukey multiple comparison test after KS normality test.)
Fig. 6.
Fig. 6.
HCN channel blockade increases paired-pulse ratio of IPSCs evoked by PV+ IN stimulation. (A) (Left) Schematic of voltage clamp recordings from CA1 PNs with a stimulating electrode in the pyramidal cell layer. (Right) Example trace of IPSCs in response to 20 Hz paired 35 V electrical pulse stimulation before (black) and after (blue) ZD7288 (10 µM) application. Excitatory transmission was blocked with CNQX (25 µM) and APV (50 µM). QX-314 (5 mM) was used in the recording pipette to block postsynaptic HCN channels. (B) Paired-pulse ratio (PPR) before (black) and after (blue) bath application of ZD7288 in response to 20 Hz extracellular electrical stimulation. (C) (Left) Schematic of voltage clamp recordings from CA1 PNs with optogenetic stimulation using blue (470 nm) light pulses (2 ms). (Right) Example trace of IPSCs in response to 20 Hz paired light pulse stimulation (blue triangles) before (black) and after (blue) ZD7288 (10 µM) application. QX-314 (5 mM) was used in the recording pipette to block postsynaptic HCN channels. (D) Paired-pulse ratio (PPR) before (black) and after (blue) bath application of ZD7288 in response to 20 Hz light stimulation of ChR2-expressing PV+ IN axon terminals. (E) PPR before (yellow) and after (blue) bath application of ZD7288 in response to 20 Hz extracellular electrical stimulation in Hcn1+/− mice. (F) PPR before (red) and after (blue) bath application of ZD7288 in response to 20 Hz extracellular electrical stimulation in Hcn1−/− mice.
Fig. 7.
Fig. 7.
Two-photon imaging of PV+ IN axon-specific GcaMP6s in acute brain slices. (A) Schematic representation of viral injection site of axon-GCaMP6s and the location of in vitro extracellular electrical stimulation. (B) Sample GCaMP6s fluorescence images of boutons before (Left) and during (Right) a stimulus response; active boutons are marked by pink circles. (C) ΔF/F of two example boutons in response to 5 pulses at 30-Hz extracellular electrical stimulation in the pyramidal cell layer of CA1 at t = 2 s; one bouton was classified as responding (black) and the other as nonresponding (gray). (D) Average ΔF/F of responding boutons before (black) and 10 min after (blue) start of ZD7288 application. (E) Average ΔF/F of responding boutons shortly (<2 min) after start of imaging (black) and 12 min later (green). (F) ΔF/F of example bouton in response to one single extracellular electrical stimulation in the pyramidal cell layer before (red) and after (blue) ZD7288 bath application. Individual traces represent repetitions of the stimulus. (G) Distribution of peak ΔF/F amplitudes in response to single extracellular electrical stimuli in the pyramidal cell layer (n = 135 stimuli in 15 boutons from 6 slices from 3 animals) before (red) and after (blue) ZD7288 bath application. Lines show best fits with two Gaussian components. (H) ΔF/F of example bouton in response to a 5-pulse train of extracellular electrical stimulation in the pyramidal cell layer at 30 Hz before (black) and after (blue) ZD7288 bath application. Individual traces represent repetitions of the pulse train. (I) Distribution of peak ΔF/F amplitudes in response to a 5-pulse train of extracellular electrical stimulation in the pyramidal cell layer at 30 Hz (n = 486 stimuli in 54 boutons from 8 slices from 4 animals) before (black) and after (blue) ZD7288 bath application. Lines show best fits with two Gaussian components.

References

    1. Pelkey K. A., et al. , Hippocampal GABAergic inhibitory interneurons. Physiol. Rev. 97, 1619–1747 (2017). - PMC - PubMed
    1. Klausberger T., Somogyi P., Neuronal diversity and temporal dynamics: The unity of hippocampal circuit operations. Science 321, 53–57 (2008). - PMC - PubMed
    1. Sun Y., et al. , Cell-type-specific circuit connectivity of hippocampal CA1 revealed through Cre-dependent rabies tracing. Cell Rep. 7, 269–280 (2014). - PMC - PubMed
    1. Chiu C. Q., et al. , Compartmentalization of GABAergic inhibition by dendritic spines. Science 340, 759–762 (2013). - PMC - PubMed
    1. Maccaferri G., Stratum oriens horizontal interneurone diversity and hippocampal network dynamics. J. Physiol. 562, 73–80 (2005). - PMC - PubMed

MeSH terms

Substances

LinkOut - more resources