. 2024 Oct 18;13(10):3295-3311.
doi: 10.1021/acssynbio.4c00395. Epub 2024 Oct 8.

Energy Aware Technology Mapping of Genetic Logic Circuits

Affiliations

Energy Aware Technology Mapping of Genetic Logic Circuits

Erik Kubaczka et al. ACS Synth Biol. .

Abstract

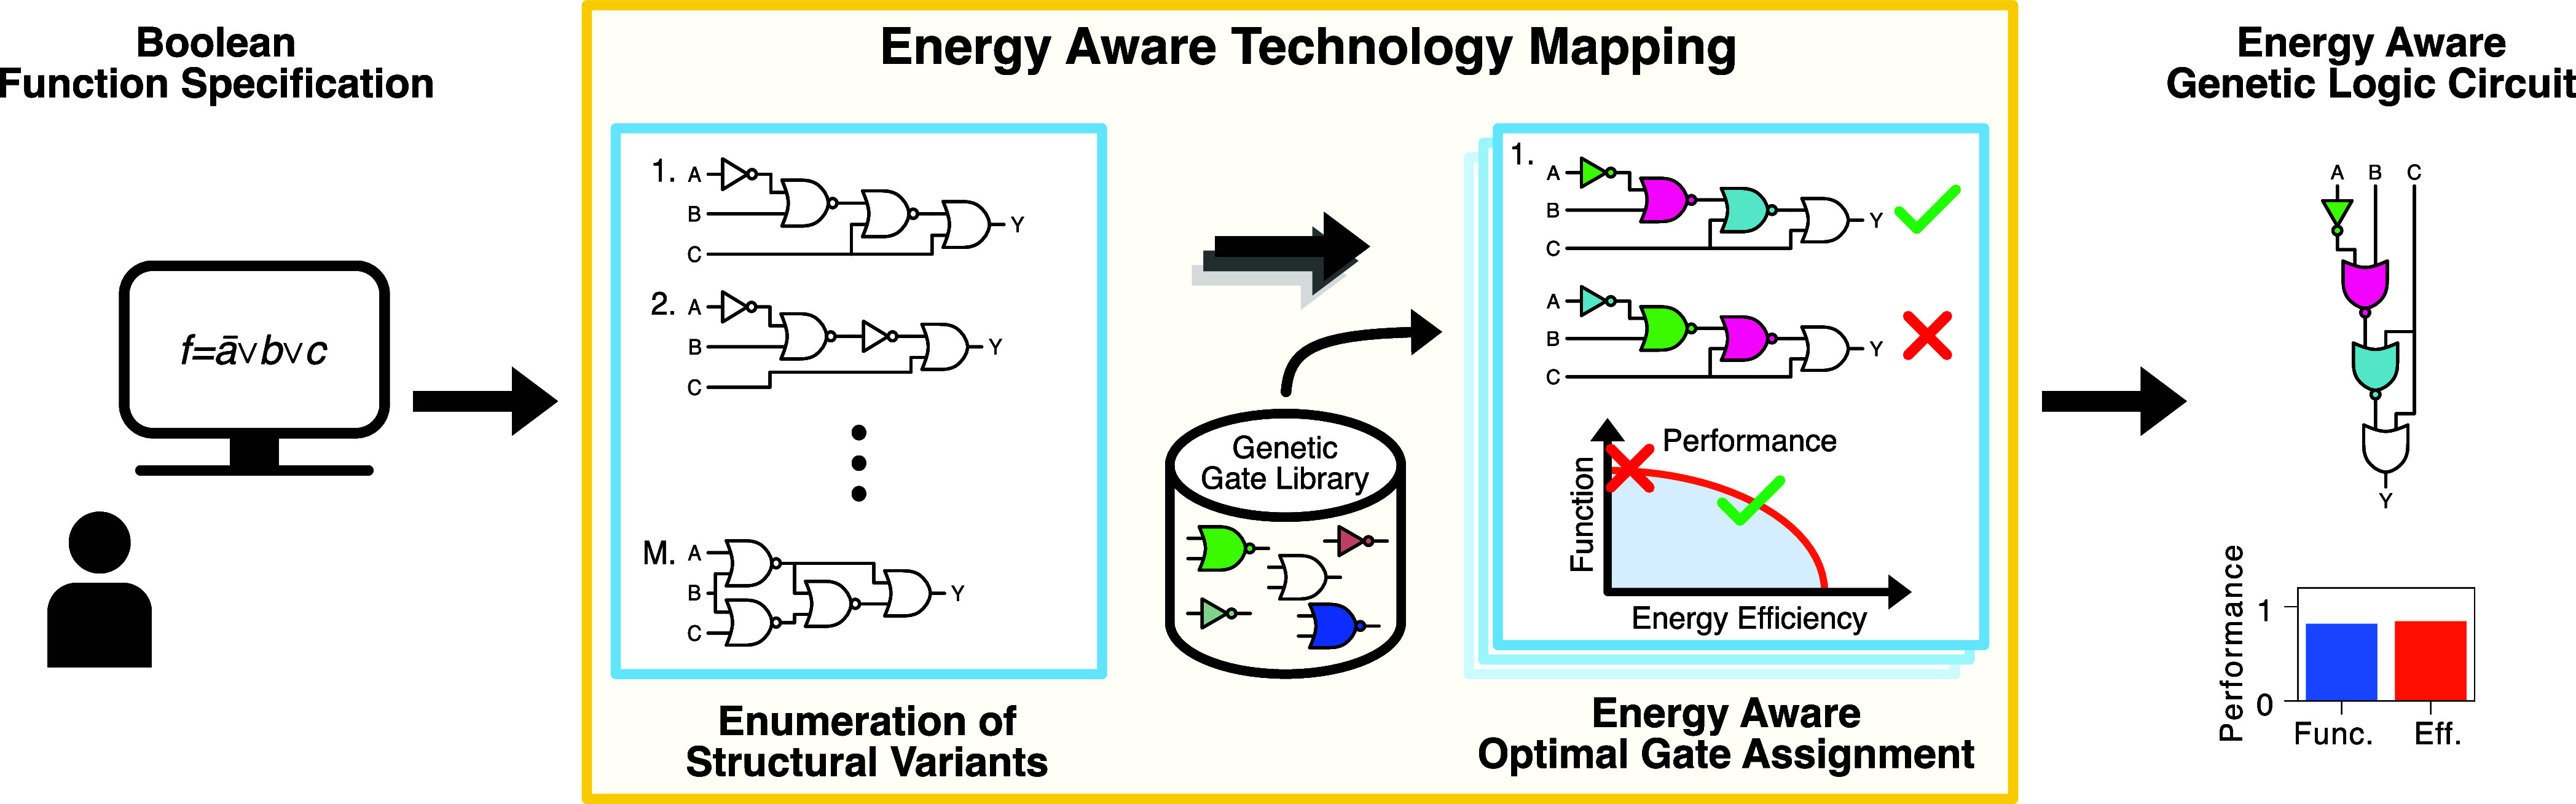
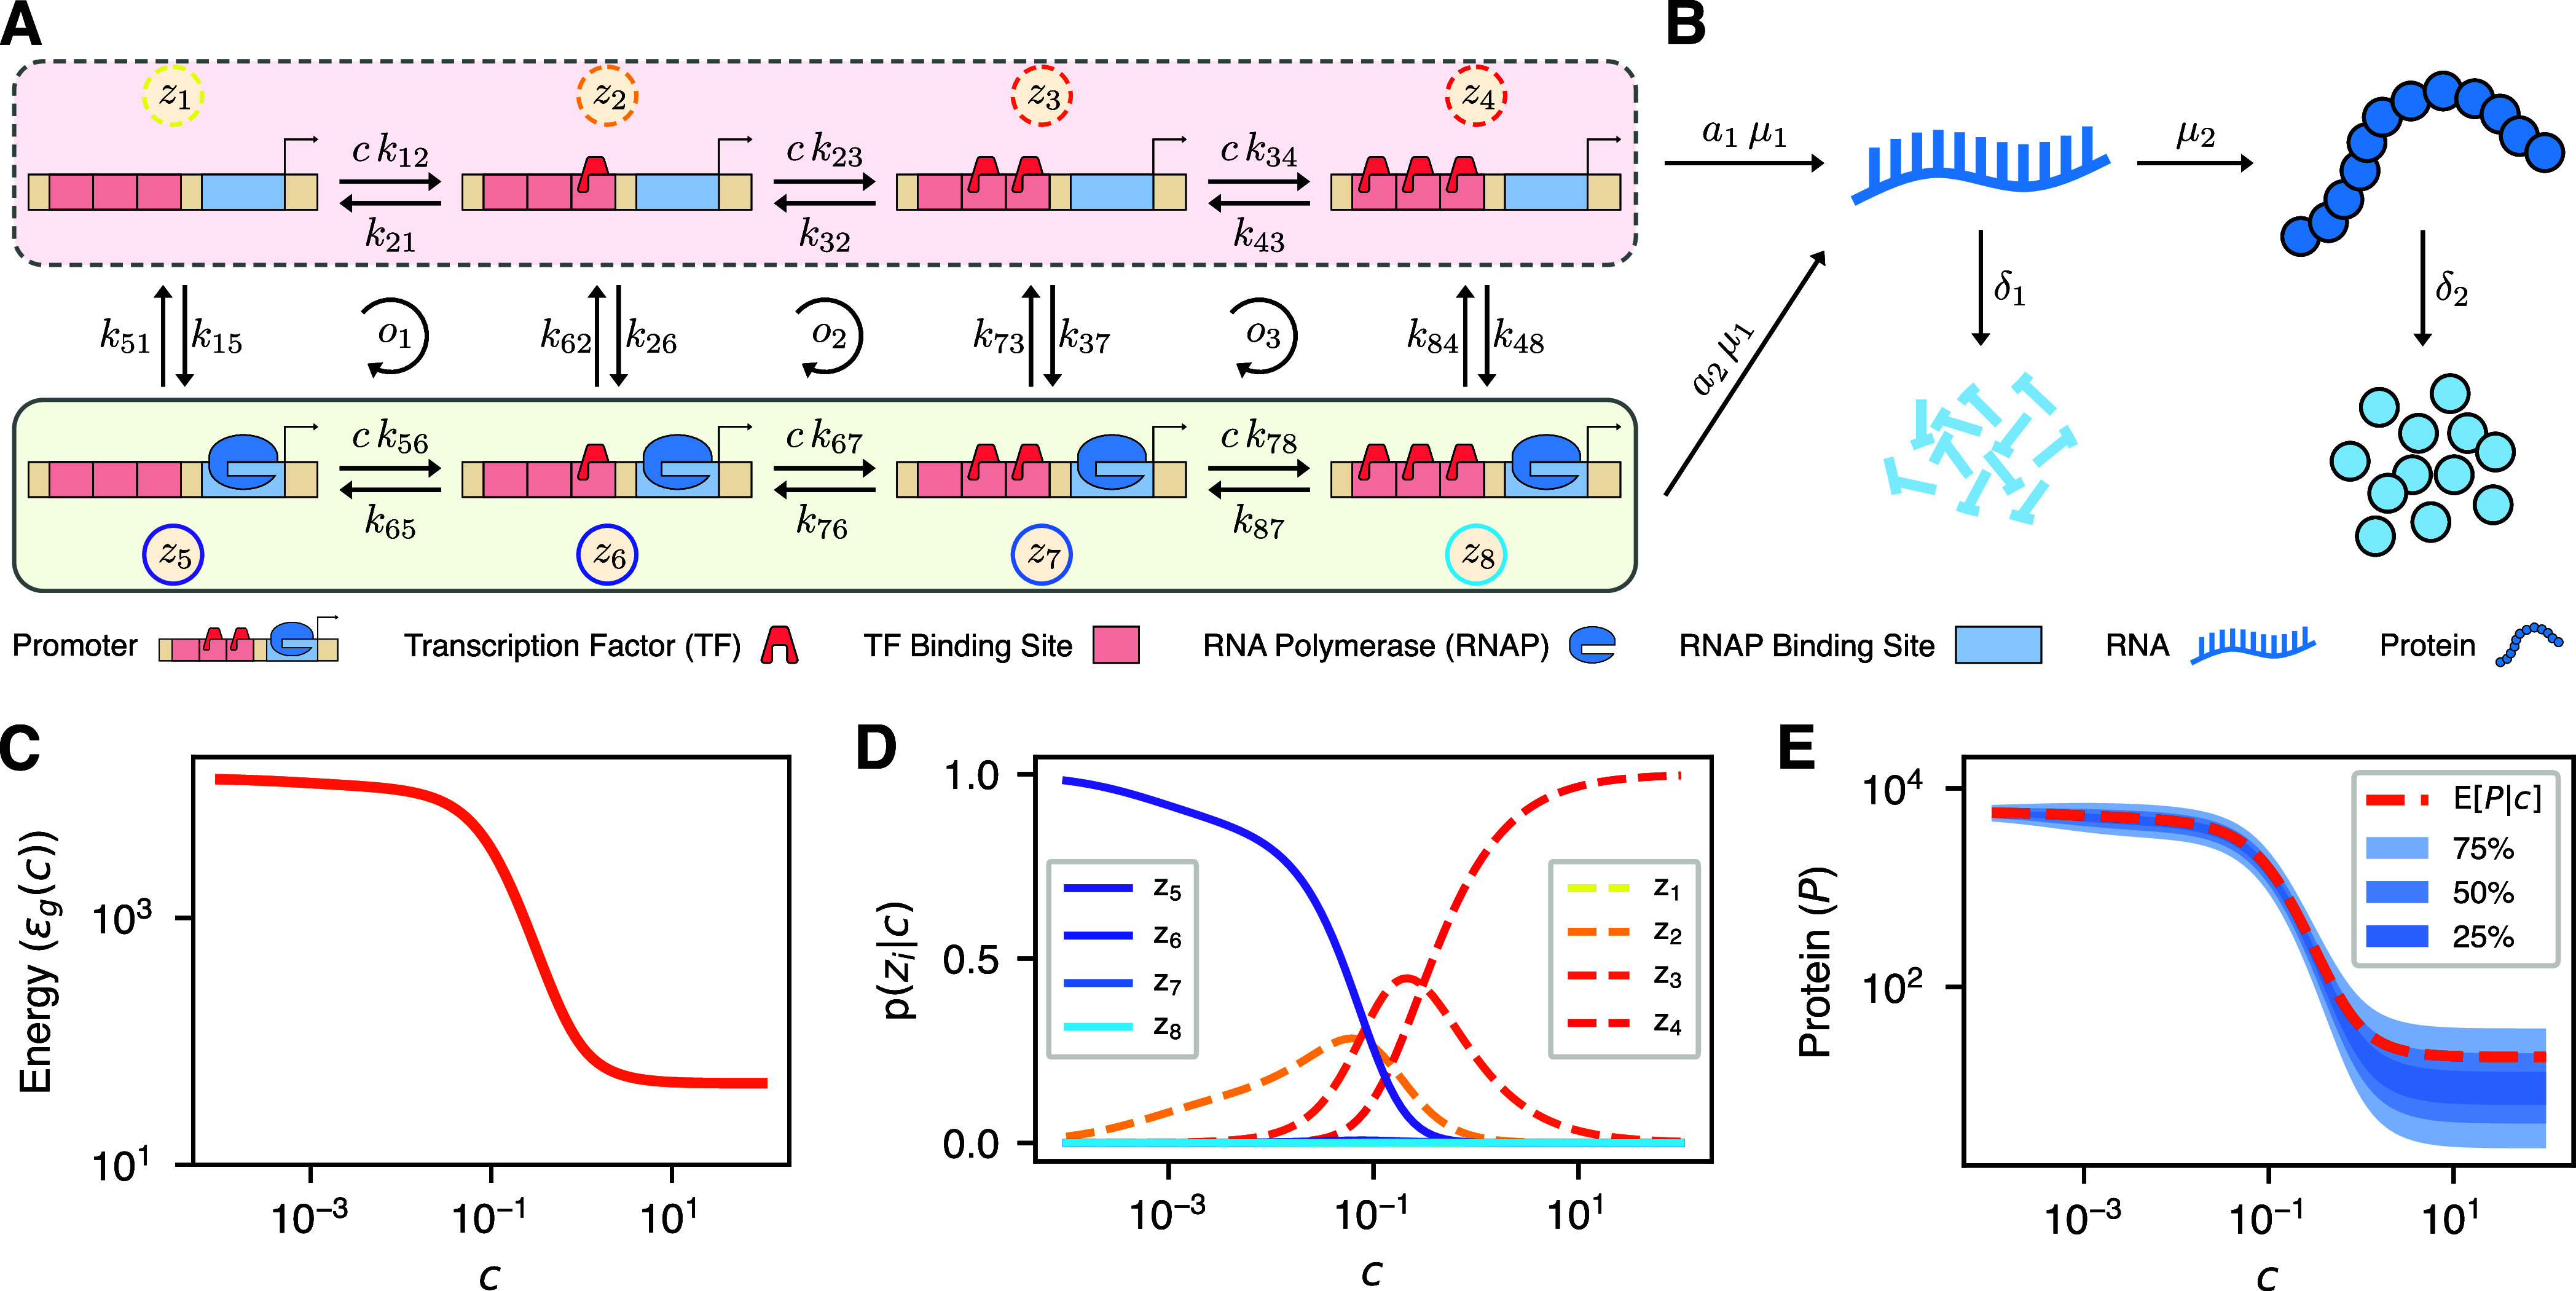
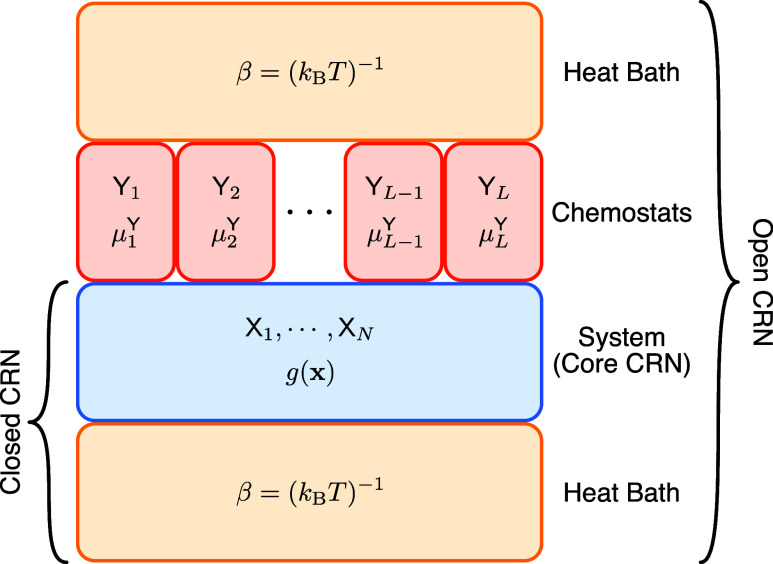
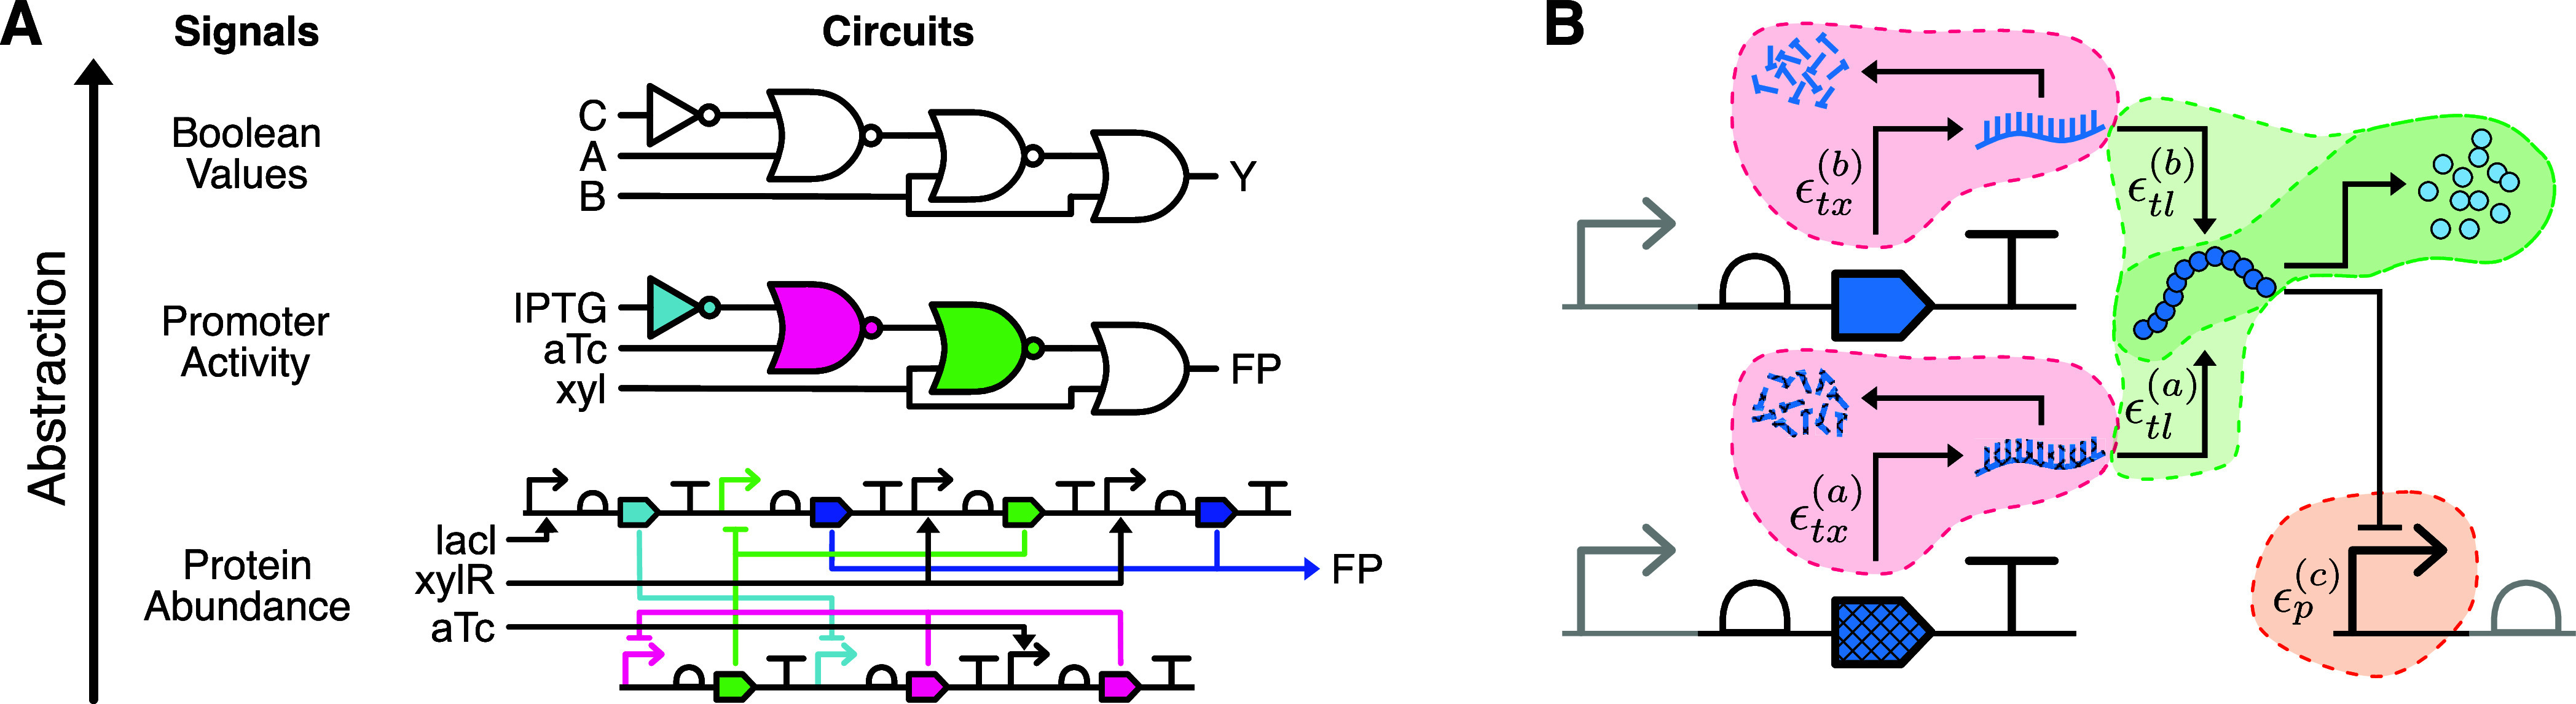
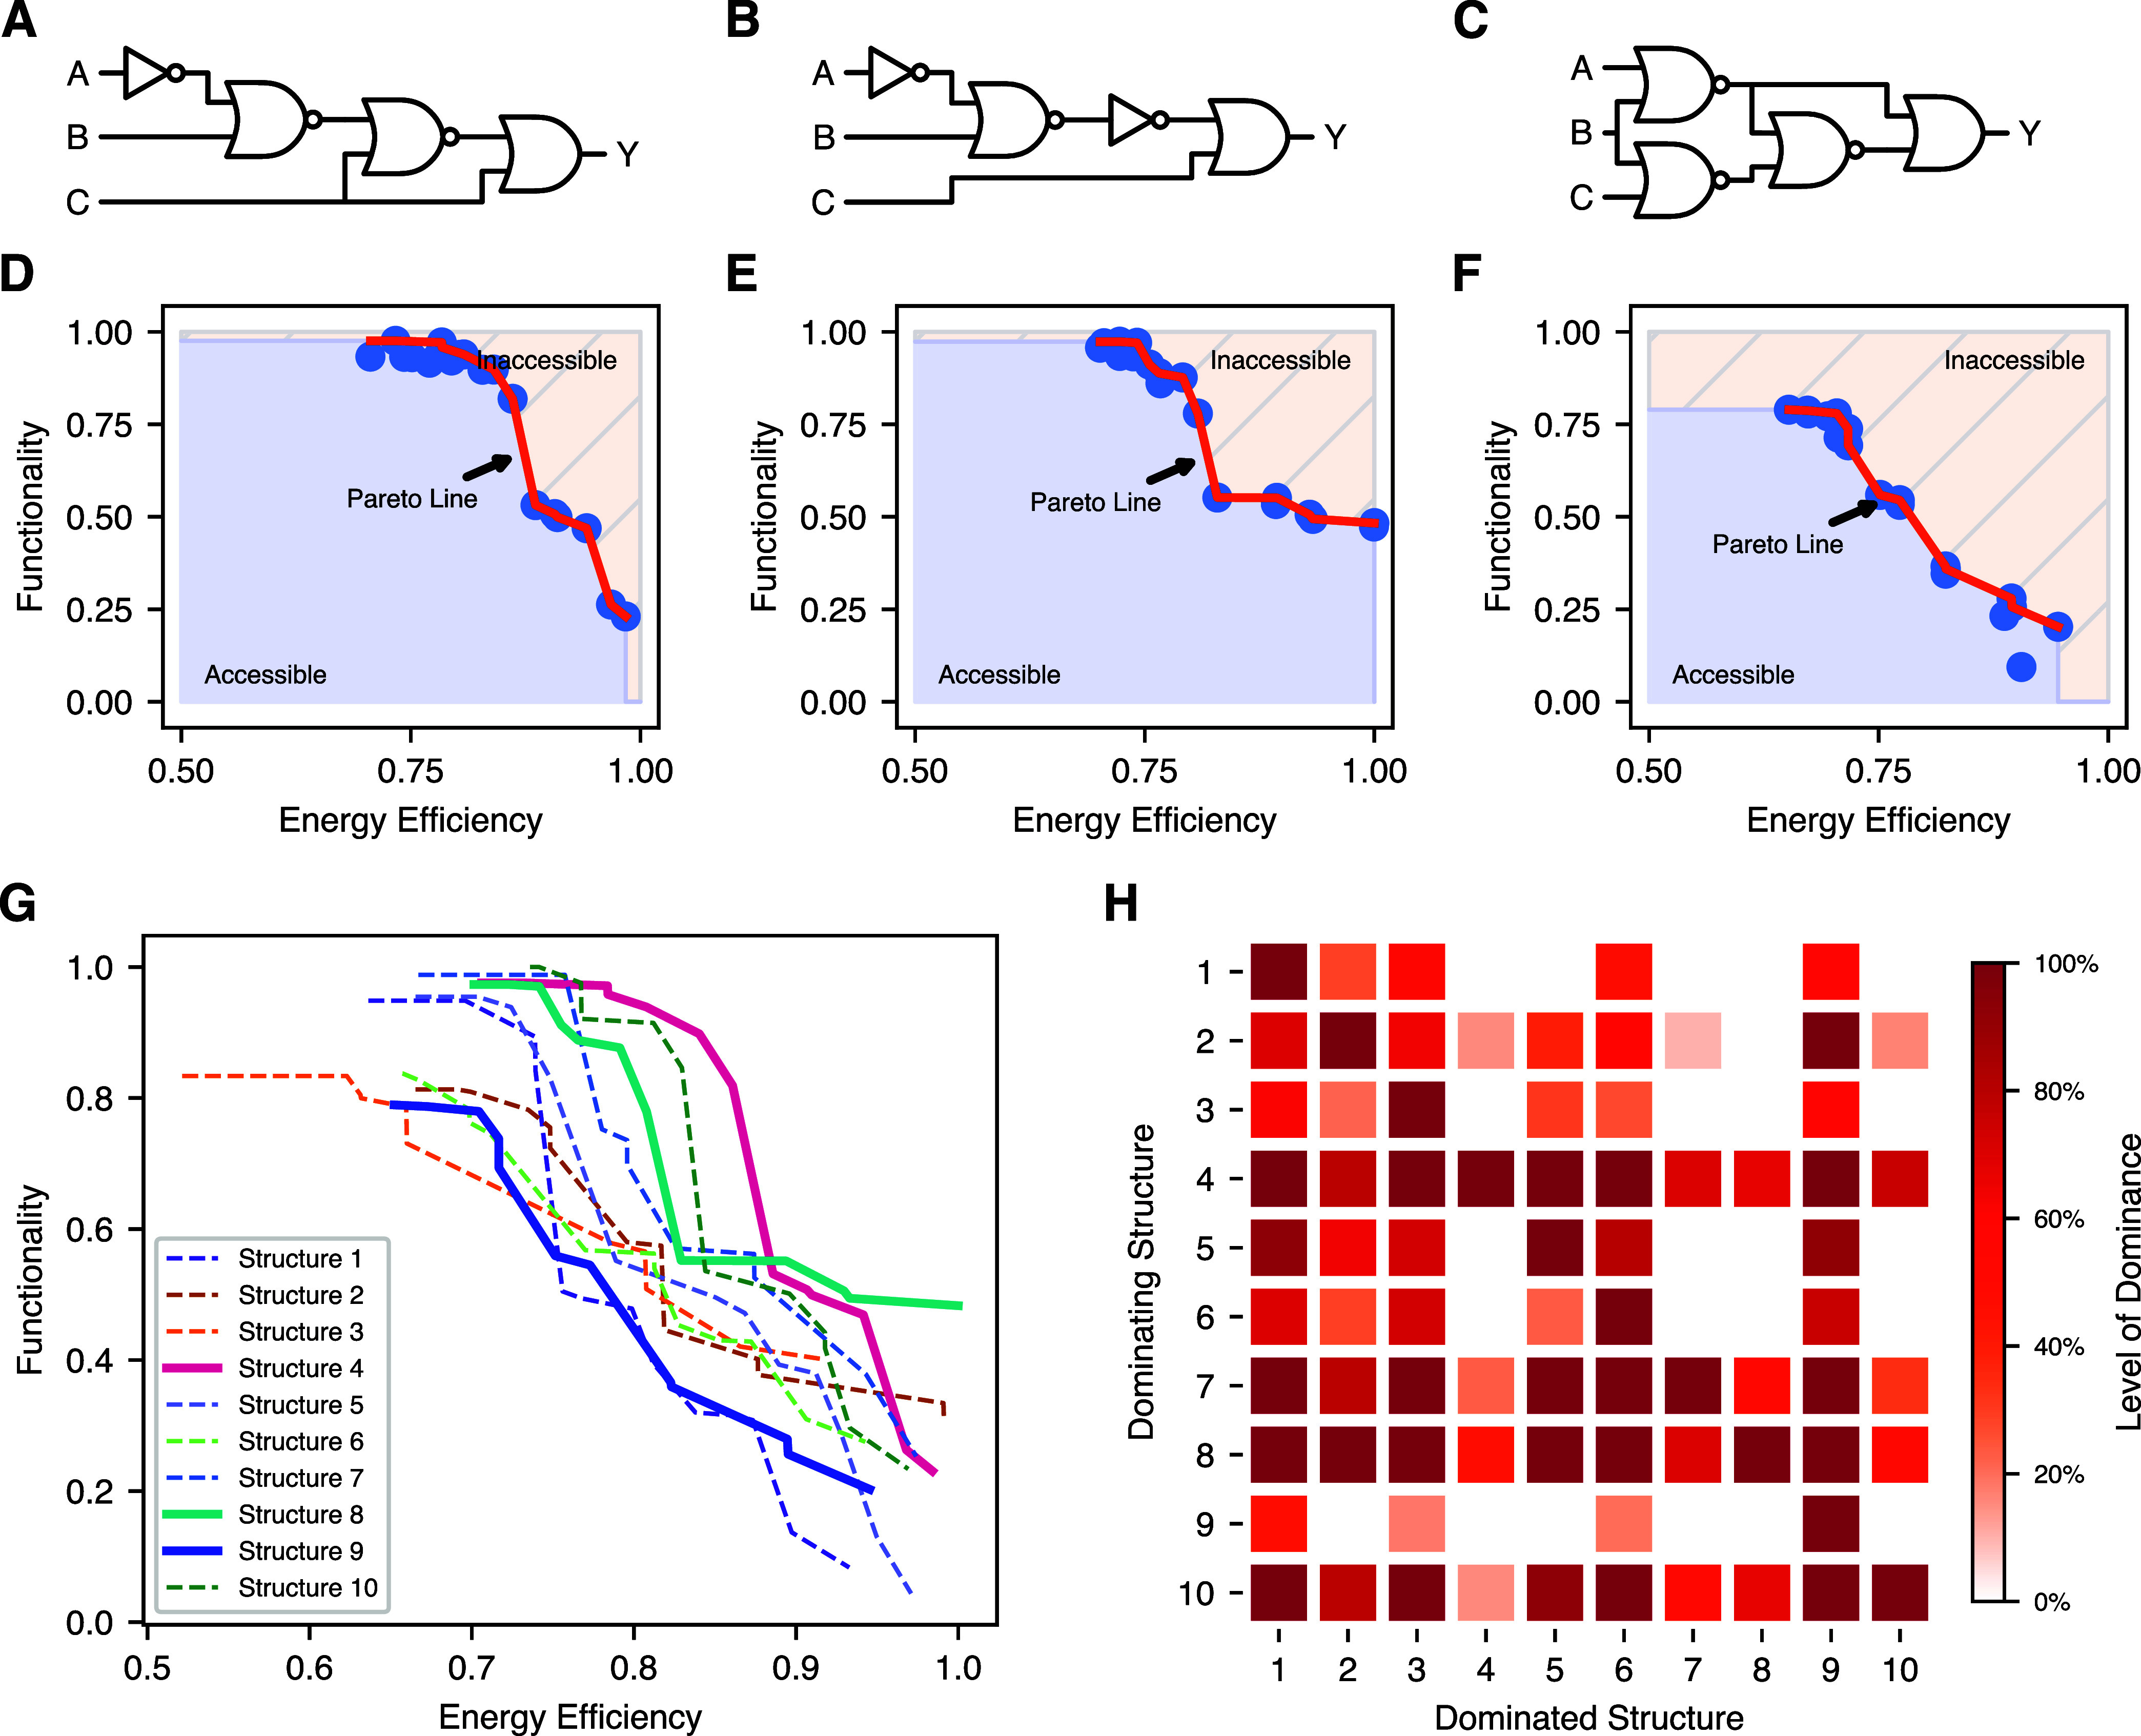
Energy and its dissipation are fundamental to all living systems, including cells. Insufficient abundance of energy carriers─as caused by the additional burden of artificial genetic circuits─shifts a cell's priority to survival, also impairing the functionality of the genetic circuit. Moreover, recent works have shown the importance of energy expenditure in information transmission. Despite living organisms being non-equilibrium systems, non-equilibrium models capable of accounting for energy dissipation and non-equilibrium response curves are not yet employed in genetic design automation (GDA) software. To this end, we introduce Energy Aware Technology Mapping, the automated design of genetic logic circuits with respect to energy efficiency and functionality. The basis for this is an energy aware non-equilibrium steady state model of gene expression, capturing characteristics like energy dissipation─which we link to the entropy production rate─and transcriptional bursting, relevant to eukaryotes as well as prokaryotes. Our evaluation shows that a genetic logic circuit's functional performance and energy efficiency are disjoint optimization goals. For our benchmark, energy efficiency improves by 37.2% on average when comparing to functionally optimized variants. We discover a linear increase in energy expenditure and overall protein expression with the circuit size, where Energy Aware Technology Mapping allows for designing genetic logic circuits with the energetic costs of circuits that are one to two gates smaller. Structural variants improve this further, while results show the Pareto dominance among structures of a single Boolean function. By incorporating energy demand into the design, Energy Aware Technology Mapping enables energy efficiency by design. This extends current GDA tools and complements approaches coping with burden in vivo.

Keywords: computer aided design; energy; entropy production rate; gene-expression; genetic design automation; metabolic burden; non-equilibrium; synthetic biology; technology mapping; thermodynamics.


Conflict of interest statement

The authors declare no competing financial interest.

Figures

Figure 1
Figure 1
Energy Aware Technology Mapping. We here present the technology mapping pipeline at the example of the proposed Energy Aware Technology Mapping. With the specification of the Boolean function to realize as input, the technology mapping first enumerates structural variants. For each circuit structure obtained, we perform in silico an energy aware gate assignment. This takes into account the genetic logic circuit’s performance with respect to both, energy efficiency and functionality. After successful completion of the process, the user receives the automatically designed genetic logic circuit.
Figure 2
Figure 2
Energy aware gene expression model. (A,B) Schematic description of the proposed model consisting of the promoter model (A) and the reactions describing the RNA and protein dynamics (B). (A) The promoter model is instantiated with two levels of transcriptional activity and allows for binding up to three transcription factors. The transcription factor concentration enters via the variable c, with the transcriptional active states (zi with i = 5, 6, 7, 8) featuring transcription rate a2μ1 and the inactive states (zi with i = 1, 2, 3, 4) the basal rate a1 μ1 (a2 > a1). (B) Besides transcription, the dynamics include translation (μ2) and the respective degradation reactions (δ1 and δ2). (C–E) Exemplary response characteristic of the model as a function of the transcription factor abundance c. We here showcase inhibitory behavior of the transcription factor, while the model can also capture activatory behavior. (D) Visualization of the steady state probabilities of each state. As c increases, the probability mass shifts from state z5 to z2 and z3 before concentrating in z4. The corresponding protein distribution is shown in (E) by its mean and three quantile intervals. (C) Presents the expected energy dissipation rate of the overall model. Comparing (C) and (E), one notices the proportionality between energy dissipation rate and protein abundance.
Figure 3
Figure 3
Schematic description of an open CRN. Contrasting open and closed chemical reaction networks, the difference originating in adding chemostat species Yi with associated chemical potential μjY can be easily observed. The core CRN itself is characterized by the Gibbs free energy g(x), while both, the closed and open CRN, are in contact to the heat bath with parameter β. The abundance of the chemostat species is kept constant, in our case by the cellular environment, and results in a chemical potential that drives the core CRN. In this work, the chemostat species refer to cellular energy carriers like ATP and the products of corresponding hydrolysis reactions.
Figure 4
Figure 4
From genes to logic circuits. (A) Visualization of the abstraction levels encountered in GDA. The gene circuit at the bottom realizes the behavior within the cell and is the circuit our model is applied to. It relies on protein concentrations as signal carriers. Defined on top, the genetic logic circuit provides a convenient interpretation in terms of gates, familiar to engineering disciplines and the basis for GDA. The Boolean logic circuit shadows all implementational details and presents the function to realize. (B) Overview on the energy demands of a genetic NOR gate following the implementation of ref (40). The gate consists of the genes a, b, and c, with the preceding and succeeding gates greyed out. ϵtx denotes the energy dissipation rate of the RNA dynamics, ϵtl of the protein dynamics, and ϵp is the energy dissipation rate of the promoter.
Figure 5
Figure 5
Function and energy as disjoint optimization targets. (A) Circuit 0x2F (3 gates) is optimized for function (top) and energy efficiency (bottom). The bar plots on the right present the performance of the genetic logic circuits depicted on the left for both evaluation criteria. Clearly, the optima are disjoint. (B) Visualization of the mean energy expenditure rate per gate (lower is better) for 0x2F over all Boolean input conditions, optimized for functionality (top) and energy efficiency (bottom) and normalized to the largest value. The energy expenditure of the NOR and OR gate differ significantly between the two implementations, impacting the overall energy efficiency significantly [see (A)]. (C) Boolean activity as an heuristic for the energy expenditure of a genetic logic circuit. Here compared to the energy of circuits with the objective energy efficiency. (D) The optimization results of circuits 0xDF (4 gates), 0x20 (5 gates), and 0x81 (7 gates), normalized to the maximum functional score and energy efficiency observed in the benchmark. Again, optimizing for either of the two objectives decreases the performance of the genetic logic circuits with respect to the other. (E) Analysis of the cost of energy efficiency increase on the benchmark. While the optimization for energy improves energy efficiency up to 58.9%, the functionality score is often decreased significantly. (F) Relationship between expected energy dissipation rate of the circuit and its gate count. The bold line is the mean and the shaded areas present the minimum and maximum intervals, with the colors indicating the optimization objective. This figure reveals a near linear relationship between energy dissipation rate and gate count. However, the optimization objective sets the offset. Comparing the objectives, optimization for energy efficiency allows to implement genetic logic circuits of six gates with the energetic requirements of functionally optimized four gate circuits.
Figure 6
Figure 6
Peaked entropy production rate in transition region. The average promoter activity and the corresponding entropy production rates of two exemplary promoter models as a function of transcription factor abundance c. These promoter models vary in the instantiation of the promoter architecture in Figure 2A. We highlight the transition region, which connects the two saturated regions of promoter activity. In most cases, entropy (ϵp(c) = ep(c) β–1) is highest (dashed line) within this transition region. Besides, this entropy production peak is often close to the steepest descend (marker) of promoter activity [see (A)] in the linear domain, but not in all cases [see (B)].
Figure 7
Figure 7
Impact of the logic circuit structure on energy efficiency. (A) We here present the functionality and energy efficiency of the structural variants of function 0xEC optimized with respect to energy efficiency. The structures feature different characteristics in both, the energy efficiency and functionality, with an average improvement of energy efficiency by 30.7% when considering the best structure. Normalization refers in both cases to the best value encountered. (B) The Boolean activity per gate for structures 7 and 15 of function 0xEC, which exhibit the worst and best energy efficiency. In comparison to structure 7, structure 15 features 10 active states less. This manifests in a significantly higher energy efficiency of structure 15 [see (A)]. (C) Overview on the distribution of energy optimized variants for the three functions 0xEC (3 gates), 0x02 (4 gates), and 0xE7 (5 gates), where the gate counts refer to the smallest structure obtained. Within the figures, the colors code for the number of excess gates, showing that smaller structures are beneficial for energy efficiency. However, for larger circuits the consideration of excess gates proves beneficial for functionality. The values are normalized with respect to the best values obtained for each function, while the clustering results from the discrete nature of gate assignment. (D) Also for the structural variants, the correlation between Boolean activity and the energy dissipation is significant albeit varies among the different functions (0.927 for 0xEC, 0.960 for 0x02, and 0.934 for 0xE7).
Figure 8
Figure 8
Pareto front of the boolean function 0xF7. (A–C) Three exemplary structures of the Boolean function 0xF7. In particular, structure 4 in (A), structure 8 in (B) and structure 9 in (C). (D–F) The Pareto fronts of the structures presented in (A–C), where (D) presents the one of structure 4, (E) the one of structure 8, and (F) corresponds to structure 9, respectively. Normalized with respect to the optimum in each dimension, the Pareto fronts (D–F) exhibit different characteristics with the discontinuities and nonmonotonicity resulting from discrete gate assignment and stochastic optimization. (D) Combines high functional performance with moderate energy requirements while (E) allows the highest energy efficiency still preserving a moderate functional performance. The Pareto front of structure 9 [see Figure (F)] exhibits a near linear relationship between functionality and energy efficiency, with an inferior overall performance. (G) We here illustrate the Pareto fronts of all the structures of 0xF7 jointly to emphasize comparability among them. Highlighting the Pareto fronts presented in (D–F) by bold lines, their relationship to one another gets obvious. In addition, one observes that the Pareto front of structure 9 is inferior to others for any configuration. Figure (H) visualizes this quantitatively by presenting the dominance among Pareto fronts. In detail, the rows indicate the structure corresponding to the Pareto front dominating the respective Pareto front denoted in the column. This comparison emphasizes the dominating behavior of structures 4, 8, and 10 over the others with respect to both optimization goals.

Update of

References

    1. Zoller B.; Gregor T.; Tkačik G. Eukaryotic gene regulation at equilibrium, or non?. Curr. Opin. Syst. Biol. 2022, 31, 100435. 10.1016/j.coisb.2022.100435. - DOI - PMC - PubMed
    1. Alberts B.; Johnson A.; Lewis J.; Raff M.; Roberts K.; Walter P.. Molecular Biology of the Cell, 6th ed.; Garland Science: New York, NY, 2017.
    1. Ahsendorf T.; Wong F.; Eils R.; Gunawardena J. A framework for modelling gene regulation which accommodates non-equilibrium mechanisms. BMC Biol. 2014, 12, 102–123. 10.1186/s12915-014-0102-4. - DOI - PMC - PubMed
    1. Broach J. R. Nutritional Control of Growth and Development in Yeast. Genetics 2012, 192, 73–105. 10.1534/genetics.111.135731. - DOI - PMC - PubMed
    1. Kastberg L. L. B.; Ard R.; Jensen M. K.; Workman C. T. Burden Imposed by Heterologous Protein Production in Two Major Industrial Yeast Cell Factories: Identifying Sources and Mitigation Strategies. Front. Fungal Biol. 2022, 3, 827704. 10.3389/ffunb.2022.827704. - DOI - PMC - PubMed

Publication types