. 2024 Oct 8:13:RP96190.
doi: 10.7554/eLife.96190.

A modified BPaL regimen for tuberculosis treatment replaces linezolid with inhaled spectinamides

Affiliations

A modified BPaL regimen for tuberculosis treatment replaces linezolid with inhaled spectinamides

Malik Zohaib Ali et al. Elife. .

Abstract

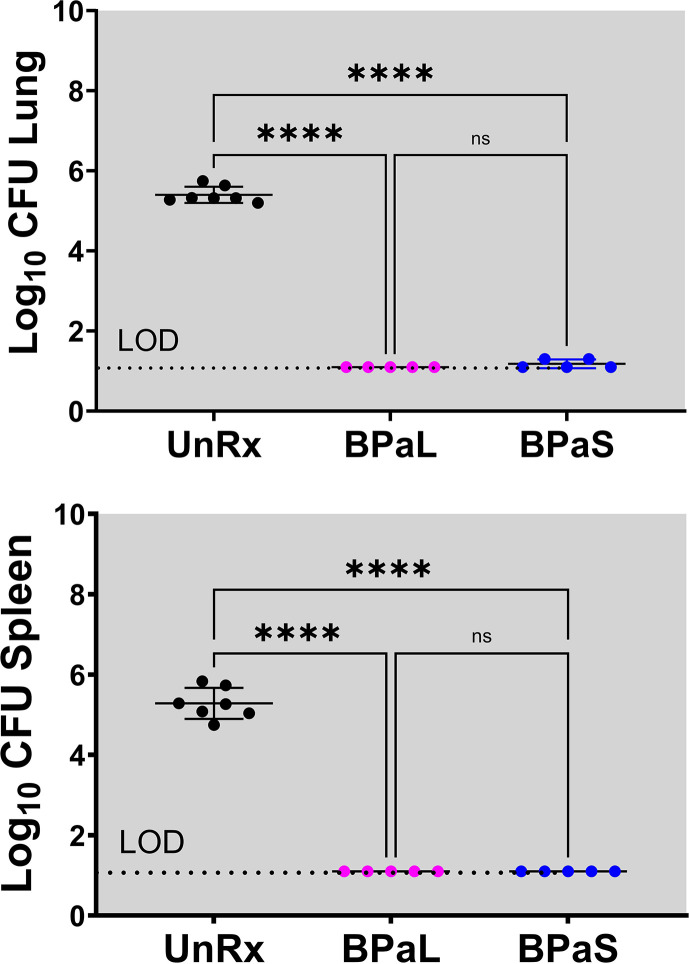
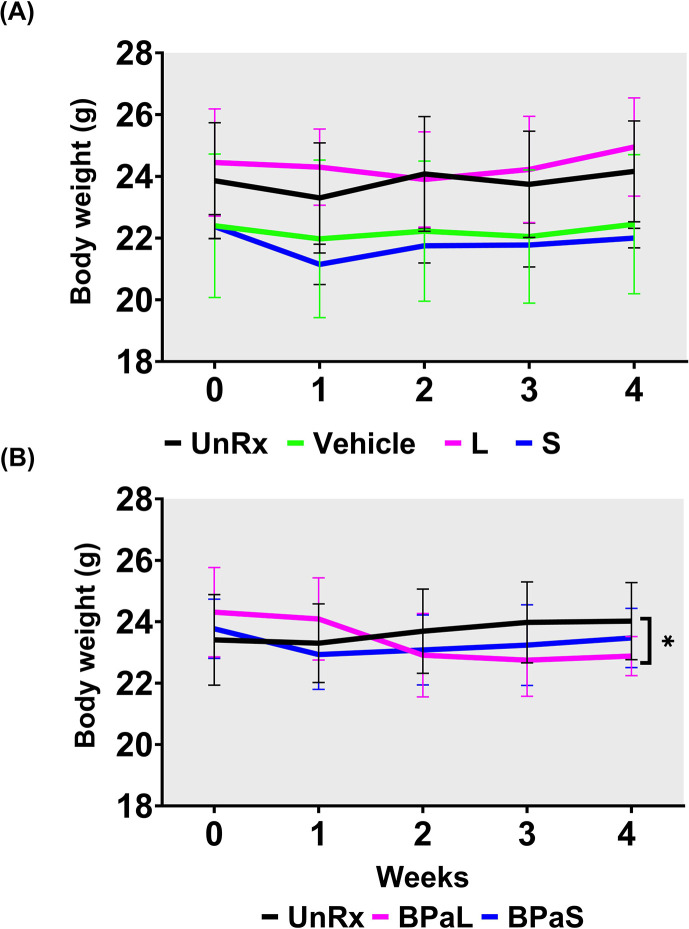
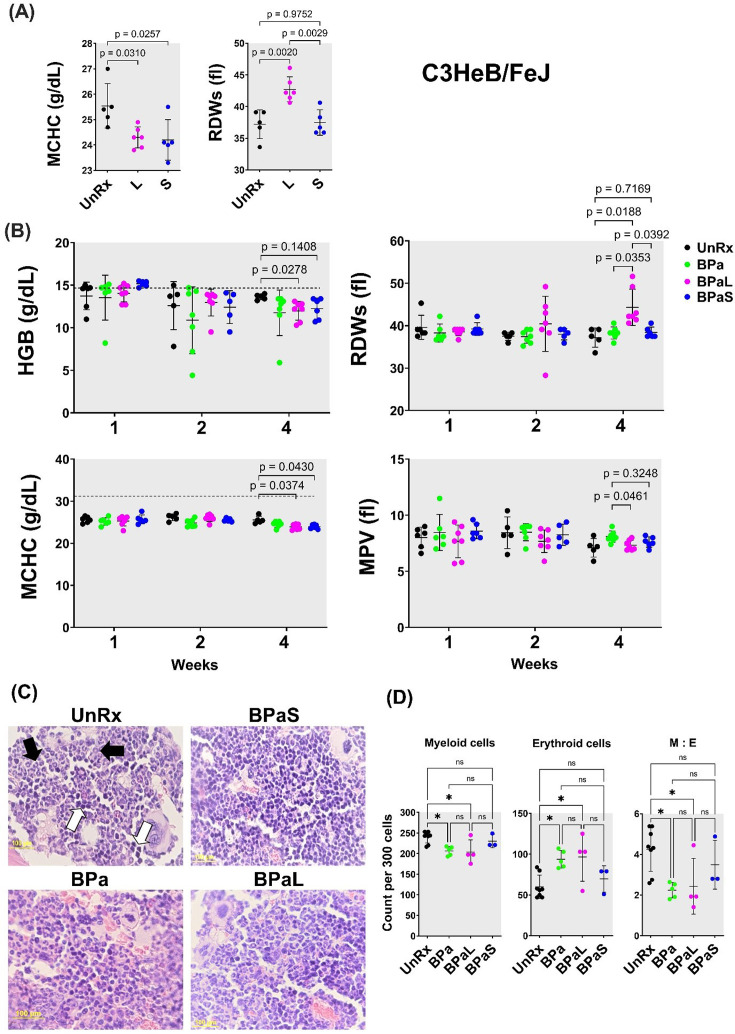
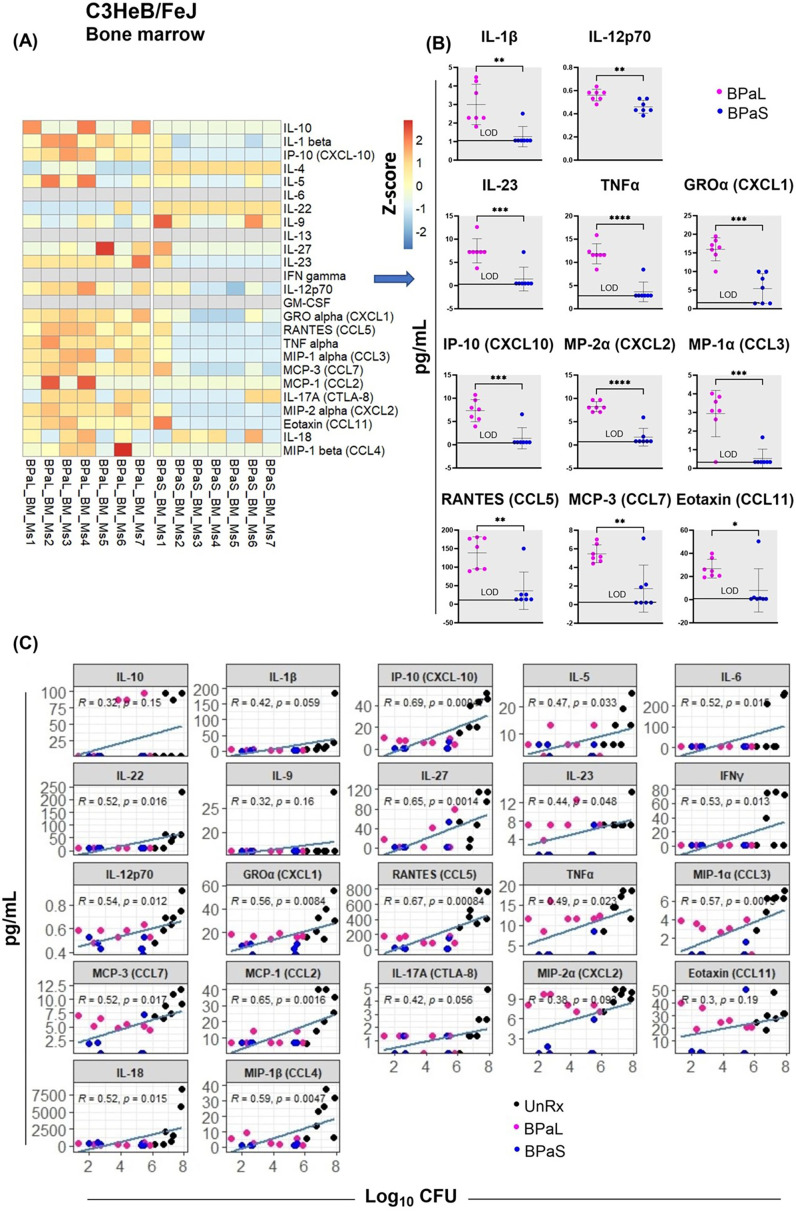
The Nix-TB clinical trial evaluated a new 6 month regimen containing three oral drugs; bedaquiline (B), pretomanid (Pa), and linezolid (L) (BPaL regimen) for the treatment of tuberculosis (TB). This regimen achieved remarkable results as almost 90% of the multidrug-resistant or extensively drug-resistant TB participants were cured but many patients also developed severe adverse events (AEs). The AEs were associated with the long-term administration of the protein synthesis inhibitor linezolid. Spectinamide 1599 is also a protein synthesis inhibitor of Mycobacterium tuberculosis with an excellent safety profile, but it lacks oral bioavailability. Here, we propose to replace L in the BPaL regimen with spectinamide (S) administered via inhalation and we demonstrate that inhaled spectinamide 1599, combined with BPa --BPaS regimen--has similar efficacy to that of the BPaL regimen while simultaneously avoiding the L-associated AEs. The BPaL and BPaS regimens were compared in the BALB/c and C3HeB/FeJ murine chronic TB efficacy models. After 4-weeks of treatment, both regimens promoted equivalent bactericidal effects in both TB murine models. However, treatment with BPaL resulted in significant weight loss and the complete blood count suggested the development of anemia. These effects were not similarly observed in mice treated with BPaS. BPaL and BPa, but not the BPaS treatment, also decreased myeloid to erythroid ratio suggesting the S in the BPaS regimen was able to recover this effect. Moreover, the BPaL also increased concentration of proinflammatory cytokines in bone marrow compared to mice receiving BPaS regimen. These combined data suggest that inhaled spectinamide 1599 combined with BPa is an effective TB regimen without L-associated AEs.

Keywords: Mycobacterium; bedaquiline/pretomanid; infectious disease; inhalation; linezolid; microbiology; spectinmaides; tuberculosis.


Conflict of interest statement

MZ, TD, AM, AW, CP, HL, JP, JP, MH, RL, JL, GR, AH, BM, MG No competing interests declared

Figures

Figure 1.
Figure 1.. Bactericidal effect of BPaL and BPaS in TB mouse models after 4-weeks of treatment.
BALB/c and C3HeB/FeJ female mice were chronically infected with a low dose aerosol infection of Mtb Erdman strain to deliver ∼75 and ∼100 bacilli respectively. Post-infection, BALB/c and C3HeB/FeJ mice were rested for 4 and 8-9 weeks respectively until they were randomly assigned to the study groups. The mice were treated with monotherapy of linezolid or spectinamide 1599 or combination therapy of BPaL, BPa or BPaS for 4 weeks. Bedaquiline (B), pretomanid (Pa) and linezolid (L) were administered at 25, 100 and 100 mg/kg respectively by oral gavage for 5/7 a week while spectinamide 1599 at 50 and 100 mg/kg in BALB/c and C3HeB/FeJ TB models respectively for 3/7 a week on the alternate days via intrapulmonary aerosol delivery. On the third day of the last treatment, the mice were euthanized, and their lungs and spleen were collected. The organs were homogenized, serially diluted and plated on 7H11 agar with 4% charcoal (to avoid drug carry-over effect) to determine bacterial burden in the form of colony forming units (CFU) in each sample. CFU were enumerated after 4-6 weeks of incubation at 37 °C and expressed as log10.C3HeB/FeJ and BALB/c TB models showing efficacy of monotherapy (A-D) and combination therapy (E-H). The C3HeB/FeJ graphs (E, G) represent the pooled data from three independent studies (n=3-8, Figure 1—figure supplements 1–3) and two of the three studies contained BPa as a reference control. The BALB/c graphs (F, H) represent the pooled data from two independent studies (n=5, Figure 1—figure supplements 8 and 9). Statistical significance was calculated using one-way ANOVA with Tukey’s multiple comparison test, p < 0.05 was considered significant and ** = p<0.001, *** = p<0.0001, **** = P<0.0001. UnRx = untreated, L = linezolid, S = spectinamide 1599, LOD: limit of detection.
Figure 1—figure supplement 1.
Figure 1—figure supplement 1.. C3HeB/FeJ Study 1, bacterial burden (CFU) in Mycobacterium tuberculosis infected C3HeB/FeJ mice treated with BPaL and BPaS regimen for 4 weeks CFU data.
Bacterial burden (colony-forming units, CFU) in Mycobacterium tuberculosis infected C3HeB/FeJ mice treated with BPaL and BPaS regimen for 4weeks. n=7, LOD: limit of detection, p<0.05.
Figure 1—figure supplement 2.
Figure 1—figure supplement 2.. C3HeB/FeJ Study 2, bacterial burden (CFU) in Mycobacterium tuberculosis infected C3HeB/FeJ mice treated with BPa, BPaL and BPaS regimen for 4 weeks CFU data.
Bacterial burden (colony-forming units, CFU) in Mycobacterium tuberculosis infected C3HeB/FeJ mice treated with BPa, BPaL, and BPaS regimen for 4 weeks. n=3–9, LOD: limit of detection, p<0.05.
Figure 1—figure supplement 3.
Figure 1—figure supplement 3.. C3HeB/FeJ Study 3, bacterial burden (CFU) in Mycobacterium tuberculosis infected C3HeB/FeJ mice treated with BPa, BPaL and BPaS regimen for 4 weeks.
Bacterial burden (colony-forming unit CFU) in Mycobacterium tuberculosis infected C3HeB/FeJ mice treated with BPa, BPaL, and BPaS regimen for 4 weeks. n=5–7, LOD: limit of detection, p<0.05.
Figure 1—figure supplement 4.
Figure 1—figure supplement 4.. Combined data for change in body weight during monotherapy and combination therapy in C3HeB/Fej mice .
Change in the average body weight of Mycobacterium tuberculosis infected C3HeB/FeJ mice during drug treatment. (A) Represents the change during monotherapy of linezolid (L) and spectinamide 1599 (S) compared to untreated (UnRx) control while (B) represents the combined data from three independent studies during combination treatment with BPa, BPaL, and BPaS. p<0.05.
Figure 1—figure supplement 5.
Figure 1—figure supplement 5.. C3HeB/FeJ Study 1 change in body weight during combination therapy in C3HeB/Fej mice, weight data.
Change in the average body weight of Mycobacterium tuberculosis infected C3HeB/FeJ mice during drug treatment. n=7, p<0.05.
Figure 1—figure supplement 6.
Figure 1—figure supplement 6.. C3HeB/FeJ Study 2 change in body weight during combination therapy in C3HeB/Fej mice, weight data.
Change in the average body weight of Mycobacterium tuberculosis infected C3HeB/FeJ mice during drug treatment. n=3–9, p<0.05.
Figure 1—figure supplement 7.
Figure 1—figure supplement 7.. C3HeB/FeJ Study 3 change in body weight during combination therapy in C3HeB/Fej mice, weight data.
Change in the average body weight of Mycobacterium tuberculosis infected C3HeB/FeJ mice during drug treatment. n=5–7, p<0.05.
Figure 1—figure supplement 8.
Figure 1—figure supplement 8.. BALB/c Study 1, CFU data.
Bacterial burden (colony-forming units, CFU) in Mycobacterium tuberculosis infected BALB/c mice treated with BPaL and BPaS regimen for 4 weeks. n=5, LOD: limit of detection, p<0.05.
Figure 1—figure supplement 9.
Figure 1—figure supplement 9.. BALB/c Study 2, CFU data.
Bacterial burden (colony-forming units, CFU) in Mycobacterium tuberculosis infected BALB/c mice treated with BPaL and BPaS regimen for 4 weeks. n=5–7, LOD: limit of detection, p<0.05.
Figure 1—figure supplement 10.
Figure 1—figure supplement 10.. Combined data for change in body weight during monotherapy and combination therapy in Balb/c mice.
Change in the average body weight of Mycobacterium tuberculosis infected BALB/c mice during drug treatment. (A) represents the change during monotherapy of linezolid (L) and spectinamide 1599 (S) compared to untreated (UnRx) and vehicle control while (B) represents the combined data from two independent studies during combination treatment with BPaL and BPaS. p<0.05.
Figure 1—figure supplement 11.
Figure 1—figure supplement 11.. BALB/c Study 1 change in body weight during combination therapy in Balb/c mice, weight data.
Change in the average body weight of Mycobacterium tuberculosis infected BALB/c mice during drug treatment. n=5, p<0.05.
Figure 1—figure supplement 12.
Figure 1—figure supplement 12.. BALB/c Study 2 change in body weight during combination therapy in Balb/c mice, weight data.
Change in the average body weight of Mycobacterium tuberculosis infected BALB/c mice during drug treatment. n=5–7, p<0.05.
Figure 2.
Figure 2.. Effect of therapy on lung histopathology of TB mouse models after 4-weeks of treatment.
At the end of therapy, the mice were euthanized, and their lungs were collected and processed for histopathology and lesion scoring. FFPE sections were cut at 5 µm, stained with hematoxylin and eosin (H and E) and imaged at 40x (A: C3HeB/FeJ, C: BALB/c). Lesion maps (B: C3HeB/FeJ, D: BALB/c) show the infected areas in red color while green color represents the uninvolved parenchymal tissue. Lesion scores (E: C3HeB/FeJ, F: BALB/c) were calculated as the proportion of infected area over the total lung area per animal. Statistical significance was calculated using one-way ANOVA with Tukey’s multiple comparison test, and p < 0.05 was considered significant and ** = p<0.001, *** P<0.0001. UnRx = untreated.
Figure 3.
Figure 3.. Complete blood count profiling and bone marrow histopathology in C3HeB/FeJ TB mouse model during 4-weeks of therapy.
During therapy of mice in Figure 1, the blood was collected at 1-, 2- and 4-weeks of treatment. The complete blood count was collected in VETSCAN HM5 hematology analyzer (Zoetis). (A) Monotherapy, (B) multidrug therapy. The MCHC (mean corpuscular hemoglobin concentration) and RDWs (red blood cell distribution width-standard deviation) along with the HGB (hemoglobin concentration) and MPV (mean platelet volume) are shown. A horizontal dotted line indicates the lower end of the reference interval for C3HeB/FeJ mice. The sternum, femur and tibias bones from each mouse were collected, fixed in 4% PFA, and processed for histology (C and D). Sections were cut at 5 µm, stained with hematoxylin and eosin (H and E) and imaged at 40x. (C) Representative photos of bone marrow sections showing myeloid (black arrows) and erythroid (white arrows) cells in bone marrow of untreated (UnRx) and treatment (BPa, BPaS and BPaS) groups. (D) The number of myeloid (M) and erythroid (E) among a total of 300 cells in 5 different regions were counted for each group and M:E was calculated. Statistical significance was calculated using one-way ANOVA with Tukey’s test for multiple comparisons. p < 0.05 was considered significant and ** = p<0.001, *** = P<0.0001.
Figure 4.
Figure 4.. Bone marrow cytokine and chemokine profiling in C3HeB/FeJ TB mouse model after 4-weeks of treatment.
Femur bones from selected studies in mice in Figure 1 were collected to harvest the bone marrow. The bone marrow was resuspended in PBS, centrifuged and the supernatant was collected for the evaluation of cytokine’s content. BPaL and BPaS therapy showed profile of 26 cytokines and chemokines in bone marrow and the data were converted to Z score and represented as a heatmap (A) and graphically (B). (C) Spearman’s correlation analysis of bone marrow cytokines and chemokines (Y axis: pg/ml) with the lung bacterial burden (X axis; log10CFU). Statistical significance was calculated using the t test. p < 0.05 was considered significant and ** = p<0.001*** = p<0.0001, **** = P<0.00001.
Figure 4—figure supplement 1.
Figure 4—figure supplement 1.. Change in the cytokines and chemokines profile in Mycobacterium tuberculosis infected C3HeB/FeJ mice during drug treatment.
(A) Plasma and (B) lung cytokine and chemokine contents in mice treated with BPaL or BPaS.
Figure 4—figure supplement 2.
Figure 4—figure supplement 2.. Spearman’s correlation analysis between bacterial burden colony-forming units (CFU) and cytokine and chemokine profile in the lungs of Mycobacterium tuberculosis infected C3HeB/FeJ mice treated with BPaL and BPaS regimen.
Figure 4—figure supplement 3.
Figure 4—figure supplement 3.. Spearman’s correlation analysis between lung bacterial burden colony-forming units (CFU) and plasma cytokine and chemokine profile in Mycobacterium tuberculosis infected C3HeB/FeJ mice treated with BPaL and BPaS regimen.
Figure 5.
Figure 5.. Immune cell populations in the bone marrow, lung and blood of C3HeB/FeJ TB mouse model after 4-weeks of treatment.
The bone marrow, lung and blood from selected studies from Figure 1 were evaluated by flow cytometry. The samples were processed for a panel of 17-color antibodies and the data were analyzed by FlowJo software using manual gating strategy. The myeloid and lymphoid phenotypes present in the untreated (UnRx) and treatment (BPa, BPaL or BPaS) groups are shown. Statistical significance was calculated using one-way ANOVA with Tukey’s test for multiple comparisons. p < 0.05 was considered significant and ** = p<0.001*** = p<0.0001, **** = P<0.00001.
Figure 6.
Figure 6.. Immune cell populations in the lungs of C3HeB/FeJ TB mouse model after 4-weeks of treatment.
Selected mice from those shown in Figure 1 were processed for multiplex fluorescence immunohistochemistry (mfIHC). The mfIHC was performed for a panel of 6-color antibodies + DAPI using Opal-plex Tyramide Signal Amplification (TSA). Slides were scanned using multispectral automated PhenoImager (Akoya Biosciences) and analyzed for different immune cell populations using the inForm tissue Finder and Phenochart software (Akoya Biosciences). (A) The lung mfIHC full composite image displays B220, CD4, CD8, F4/80, FoxP3 and Ly6G markers along with DAPI staining for nuclei in the TB granuloma. The central and peripheral regions of a TB granuloma and the parenchyma of lung are also shown. (B) Single color composite image of individual markers with DAPI showing distribution of each immune cell population in the TB granuloma. (C) Cell populations (%) of several immune cells per total number of phenotypes calculated in untreated (UnRx: n = 2 mice) and treatment (BPaL and BPaS: n = 3 mice each) groups based on a panel of 6-color antibodies + DAPI. (D) Spearman’s correlation matrix for several immune cell populations (B220, CD4, CD8, F4/80, FoxP3, Ly6G) showing all relationships. A coefficient with a value of either +1 (blue), 0 (white), or -1 (red) indicates a perfect association, no association, and a perfect negative association of ranks, respectively. Numbers indicate the correlation coefficient.
Figure 6—figure supplement 1.
Figure 6—figure supplement 1.. Immune cell populations in the lungs of Mycobacterium tuberculosis infected C3HeB/FeJ tuberculosis (TB) model after 4 weeks of therapy.
Statistical significance was calculated using two-way ANOVA with Tukey’s test for multiple comparisons and p<0.05 was considered significant.

Update of

References

    1. Aly S, Wagner K, Keller C, Malm S, Malzan A, Brandau S, Bange FC, Ehlers S. Oxygen status of lung granulomas in Mycobacterium tuberculosis-infected mice. The Journal of Pathology. 2006;210:298–305. doi: 10.1002/path.2055. - DOI - PubMed
    1. Bigelow KM, Tasneen R, Chang YS, Dooley KE, Nuermberger EL. Preserved efficacy and reduced toxicity with intermittent linezolid dosing in combination with bedaquiline and pretomanid in a murine tuberculosis model. Antimicrobial Agents and Chemotherapy. 2020;64:e01178-20. doi: 10.1128/AAC.01178-20. - DOI - PMC - PubMed
    1. Bigelow KM, Deitchman AN, Li SY, Barnes-Boyle K, Tyagi S, Soni H, Dooley KE, Savic RM, Nuermberger EL. Pharmacodynamic correlates of linezolid activity and toxicity in murine models of tuberculosis. The Journal of Infectious Diseases. 2021;223:1855–1864. doi: 10.1093/infdis/jiaa016. - DOI - PMC - PubMed
    1. Boisson M, Jacobs M, Grégoire N, Gobin P, Marchand S, Couet W, Mimoz O. Comparison of intrapulmonary and systemic pharmacokinetics of colistin methanesulfonate (CMS) and colistin after aerosol delivery and intravenous administration of CMS in critically ill patients. Antimicrobial Agents and Chemotherapy. 2014;58:7331–7339. doi: 10.1128/AAC.03510-14. - DOI - PMC - PubMed
    1. Bruhn DF, Scherman MS, Liu J, Scherbakov D, Meibohm B, Böttger EC, Lenaerts AJ, Lee RE. In vitro and in vivo evaluation of synergism between anti-tubercular spectinamides and non-classical tuberculosis antibiotics. Scientific Reports. 2015;5:13985. doi: 10.1038/srep13985. - DOI - PMC - PubMed

MeSH terms

LinkOut - more resources