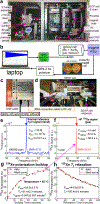
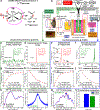
. 2024 Oct 22;96(42):16724-16734.
doi: 10.1021/acs.analchem.4c03149. Epub 2024 Oct 8.

Low-Cost Purpose-Built Ultra-Low-Field NMR Spectrometer

Affiliations

Low-Cost Purpose-Built Ultra-Low-Field NMR Spectrometer

Md Raduanul H Chowdhury et al. Anal Chem. .

Abstract

Low-field NMR has emerged as a new analytical technique for the investigation of molecular structure and dynamics. Here, we introduce a highly integrated ultralow-frequency NMR spectrometer designed for the purpose of ultralow-field NMR polarimetry of hyperpolarized contrast media. The device measures 10 cm × 10 cm × 2.0 cm and weighs only 370 g. The spectrometer's aluminum enclosure contains all components, including an RF amplifier. The device has four ports for connecting to a high-impedance RF transmit-receive coil, a trigger input, a USB port for connectivity to a PC computer, and an auxiliary RS-485/24VDC port for system integration with other devices. The NMR spectrometer is configured for a pulse-wait-acquire-recover pulse sequence, and key sequence parameters are readily controlled by a graphical user interface (GUI) of a Windows-based PC computer. The GUI also displays the time-domain and Fourier-transformed NMR signal and allows autosaving of NMR data as a CSV file. Alternatively, the RS485 communication line allows for operating the device with sequence parameter control and data processing directly on the spectrometer board in a fully automated and integrated manner. The NMR spectrometer, equipped with a 250 ksamples/s 17-bit analog-to-digital signal converter, can perform acquisition in the 1-125 kHz frequency range. The utility of the device is demonstrated for NMR polarimetry of hyperpolarized 129Xe gas and [1-13C]pyruvate contrast media (which was compared to the 13C polarimetry using a more established technology of benchtop 13C NMR spectroscopy, and yielded similar results), allowing reproducible quantification of polarization values and relaxation dynamics. The cost of the device components is only ∼$200, offering a low-cost integrated NMR spectrometer that can be deployed as a plug-and-play device for a wide range of applications in hyperpolarized contrast media production─and beyond.


Figures
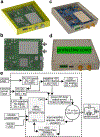
Figure 1.
Figure 1.
a) 3D rendering of ULF spectrometer; b) photograph of the device with the top cover removed; c) 3D rendering of the printed circuit board (PCB) of the ULF spectrometer (see Figures S2 and S3 for additional close-up views); d) photograph of the device with the protective cover on (overall dimensions of 10 cm × 10 cm × 2.0 cm); e) overall block diagram of the ULF spectrometer (see Figure S1 for complete details).
Figure 2.
Figure 2.
a) graphical user interface (GUI) of the NMR spectrometer showing an NMR signal acquired during the SEOP of 129Xe; b) corresponding example of acquired reflected power frequency response of the [1-13C]pyruvate polarimetry RF coil, operating at 42 kHz. In displays a and b, (left) control menu, (top right) FID, and (bottom right) FT spectrum; c) RF pulse waveform of the NMR spectrometer transmitter at 40 kHz (recorded using digital oscilloscope); d) RF transmitter voltage (Volts peak-to-peak) as a function of RF pulse transmitter power setting (%); e) RF transmitter power (milliwatts) as a function of RF pulse transmitter power setting (%).
Figure 3.
Figure 3.
a) Annotated photographs of second-generation (GEN-2) hyperpolarizer device’s open upper chassis with B0 magnet to show important components required for the SEOP process e.g., SEOP cell, laser (with beam expander), in situ NMR coil, heating jacket, etc. b) Schematic diagram of the HP 129Xe detection process using the XeUS spectrometer. A representative GUI-enabled acquired NMR signal during the in situ NMR polarimetry of HP 129Xe using the ULF NMR spectrometer is shown on the laptop window. c) A photograph of the ULF spectrometer with annotated dimensions and weight. The spectrometer is connected to the RF coil interfacing the SEOP cell jacket via a SMA connection; the spectrometer is also connected to a PC computer via a USB C-type interface that provides power and GUI-enabled features. d) An annotated photograph of the SEOP cell oven. e) NMR spectrum of 190,000-scan water 1H NMR signal detected at 40.8 kHz resonance frequency. f) Single-shot HP 129Xe NMR spectrum detected at 40.8 kHz resonance frequency. g) 129Xe polarization buildup (at 65 °C) and h) T1 relaxation at room temperature (25 °C) plotted using NMR acquisition every 4 minutes.
Figure 4.
Figure 4.
Quantitative 13C NMR polarimetry of HP [1-13C]pyruvate in CD3OD using XeUS spectrometer. a) Schematic of SABRE-SHEATH hyperpolarization process. b) Overall schematic of experimental setup of 13C hyperpolarization followed by sample transfer to 15 MHz NMR spectrometer or 42-kHz electromagnet-based setups for polarimetry. c) 1H NMR of thermally polarized signal-reference water sample (20,000 scans, 110 M) and d) 13C NMR signal of HP [1-13C]pyruvate (1 scan, 30 mM) using the ULF spectrometer at 42 kHz (note 12,000 corresponds to approximately 500 Hz). e) 13C NMR signal from HP [1-13C]pyruvate (1 scan, 30 mM) and f) 13C NMR signal from signal-reference thermally polarized [1-13C]acetic acid (1 scan, 17.5 M) obtained using 15 MHz benchtop 13C NMR SpinSolve NMR spectrometer. g) 13C %P13C build-up of HP [1-13C]pyruvate at 0.42 μT detected at 42 kHz. h) 13C %P13C T1 decay of HP [1-13C]pyruvate at 0.42 μT detected at 42 kHz. i) %P13C build-up of HP [1-13C]pyruvate at 0.42 μT detected at 15 MHz. j) %P13C T1 decay of HP [1-13C]pyruvate at 0.42 μT detected at 15 MHz. k) 13C RF pulse duration sweep at 42 kHz using the sample of HP [1-13C]pyruvate. l) Frequency response of the RF coil at 42 kHz using pre-acquisition time of 1 ms, showing the reflected power maximum at a resonance frequency (one scan). m) 13C NMR signal intensity of HP [1-13C]pyruvate as a function of B0 magnetic field current. n) The comparison between average %P13C values obtained from five repeat experiments using 15 MHz (blue: 10.0±0.2%) and 42 kHz (green: 8.4±0.5%) experimental setups, respectively.

References

    1. Bluemich B; Casanova F; Appelt S NMR at low magnetic fields. Chem. Phys. Lett 2009, 477 (4–6), 231–240.
    1. Blümich B Virtual special issue: Magnetic resonance at low fields. J. Magn. Reson 2017, 274, 145–147. - PubMed
    1. Michal CA A low-cost spectrometer for NMR measurements in the Earth’s magnetic field. Meas. Sci. Technol 2010, 21 (10), 105902.
    1. Michal CA Low-cost low-field NMR and MRI: Instrumentation and applications. J. Magn. Reson 2020, 319, 106800. - PMC - PubMed
    1. Krjukov E; Fichele S; Wild JM; Paley MNJ Design and evaluation of a low field system for hyperpolarized 3He gas imaging of neonatal lungs. Concept Magnetic Res. B 2007, 31B (4), 209–217.

LinkOut - more resources