. 2024 Nov 4;156(11):e202413596.
doi: 10.1085/jgp.202413596. Epub 2024 Oct 8.

Interplay of Nav1.8 and Nav1.7 channels drives neuronal hyperexcitability in neuropathic pain

Affiliations

Interplay of Nav1.8 and Nav1.7 channels drives neuronal hyperexcitability in neuropathic pain

Dmytro V Vasylyev et al. J Gen Physiol. .

Abstract

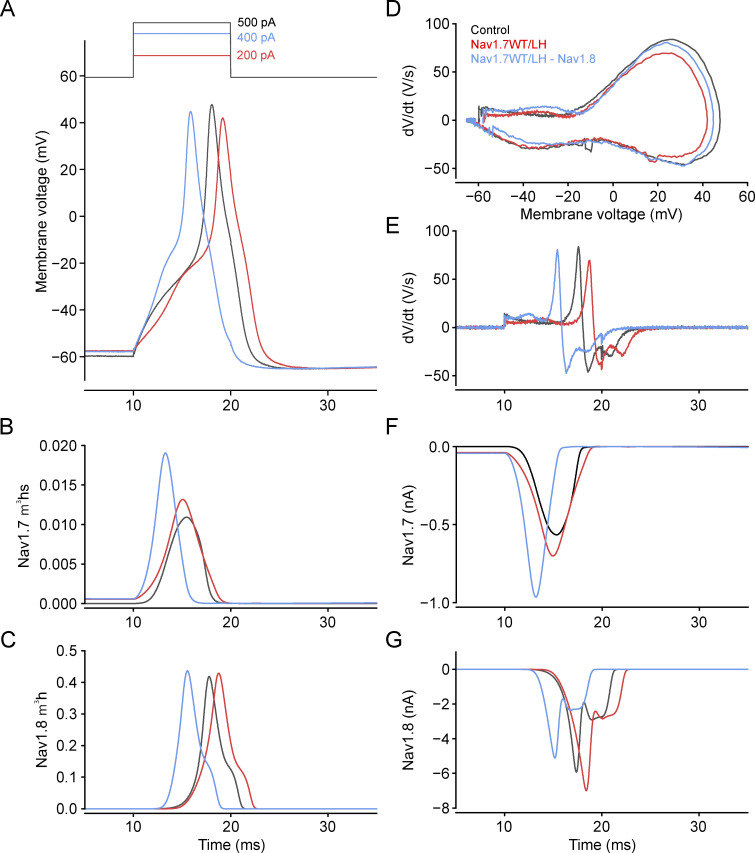
While voltage-gated sodium channels Nav1.7 and Nav1.8 both contribute to electrogenesis in dorsal root ganglion (DRG) neurons, details of their interactions have remained unexplored. Here, we studied the functional contribution of Nav1.8 in DRG neurons using a dynamic clamp to express Nav1.7L848H, a gain-of-function Nav1.7 mutation that causes inherited erythromelalgia (IEM), a human genetic model of neuropathic pain, and demonstrate a profound functional interaction of Nav1.8 with Nav1.7 close to the threshold for AP generation. At the voltage threshold of -21.9 mV, we observed that Nav1.8 channel open-probability exceeded Nav1.7WT channel open-probability ninefold. Using a kinetic model of Nav1.8, we showed that a reduction of Nav1.8 current by even 25-50% increases rheobase and reduces firing probability in small DRG neurons expressing Nav1.7L848H. Nav1.8 subtraction also reduces the amplitudes of subthreshold membrane potential oscillations in these cells. Our results show that within DRG neurons that express peripheral sodium channel Nav1.7, the Nav1.8 channel amplifies excitability at a broad range of membrane voltages with a predominant effect close to the AP voltage threshold, while Nav1.7 plays a major role at voltages closer to resting membrane potential. Our data show that dynamic-clamp reduction of Nav1.8 conductance by 25-50% can reverse hyperexcitability of DRG neurons expressing a gain-of-function Nav1.7 mutation that causes pain in humans and suggests, more generally, that full inhibition of Nav1.8 may not be required for relief of pain due to DRG neuron hyperexcitability.


Conflict of interest statement

Disclosures: S.G. Waxman reported personal fees from Amgen, personal fees from Biogen, personal fees from Glaxo, personal fees from Eli Lilly, personal fees from ThirdRock Ventures, personal fees from Olipass Biotherapeutics, personal fees from Sangamo Therapeutics, personal fees from Exicure, personal fees from Chromocell Therapeutics, personal fees from Latigo Labs, personal fees from Envida, personal fees from Ionis, personal fees from Almylan, personal fees from Forestie Labs, personal fees from Argo Therapeutics, personal fees from Neurona, personal fees from Shape Therapeutics, personal fees from NxGen, personal fees from Arrowhead Therapeutics, personal fees from Voyager Therapeutics, other from Site One Therapeutics, other from Navega Therapeutics, personal fees from Medtronic, and other from Vertex Therapeutics outside the submitted work. No other disclosures were reported.

Figures

Figure 1.
Figure 1.
Comparative functional analysis of previously published Nav1.7 and Nav1.8 kinetic models in wild-type small DRG neurons. (A–D) Shown are plots of voltage dependences for activation time constants (A), inactivation time constants (B), activation (m3), inactivation (h) variables at steady-state (C), and steady-state open channel probabilities (D) m3hs of the Nav1.7WT (black lines), Nav1.7L858H (red lines), and Nav1.8 (blue lines) channels. Time constants and steady-state variables were calculated from the respective Hodgkin–Huxley equations, τ = 1/(α+β), x∞ = α/(α+β), and α and β are forward and backward rate constants adopted from the kinetic models published previously (see Materials and methods for details). Note that curves of time constant h (B) and steady-state inactivation h (C) calculated for Nav1.7WT coincide with the respective curves for Nav1.7L858H. (E) Action potential of wild-type small DRG neuron evoked by 700 pA rheobase stimulus (shown on top). AP threshold is denoted by the red dot. (F) Nav channel open probabilities m3*h*s during AP shown in E were calculated for Nav1.7WT (black lines), Nav1.7L858H (red lines), and Nav1.8 (blue lines) at 20 µs precision. (G) Shown are sodium currents derived from the equation INa = Gmax*m3*h*s*(Vm−ENa), where m is activation variable, h and s are inactivation variables (s = 1 for Nav1.8 channel), Gmax is maximal conductance, Vm is membrane voltage, ENa = 65 mV is sodium reversal potential, Nav1.7 Gmax = 681 nS, Nav1.8 Gmax = 369 nS. Shown are Nav1.7WT (black lines), Nav1.7WT/LH (red lines), and Nav1.8 (blue lines) (Nav1.8 first peak of −6.6 nA at 18.8 ms is off-scale); Nav1.7WT/LH current was calculated by 0.5*(INav1.7WT + INav1.7LH). Here and thereafter, amplitudes of the modeled currents were matched by choosing the model’s maximal conductance as appropriate, to the respective amplitudes of native sodium currents recorded from small DRG neurons. All presented Hodgkin–Huxley variables, their products (m3hs), and the resultant ionic currents were calculated in silico by APsim software.
Figure S1.
Figure S1.
Comparative voltage-clamp analysis of previously published Nav1.7 and Nav1.8 kinetic models. (A and B) Shown are families of Nav1.7WT (A) and Nav1.8 (B) kinetic model currents evoked from −80 mV holding potential by test voltages applied from −60 to 80 mV in 5 mV increments. (C) Traces of activation (m3) and inactivation (h, s) variables, open channel probabilities m3hs (C, left panel), and the respective current traces (C, right panel) of the Nav1.7WT (black lines) and Nav1.8 (blue lines, s = 1) channel kinetic models; currents were evoked using voltage protocol described in A at −10 mV test voltage. Sodium currents were derived from the equation INa = Gmax*m3*h*s*(Vm−ENa), where m is activation variable, h and s are inactivation variables (s = 1 for Nav1.8 channel), Gmax is maximal conductance, Vm is membrane voltage, ENa = 65 mV is sodium reversal potential, Nav1.7 Gmax = Nav1.8, and Gmax = 250 nS. The presented Hodgkin–Huxley variables, their products (m3hs), and the resultant ionic currents were calculated in silico from the respective Hodgkin–Huxley equations by APsim software with 10-μs precision. (D) I–V plots of peak amplitudes of Nav1.7 (black symbols) and Nav1.8 (blue symbols) sodium currents presented in A and B.
Figure 2.
Figure 2.
Introduction to a dynamic clamp model of small DRG neuron hyperexcitability. (A) Representative dynamic clamp recordings of APs evoked in small DRG neurons by 10-ms long current pulses, at rheobase, in control (black trace, 500 pA rheobase), in the Nav1.7WT/LH model (red trace, 200 pA rheobase), and in the Nav1.7WT/LH model after dynamic-clamp subtraction of 25% Nav1.8 conductance (blue trace, 400 pA rheobase). (B and C) Nav1.7 (B) and Nav1.8 (C) channel open probabilities m3*h*s during respective APs shown in A; s = 1 for Nav1.8 channel. D and E shown are rates of change of APs presented in A. (F and G) The resultant Nav1.7 (F) and Nav1.8 (G) sodium currents (Nav1.7 Gmax = 586 nS and Nav1.8 Gmax = 294 nS) during respective APs are presented in control (black lines), in the Nav1.7WT/LH model (red lines), and in the Nav1.7WT/LH model after dynamic-clamp subtraction of 25% Nav1.8 conductance. To achieve a 50% substitution ratio, 50% of the native Nav1.7 conductance was replaced with an equivalent amount of Nav1.7L858H channel conductance using dynamic-clamp techniques, denoted as 0.5Gmax (LH-WT), where Gmax represents the maximum native Nav1.7 conductance (this model is denoted above as Nav1.7WT/LH). Nav1.7WT/LH current was calculated by 0.5*(INav1.7WT + INav1.7LH). All shown Hodgkin–Huxley variables, their products (m3hs), and the resultant ionic currents were calculated in silico by APsim software.
Figure 3.
Figure 3.
Functional interplay between Nav1.7 and Nav1.8 channels at subthreshold membrane voltages and during APs in small DRG neurons. (A) Current-clamp recordings from small DRG neuron (same cell as shown in Fig. 2) in control. Shown is subthreshold membrane response to 450 pA current stimulus (A, top left panel) and AP evoked by the rheobase stimulus of 500 pA (A, top right panel); Nav1.7 (A, bottom panels, black trace, Gmax = 586 nS) and Nav1.8 (A, bottom panels, blue trace, Gmax = 294 nS) currents were calculated for the respective traces of membrane voltages shown on top. (B) Dynamic clamp recordings from the same neuron after induction of the Nav1.7WT/LH model. The subthreshold stimulus was 150 pA (B, left panel) and the rheobase stimulus was 200 pA (B, right panel). Nav1.7WT/LH (red) and Nav1.8 (blue) currents are shown below the respective membrane voltages. (C and D) Same as in B but after dynamic-clamp subtraction of 25% (C) (subthreshold stimulus 350 pA, rheobase 400 pA) and 50% (D) (subthreshold stimulus 550 pA, rheobase 600 pA) of Nav1.8 conductance. Step current stimuli were applied from 10 to 20 ms time point (10 ms duration), IST denotes stimuli strength, and all presented ionic currents were calculated in silico by APsim software.
Figure 4.
Figure 4.
Effect of dynamic clamp subtraction of Nav1.8 conductance on rheobase, voltage threshold, RMP, and AP overshoot in Nav1.7WT/LH model of small DRG neuron hyperexcitability. (A–D) Rheobase (A), voltage threshold (B), RMP (C), and AP overshoot (D) in small DRG neurons before (black symbols) and after (red symbols) dynamic clamp introduction of the Nav1.7WT/LH model in control (red symbols) and after (blue symbols) dynamic clamp subtraction of Nav1.8 conductance. Data (means ± SEM, n = 17–20) are presented in absolute values as well as in the respective deltas. Statistical analysis was performed using One-Way ANOVA (*P < 0.05; **P < 0.01, ***P < 0.001).
Figure 5.
Figure 5.
Nav1.8 activity affects AP firing probability in Nav1.7WT/LH IEM neuronal model of hyperexcitability. (A–D) Representative recordings of small DRG neuron AP firing in response to 20 10-ms long depolarizing current steps applied at 10 Hz at a subthreshold 100 pA (A) and 250 pA (B), at threshold 400 pA (C), and at suprathreshold 550 pA (D) stimuli in control (first column), in the Nav1.7WT/LH model (second column) and the Nav1.7WT/LH model after 50% reduction of Nav1.8 conductance (third column). The stability of the experiment was assessed by repeating control recordings at the end of the experiment (fourth column).
Figure 6.
Figure 6.
Nav1.8 subtraction alleviates the heightened AP firing probability in the Nav1.7WT/LH model of neuronal hyperexcitability. (A–C) Representative recordings of small DRG neuron AP firing in response to 20 10-ms long current threshold steps applied at 10 Hz in control (A), in the Nav1.7WT/LH model (B), and in the Nav1.7WT/LH model with 50% Nav1.8 subtraction (C). (D) Average number of APs fired by small DRG neurons in response to repetitive stimuli of threshold intensity in a population of nine small DRG neurons. AP firing at threshold stimuli was averaged for control recordings, for recordings in the Nav1.7WT/LH model, and the Nav1.7WT/LH model with 25% and 50% Nav1.8 subtraction, as indicated. Data are means ± SEM, n = 9. Statistical analysis was performed using One-Way ANOVA (*P < 0.05).
Figure 7.
Figure 7.
Dynamic clamp subtraction of Nav1.8 conductance abrogates spontaneous AP firing in IEM Nav1.7L858H model of neuronal hyperexcitability. (A) Left panel, recordings showing bursts of spontaneous AP firing upon induction of the Nav1.7WT/LH model (timing of model induction is indicated by solid lines on top). Middle panel, same as in A, shown is an expanded view of the first 2 s after induction of the Nav1.7WT/LH model. Right panel, same as in A, shows a zoomed view to better visualize membrane potential oscillations during the 3-s time interval. (B and C) Same neuron, recordings in the Nav1.7WT/LH model after 25% (B) and 50% (C) subtraction of Nav1.8 conductance. (D) Same as in A, shown are control recordings in the Nav1.7WT/LH model performed at the end of the experiment to ensure experiment stability. Note spindle-like events of 500–700 ms duration, each spindle is composed of 5–10 ripples of different amplitudes at 12–15 Hz (A–D, right panels, shown by arrows). Time intervals when models were ON are denoted by solid lines on top. Nav1.7 Gmax = 686 nS and Nav1.8 Gmax = 330 nS.
Figure 8.
Figure 8.
Nav1.8 regulates amplitude but not frequency of subthreshold membrane potential oscillations in Nav1.7WT/LH model of DRG neuron hyperexcitability. (A) Power spectrum of membrane potential oscillations (data presented in Fig. 7) recorded at baseline when the dynamic clamp models were OFF (black trace) and during active Nav1.7WT/LH model in control (red trace) and after subtraction of 100% Nav1.8 (blue trace). (B) Distribution-and-rug plot of probabilities and peak-to-peak amplitudes of spontaneous events in the Nav1.8WT/LH model in control (blue line) and after subtraction of 50% Nav1.8 conductance. (C) Violin plots of peak-to-peak amplitudes of subthreshold membrane potential oscillations in the Nav1.7WT/LH model of neuronal hyperexcitability. The average peak-to-peak amplitude of membrane potential oscillations in the Nav1.7WT/LH model was 2.8 ± 1.4 mV (mean ± SD, n = 338) in control and was significantly reduced to 2.16 ± 0.95 mV (mean ± SD, n = 323) and to 2.17 ± 0.99 mV (mean ± SD, n = 334) after 50% and 100% Nav1.8 conductance subtraction, respectively. Nav1.7 Gmax = 686 nS and Nav1.8 Gmax = 330 nS. Statistical analysis across different conditions was performed by one-way ANOVA followed by post-hoc Tukey’s test (***P < 0.001).
Figure 9.
Figure 9.
Dynamic-clamp addition of Nav1.8 conductance enhances subthreshold membrane potential oscillations in IEM Nav1.7L858H model of DRG neuron hyperexcitability. (A) Left panel, recordings of neuronal membrane response to induction of Nav1.7WT/LH model (timing of model induction is indicated by solid lines on top). Middle panel, same as in A, shown is an expanded view of first 2 s after induction of the Nav1.7WT/LH model. Right panel, same as in A, shown is a zoomed view to better visualize membrane potential oscillations during a 3-s time interval. (B and C) Same neuron, recordings in the Nav1.7WT/LH model after 50% (B) and 100% (C) addition of Nav1.8 conductance. Note spindle-like events (B and C, right panels, shown by arrows) that are similar to the events previously shown in Fig. 7. Time intervals when models were ON are denoted by solid lines on top. Nav1.7 Gmax = 681 nS and Nav1.8 Gmax = 369 nS. (D) Power spectrum of membrane potential oscillations recorded at baseline when dynamic-clamp models were OFF (black trace) and during active Nav1.7WT/LH model in control (red trace) and after addition of 50% (green trace) or 100% (blue trace) Nav1.8 conductance. (E) Peak-to-peak amplitudes of spontaneous events in the Nav1.8WT/LH model of neuronal hyperexcitability with only endogenous Nav1.8 (red symbols) and after dynamic addition of 100% Nav1.8 conductance, while endogenous Nav1.8 is still present (blue symbols). The dotted lines represent mean ± 3σ of peak-to-peak amplitudes of membrane potential oscillations in the Nav1.7WT/LH model with only endogenous Nav1.8 present. Average peak-to-peak amplitude of membrane potential oscillations in the Nav1.7WT/LH model was 0.63 ± 0.15 mV (mean ± SD, n = 237) in control and was significantly enhanced to 0.94 ± 0.32 mV (mean ± SD, n = 179, P < 0.001) and 1.11 ± 0.52 mV (mean ± SD, n = 190, P < 0.001) after addition of 50% and 100% Nav1.8 conductance, respectively. Statistical analysis across different conditions was performed by one-way ANOVA followed by post-hoc Tukey’s test.

References

    1. Akopian, A.N., Sivilotti L., and Wood J.N.. 1996. A tetrodotoxin-resistant voltage-gated sodium channel expressed by sensory neurons. Nature. 379:257–262. 10.1038/379257a0 - DOI - PubMed
    1. Akopian, A.N., Souslova V., England S., Okuse K., Ogata N., Ure J., Smith A., Kerr B.J., McMahon S.B., Boyce S., et al. . 1999. The tetrodotoxin-resistant sodium channel SNS has a specialized function in pain pathways. Nat. Neurosci. 2:541–548. 10.1038/9195 - DOI - PubMed
    1. Alles, S.R.A., and Smith P.A.. 2021. Peripheral voltage-gated cation channels in neuropathic pain and their potential as therapeutic targets. Front. Pain Res. 2:750583. 10.3389/fpain.2021.750583 - DOI - PMC - PubMed
    1. Alsaloum, M., Higerd G.P., Effraim P.R., and Waxman S.G.. 2020. Status of peripheral sodium channel blockers for non-addictive pain treatment. Nat. Rev. Neurol. 16:689–705. 10.1038/s41582-020-00415-2 - DOI - PubMed
    1. Alsaloum, M., Labau J.I.R., Liu S., Estacion M., Zhao P., Dib-Hajj F., and Waxman S.G.. 2021. Contributions of NaV1.8 and NaV1.9 to excitability in human induced pluripotent stem-cell derived somatosensory neurons. Sci. Rep. 11:24283. 10.1038/s41598-021-03608-x - DOI - PMC - PubMed

Substances

LinkOut - more resources