. 2025 Apr 3;148(4):1258-1270.
doi: 10.1093/brain/awae312.

Somatic instability of the FGF14-SCA27B GAA•TTC repeat reveals a marked expansion bias in the cerebellum

Affiliations

Somatic instability of the FGF14-SCA27B GAA•TTC repeat reveals a marked expansion bias in the cerebellum

David Pellerin et al. Brain. .

Abstract

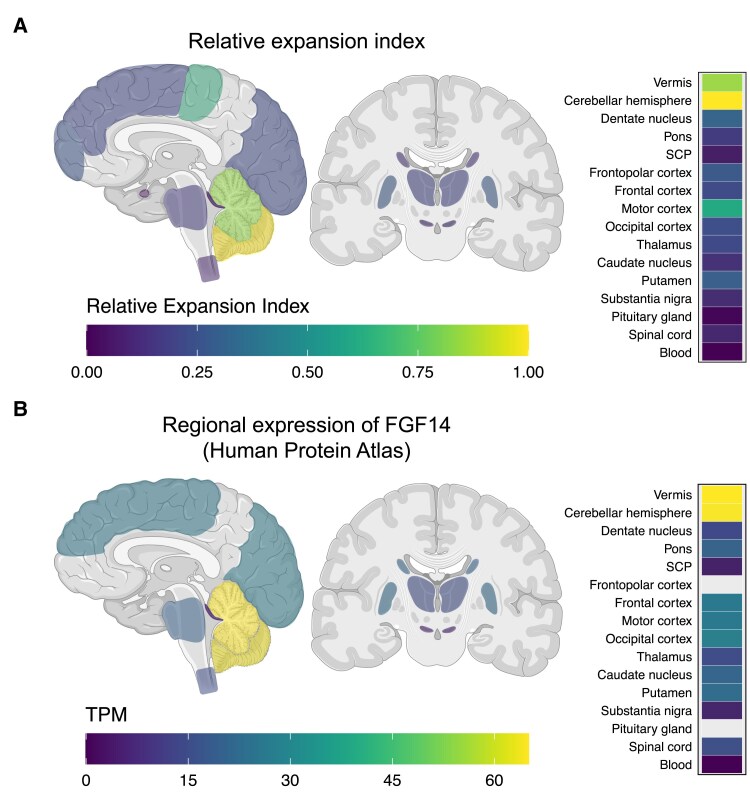
Spinocerebellar ataxia 27B (SCA27B) is a common autosomal dominant ataxia caused by an intronic GAA•TTC repeat expansion in FGF14. Neuropathological studies have shown that neuronal loss is largely restricted to the cerebellum. Although the repeat locus is highly unstable during intergenerational transmission, it remains unknown whether it exhibits cerebral mosaicism and progressive instability throughout life. We conducted an analysis of the FGF14 GAA•TTC repeat somatic instability across 156 serial blood samples from 69 individuals, fibroblasts, induced pluripotent stem cells and post-mortem brain tissues from six controls and six patients with SCA27B, alongside methylation profiling using targeted long-read sequencing. Peripheral tissues exhibited minimal somatic instability, which did not significantly change over periods of more than 20 years. In post-mortem brains, the GAA•TTC repeat was remarkably stable across all regions, except in the cerebellar hemispheres and vermis. The levels of somatic expansion in the cerebellar hemispheres and vermis were, on average, 3.15 and 2.72 times greater relative to other examined brain regions, respectively. Additionally, levels of somatic expansion in the brain increased with repeat length and tissue expression of FGF14. We found no significant difference in methylation of wild-type and expanded FGF14 alleles in post-mortem cerebellar hemispheres between patients and controls. In conclusion, our study revealed that the FGF14 GAA•TTC repeat exhibits a cerebellar-specific expansion bias, which may explain the pure cerebellar involvement in SCA27B.

Keywords: GAA-FGF14 ataxia; SCA27B; mosaicism; repeat expansion; repeat expansion disorder; spinocerebellar ataxia 27B.


Conflict of interest statement

I.W.D. manages a fee-for-service sequencing facility at the Garvan Institute of Medical Research that is a customer of Oxford Nanopore Technologies but has no further financial relationship. I.W.D. has previously received travel and accommodation expenses to speak at Oxford Nanopore Technologies conferences. M.N. received consultancy honoraria from Reata Pharmaceuticals unrelated to this work. L.M.P. received consultancy honoraria from Biogen unrelated to this work. S.Z. has received consultancy honoraria from Neurogene, Aeglea BioTherapeutics, Applied Therapeutics, and is an unpaid officer of the TGP foundation, all unrelated to the present manuscript. A.D. serves as an advisor at Critical Path Ataxia Therapeutics Consortium and her Institution (Paris Brain Institute) receives consulting fees on her behalf from Biogen, Huntix, UCB, as well as research grants from the NIH, ANR and holds partly a Patent B 06291873.5 on ‘Anaplerotic therapy of Huntington disease and other polyglutamine diseases’. All other authors report no competing interests.

Figures

Figure 1
Figure 1
Determination of the FGF14 GAA•TTC repeat expansion index. Method for calculating the expansion index of the FGF14 GAA•TTC repeat. The expansion index is calculated by only taking into account peaks to the right of the modal allele, which represent somatically expanded GAA•TTC repeats, and using a 1% relative peak threshold. The modal allele corresponds to the peak with the highest intensity, as measured in relative fluorescence units in GeneMapper or Peak Scanner. The expansion index is calculated by first dividing the height of each individual peak by the sum of the heights of all peaks to the right of the modal allele that are above the set 1% threshold. The resulting normalized peak heights are then multiplied by the position of the peak (change from the modal allele) and these values are summed to generate the index.
Figure 2
Figure 2
Longitudinal analysis of the FGF14 GAA•TTC repeat somatic instability in blood samples. Longitudinal analysis of (A) the FGF14 GAA•TTC repeat tract size, expressed in triplet repeat counts, and (B) expansion index across 69 individuals (120 alleles analysed) who underwent serial blood collections over a median period of 8.9 years (interquartile range: 2.9–13.9). Observations from the same person are connected by a line. In B, the colour gradient shows the GAA•TTC allele size of each data point. (C) Positive linear relationship between the FGF14 GAA•TTC repeat tract size, expressed in triplet repeat counts, and expansion index in each of the first and last longitudinal blood samples across 69 individuals (n = 120 alleles). The Pearson’s correlation coefficient is r = 0.73 [95% confidence interval (CI): 0.64–0.81] for the first blood samples and r = 0.84 (95% CI: 0.78–0.89) for the last blood samples. Both regression lines did not differ significantly (mixed-effect analysis, P = 0.72), indicating relative stability of the expansion index over time. (D) Positive linear relationship between the FGF14 GAA•TTC repeat tract size and expansion index across 100 individuals (n = 173 alleles), including the results from the last blood samples of the 69 individuals featured in B and C. The Pearson’s correlation coefficient is r = 0.85 (95% CI: 0.80–0.88). In C and D, the shaded areas display the 95% CI.
Figure 3
Figure 3
Somatic instability profile of the FGF14 GAA•TTC repeat in brain regions. (A) Somatic instability profiles of the FGF14 GAA•TTC repeat in different brain regions, derived from post-mortem samples of six non-ataxic control and three patients with SCA27B. Each plot shows the average instability profile for each of the two alleles within a given brain region, calculated from replicate PCR reactions. For regions where multiple tissue samples were analysed, results for each sample are shown individually. Profiles were plotted by normalizing individual peak height data to the height of the modal allele within each brain region, except for SCA27B cases P1 and P3, where data were normalized to the height of the shorter modal allele due to the lack of significant size difference with the longer allele. Peaks left of the modal allele above a 10% threshold and those right of the modal allele above a 1% threshold were plotted. Vertical dashed black lines indicate the size of the modal alleles measured in the blood and/or non-cerebellar regions, while vertical dashed red and orange lines indicate the size of the modal alleles measured in the vermis and cerebellar hemispheres, respectively. Individual instability profiles in each region are shown in Supplementary Figs 8–16. (B) Schematic representation of the various brain regions analysed for somatic instability in this study. The same colour scheme is used to represent the brain regions and their corresponding instability profiles shown in A. Panel created with BioRender.com.
Figure 4
Figure 4
Expansion index of the FGF14 GAA•TTC repeat in brain regions. Schematic representation of (A) the relative expansion index and (B) the regional expression of FGF14 normal tissue expression data in transcripts per million (TPM) from the Human Protein Atlas across the analysed brain regions shown in Fig. 3. Expansion indices for each brain region were normalized relative to those in the cerebellar hemispheres. The relative expansion indices were calculated by averaging the relative expansion index of each allele, excluding (GAA)9 alleles, which did not exhibit somatic expansion. A corresponding heat map of the results for each region is shown on the right. Expression data were not available for the frontopolar cortex and the pituitary gland. Figure created with BioRender.com.
Figure 5
Figure 5
FGF14 GAA•TTC repeat lengths in brain regions of SCA27B patients. (A) Distribution of FGF14 GAA•TTC repeat lengths, expressed in triplet repeat counts, across post-mortem brain regions and blood samples in the six SCA27B patients included in this study. For brain regions where multiple tissue samples were analysed, only the results of the sample with the largest allele size are shown. Observations for each of the two alleles from the same patient are connected by a dashed line. (B) Comparison of FGF14 GAA•TTC repeat lengths in blood samples (x-axis) versus cerebellar hemispheres (y-axis) for five SCA27B patients and eight controls with available tissue samples. The dashed black line represents the identity line. In A and B, a single modal allele size is shown for patient P1 due to the complete blending of the instability profiles for the short and long alleles in the cerebellar hemispheres and vermis (Supplementary Fig. 33), preventing the identification of the two distinct modal peaks in these tissues.
Figure 6
Figure 6
Methylation profiling of the FGF14 gene in post-mortem cerebellum. Methylation analysis of the FGF14 gene in post-mortem cerebellar hemispheres from four controls (C15–C18) and four patients with SCA27B (P1, P2, P3, P7) using programmable targeted long-read sequencing with Oxford Nanopore Technologies. (A) Methylation profiles, expressed as 5′-methylcytosine (5mC) methylation frequencies, at all CpG sites within the FGF14 locus (T2T-CHM13, chr13:100923763-101619864) in the four control and four patient post-mortem cerebellar hemispheres. A diagram of the FGF14 gene with its two putative promoters (P1: promoter 1 and P2: promoter 2) is shown at the bottom. (B) Plots show the distribution of 5mC methylation frequencies at all CpG sites within the FGF14 locus (top), the first promoter (middle) and second promoter (bottom). The horizontal black bars show the median 5mC methylation frequency.

Update of

References

    1. Pellerin D, Danzi MC, Wilke C, et al. Deep intronic FGF14 GAA repeat expansion in late-onset cerebellar ataxia. N Engl J Med. 2023;388:128–141. - PMC - PubMed
    1. Rafehi H, Read J, Szmulewicz DJ, et al. An intronic GAA repeat expansion in FGF14 causes the autosomal-dominant adult-onset ataxia SCA27B/ATX-FGF14. Am J Hum Genet. 2023;110:1018. - PMC - PubMed
    1. Wilke C, Pellerin D, Mengel D, et al. GAA-FGF14 ataxia (SCA27B): Phenotypic profile, natural history progression and 4-aminopyridine treatment response. Brain. 2023;146:4144–4157. - PubMed
    1. Méreaux JL, Davoine CS, Pellerin D, et al. Clinical and genetic keys to cerebellar ataxia due to FGF14 GAA expansions. EBioMedicine. 2024;99:104931. - PMC - PubMed
    1. Pellerin D, Heindl F, Wilke C, et al. GAA-FGF14 disease: Defining its frequency, molecular basis, and 4-aminopyridine response in a large downbeat nystagmus cohort. EBioMedicine. 2024;102:105076. - PMC - PubMed

Substances