. 2024 Nov 12;57(11):2497-2513.e12.
doi: 10.1016/j.immuni.2024.09.004. Epub 2024 Oct 7.

Type I IFN drives unconventional IL-1β secretion in lupus monocytes

Affiliations

Type I IFN drives unconventional IL-1β secretion in lupus monocytes

Simone Caielli et al. Immunity. .

Abstract

Opsonization of red blood cells that retain mitochondria (Mito+ RBCs), a feature of systemic lupus erythematosus (SLE), triggers type I interferon (IFN) production in macrophages. We report that monocytes (Mos) co-produce IFN and mature interleukin-1β (mIL-1β) upon Mito+ RBC opsonization. IFN expression depended on cyclic GMP-AMP synthase (cGAS) and RIG-I-like receptors' (RLRs) sensing of Mito+ RBC-derived mitochondrial DNA (mtDNA) and mtRNA, respectively. Interleukin-1β (IL-1β) production was initiated by the RLR antiviral signaling adaptor (MAVS) pathway recognition of Mito+ RBC-derived mtRNA. This led to the cytosolic release of Mo mtDNA, which activated the inflammasome. Importantly, mIL-1β secretion was independent of gasdermin D (GSDMD) and pyroptosis but relied on IFN-inducible myxovirus-resistant protein 1 (MxA), which facilitated the incorporation of mIL-1β into a trans-Golgi network (TGN)-mediated secretory pathway. RBC internalization identified a subset of blood Mo expressing IFN-stimulated genes (ISGs) that released mIL-1β and expanded in SLE patients with active disease.

Keywords: MxA; NLRP3; inflammasome; monocytes; red blood cells; systemic lupus erythematosus; type I interferon.


Conflict of interest statement

Declaration of interests V.P. has received consulting honoraria from Sanofi, Astra Zeneca, Regeneron, and Moderna and is the recipient of a research grant from Sanofi and a contract from Astra Zeneca. J.F.B. is an employee of Immunoledge LLC. V.P. and J.F.B. receive royalties for use of Canakinumab in sJIA.

Figures
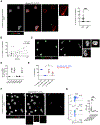
Figure 1.
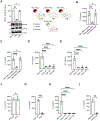
Figure 1.. Erythrophagocytic Mo co-expressing IL-1β and ISGs are expanded in active SLE.
A, Confocal image (left) and quantification (right) of classical Mo stained with IL-1β and MxA antibodies (SLE n=20; JDM n=8). Scale bar: 20 μm. B, Two-tailed Pearson’s correlation between SLEDAI and the percentage of IL-1β+ ISGs+ Mo (n=20). Dashed lines represent 95% confidence intervals. Each dot represents a study participant sample that was processed, stained and analyzed independently. C, Confocal images of secreted mIL-1β from classical Mo sorted from SLE patient. Slides were coated with anti-mIL-1β capture antibody and mitochondria were stained with MitoTracker Deep Red (MTDR). Scale bar: 20 μm. D, Percentages of mIL-1β+ MTDR+ Mo from SLE patients (n=6). Each dot represents the count from different microscopy fields from a study participant sample that was processed, stained, and analyzed independently. E, Percentage of IL-1β MxA+ Mo and IL-1β+ MxA+ Mo in SLE patients without (blue, n=8) or with (red, n=6) circulating Mito+ RBCs. F, Confocal images of classical Mo isolated from SLE patients showing evidence of erythrophagocytosis. GPA: Glycophorin A. Scale bar: 20 μm. G, Flow cytometry anaylsis, of intracellular GPA, in SLE (n=18) and HD (n=4) blood Mo, gated as CD3 CD19 HLADR+ CD11c CD123 cells.
Figure 2.
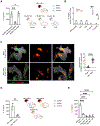
Figure 2.. Internalization of opsonized Mito+ RBCs triggers Type I IFNs and IL-1β production in human Mo.
A, Heat map of differentially expressed genes in blood Mo that phagocytized either Mito or Mito+ RBCs. Data are normalized to Mito RBCs sample. B, Concentrations of IP-10 and IL-1β in the supernatants of blood Mo cultured with media, Mito or Mito+ RBCs. (n=6). C, Immunoblot analysis of whole cell lysate (WCL) and supernatants (Sup) from blood Mo that were treated as described. One representative of two independent experiments. D, Concentrations of IP-10 and IL-1β in the supernatants of bone marrow (BM) Mo cultured with media, Mito or Mito+ opsonized RBCs. (n=3). E, Heat map of differentially expressed genes in BLaER1 Mo that phagocytized Mito or Mito+ RBCs. Data are normalized to Mito RBCs sample. F, Concentrations of IP-10 and IL-1β in the supernatants of BLaER1 Mo cultured with media, Mito or Mito+ RBCs. (n=4). G, Immunoblot analysis of WCL and Sup from BLaER1 Mo that were treated as described. One representative of three independent experiments.
Figure 3.
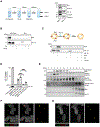
Figure 3.. Mito+ RBCs-derived NAs trigger cGAS-dependent IFN and NLRP3-dependent IL-1β production in human Mo.
A, Relative mtDNA abundance and Western blot analysis of Mito+ RBCs generated with vehicle, ethidium bromide (EtBr; ρ0) or chloramphenicol (CAM). (n=3). The experimental scheme is also shown. B, Concentrations of IP-10 in the supernatants of BLaER1 Mo activated with Mito+ RBCs generated in the presence of vehicle, EtBr (ρ0) or CAM. (n=4). C, Concentrations of IL-1β in the supernatants of Mito+ RBCs-activated wild type, Cgas−/− or Sting1−/− BLaER1 Mo. (n=3). D, Concentrations of IP-10 in the supernatants of Mito+ RBCs-activated wild type or Cgas−/− BLaER1 Mo. (n=3). E, Concentrations of IP-10 in the supernatants of Mito+ RBCs-activated wild type or Sting1−/− BLaER1 Mo. (n=3). F, Concentrations of IL-1β in the supernatants of Mito+ RBCs-activated wild type or Aim2−/− BLaER1 Mo. (n=3). Concentrations of IL-1β in the supernatants of Mito+ RBCs-activated Nlrp−/− (G), Casp1−/− (H) or Pycard−/− (I) BLaER1 Mo. (n=3).
Figure 4.
Figure 4.. Mito+ RBC-derived mtDNA binds cGAS while Mo-derived mtDNA binds NLRP3.
A, Confocal images of BLaER1 Mo that were treated with media or with 5-ethynyl-2-deoxyuridine (EdU)-labelled Mito+ RBCs (Mito+ RBCsEdu) and then stained for the phagolysosomal marker LAMP1. Scale bars, 20 μm. Quantification of cytosolic mtDNA (LAMP1 EdU+ speckles per cell) is also shown. (n=20 cells). B, Dot blot-Western blot analysis (left), experimental scheme (middle) and quantification (right) of Mito+ RBCs (lanes 1 - 3) or BLaER1 Mo (lanes 2 – 4) labeled with 5-bromo-2-deoxyuridine (BrdU) and then immunoprecipitated (IP) with cGAS or NLRP3 antibodies. As a loading control, cGAS or NLRP3 immunoblot or double-stranded DNA (dsDNA) dot blot (DB) was performed. A.U.: Arbitrary Units. C, Western blot analysis of cytosolic fraction obtained from media, Mito+ RBCs- or dsDNA/Lyovec-activated BLaER1 Mo. WCL: whole cell lysate. One representative of two independent experiments. D, Quantification of lactate dehydrogenase (LDH) release (left) or propidium iodide (PI) internalization (right) in BLaER1 Mo activated with Media, Mito+ RBCs or dsDNA/Lyovec at different time points. (n=3).
Figure 5.
Figure 5.. Mito+ RBC-derived mtRNA triggers the release of Mo-derived mtDNA fragments.
A, Experiment scheme and IL-1β concentrations in the supernatants of BLaER1 Mo, generated in the presence of vehicle, EtBr (ρ0) or CAM and activated with Mito+ RBCs. (n=4). B, Expression of mtDNA-encoded genes in NLRP3 immunocomplexes isolated from Mito+ RBC-activated BLaER1 Mo. (n=3). C, Confocal images of EdU-labeled BLaER1 Mo (BLaER1 MoEdu) that were treated with medium or Mito+ RBCs and then co-stained for the mitochondrial marker TOMM20. Scale bars, 20 μm. Quantification of cytosolic mtDNA (TOMM20 EdU+ speckles per cell) is also shown. (n=20 cells). D, Experiment scheme and cytokine concentrations in the supernatants of BLaER1 Mo cultured with Mito+ RBCs generated in the presence of Actinomycin D (Mito+ RBCsAct D). (n=4). E, Concentrations of IL-1β in the supernatants of Mito+ RBCs-activated wild type, Mavs−/− or Rigi−/− Ifih1−/− BLaER1 Mo. (n=3).
Figure 6.
Figure 6.. Mito+ RBCs induced mIL-1β secretion requires MxA but not pyroptosis or gasdermin-D pores.
A, Western blot analysis of gasdermin-D ~30 KDa N-terminal fragment (GSDMD-N30) in total cell lysate isolated from Mito+ RBCs, Poly I:C/Lyovec and Nigericin-activated BLaER1 Mo. B, Quantification of lactate dehydrogenase (LDH) release or propidium iodide (PI) internalization in BLaER1 Mo activated with Media, Mito+ RBCs, Poly I:C/Lyovec or Nigericin at different time points. (n=3). C, Western blot analysis of Gsdmd−/− BLaER1 cells. (left). Concentrations of IL-1β in the supernatants from Mito+ RBCs, Poly I:C/Lyovec and Nigericin-activated wild type or Gsdmd−/− BLaER1 Mo (right). (n=3). D, Concentrations of IL-1β in the supernatants from Mito+ RBCs, Poly I:C/Lyovec and Nigericin-activated Blood Mo in the presence of disulfiram. (n=3). E, Confocal images of SLE classical Mo stained for IL-1β and MxA. Scale bar: 20 μm. F, Concentrations of IL-1β in the supernatants from Mito+ RBCs, Poly I:C/Lyovec and dsDNA/Lyovec-activated wild type or Mxa−/− BLaER1 Mo. (n=3). G, Western blot analysis of GSDMD in total cell lysate isolated from Mito+ RBCs or Nigericin-activated iPSC Mo. One representative of two independent experiments. H, Flow cytometry analysis of CD14 expression in wild type or Mxa−/− iPSC at day 9 or 17 post-differentiation into Mo. I, Concentrations of IL-1β in the supernatants from Mito+ RBCs or Nigericin-activated wild type or Mxa−/− iPSC Mo. (n=3).
Figure 7.
Figure 7.. MxA oligomerization promotes the translocation of mIL-1β within the TGN.
A, Experimental scheme (left) and Western blot analysis (right) of the microsomal pellet (100k P) and postmicrosomal supernatant (100k S) isolated from Poly I:C/Lyovec-activated BLaER1 Mo. B, Proteinase K (PK) protection assay of the membrane fraction isolated from Poly I:C/Lyovec-activated wild type or Mxa−/− BLaER1 Mo. TX100: Triton X-100. C, Experimental scheme (top) and Western blot analysis (bottom) of the in vitro proteoliposomes (PtLp)-based transport assay. One representative of two independent experiments. D, Immunoblot analysis of mIL-1β present within liposomes (pellet), or supernatants (sup) after ultracentrifugation of liposomes that were treated with buffer or recombinant human MxA for 0 (control), 30 and 120 min. Densitometry quantification of Western blot band density for mIL-1β release from liposomes is also shown. (n=3). E, Western blot analysis of different fractions collected after sucrose fractionation of microsomal membranes isolated from Poly I:C/Lyovec-activated BLaER1 Mo. One representative of three independent experiments. ER: endoplasmic reticulum; ERGIC: ER-Golgi intermediate compartment. Confocal images of Poly I:C/Lyovec-activated BLaER1 Mo stained for TNG46 and MxA (F) or TGN46 and IL-1β (G). Scale bar: 20 μm.

Comment in

References

    1. Tsokos GC (2011). Systemic lupus erythematosus. The New England journal of medicine 365, 2110–2121. 10.1056/NEJMra1100359. - DOI - PubMed
    1. Banchereau R, Hong S, Cantarel B, Baldwin N, Baisch J, Edens M, Cepika AM, Acs P, Turner J, Anguiano E, et al. (2016). Personalized Immunomonitoring Uncovers Molecular Networks that Stratify Lupus Patients. Cell 165, 551–565. 10.1016/j.cell.2016.03.008. - DOI - PMC - PubMed
    1. Morand EF, Furie R, Tanaka Y, Bruce IN, Askanase AD, Richez C, Bae SC, Brohawn PZ, Pineda L, Berglind A, et al. (2020). Trial of Anifrolumab in Active Systemic Lupus Erythematosus. N Engl J Med 382, 211–221. 10.1056/NEJMoa1912196. - DOI - PubMed
    1. Ronnblom L, Alm GV, and Eloranta ML (2011). The type I interferon system in the development of lupus. Semin Immunol 23, 113–121. 10.1016/j.smim.2011.01.009. - DOI - PubMed
    1. Means TK, Latz E, Hayashi F, Murali MR, Golenbock DT, and Luster AD (2005). Human lupus autoantibody-DNA complexes activate DCs through cooperation of CD32 and TLR9. J Clin Invest 115, 407–417. 10.1172/JCI23025. - DOI - PMC - PubMed

Publication types

MeSH terms