. 2024 Nov 20;44(47):e1353242024.
doi: 10.1523/JNEUROSCI.1353-24.2024.

Different Subregions of Monkey Lateral Prefrontal Cortex Respond to Abstract Sequences and Their Components

Affiliations

Different Subregions of Monkey Lateral Prefrontal Cortex Respond to Abstract Sequences and Their Components

Nadira Yusif Rodriguez et al. J Neurosci. .

Abstract

Sequential information permeates daily activities, such as when watching for the correct series of buildings to determine when to get off the bus or train. These sequences include periodicity (the spacing of the buildings), the identity of the stimuli (the kind of house), and higher-order more abstract rules that may not depend on the exact stimulus (e.g., house, house, house, business). Previously, we found that the posterior fundus of area 46 in the monkey lateral prefrontal cortex (LPFC) responds to rule changes in such abstract visual sequences. However, it is unknown if this region responds to other components of the sequence, i.e., image periodicity and identity, in isolation. Further, it is unknown if this region dissociates from other, more ventral LPFC subregions that have been associated with sequences and their components. To address these questions, we used awake functional magnetic resonance imaging in three male macaque monkeys during two no-report visual tasks. One task contained abstract visual sequences, and the other contained no visual sequences but maintained the same image periodicity and identities. We found the fundus of area 46 responded only to abstract sequence rule violations. In contrast, the ventral bank of area 46 responded to changes in image periodicity and identity, but not changes in the abstract sequence. These results suggest a functional specialization within anatomical substructures of LPFC to signal different kinds of stimulus regularities. This specialization may provide key scaffolding to identify abstract patterns and construct complex models of the world for daily living.

Keywords: abstract sequence; fMRI; nonhuman primate; prefrontal cortex.


Conflict of interest statement

The authors declare no competing financial interests.

Figures

Figure 1.
Figure 1.
Sequence viewing task (SEQ) and No Sequence (NoSEQ) task structure. Both tasks are no-report. The monkey maintains fixation at the central fixation spot throughout both tasks. A, Example partial habituation block from SEQ task for sequence rule three same, one different (AAAB) and habituation timing templates. B, Example partial standard block from NoSEQ illustrating nonsequential image order and standard timing templates. C, Example stimuli pools (top) show a set of images that would be used in a single scanning session for both tasks (but termed differently depending on the task). NoSEQ additionally contains a novel images category, with different images not exemplified here. New images are used each session. Six possible habituation/standard event timing templates (bottom, left) and deviant/nonstandard event timing templates (bottom, right) illustrated with gray rectangles indicating individual image presentations. Total sequence/grouping durations are listed for each template type. D, Example SEQ run, with each bar indicating one multi-image sequence: four images in habituation, new items same rule (NISR), and rule deviants; two or six images in number and double deviants. Each block contains 30 sequences. The first block contains only habituation sequences and subsequent blocks (order counterbalanced) contain only one of the four deviant types in six out of the 30 sequences. E, Example NoSEQ run where there is no sequential order to the displayed images. Each bar indicates a multi-image set grouped by timing template and each block contains 30 image groupings. To parallel SEQ structure, the first block in NoSEQ contains only standard images and timing templates. In the two following blocks (order counterbalanced), six out of the 30 groupings have nonstandard timing templates. One block has four-image nonstandard timing (4NST) that parallels the rule deviant block in SEQ, and the other block has two- and six-image nonstandard timing (2/6NST) together to parallel the number deviant block in SEQ. Also, in the nonstandard blocks, 20% of the fractal images shown (in pseudorandom order) are nonstandard (indicated by miniaturized nonstandard fractals) and the rest standard, again to mirror the proportions in SEQ. Task-relevant blocks alternate with fixation blocks for both SEQ and NoSEQ tasks. In fixation blocks, monkeys maintained fixation on the fixation spot while no other images were displayed. Blue water droplets schematize reward delivery, which is decoupled from sequence viewing and delivered on a graduated schedule based on the duration the monkey has maintained fixation.
Figure 2.
Figure 2.
Schematic of anatomical subdivisions of area 46. A, Schematic of the area 46 subregions in the LPFC based on the atlas by Rapan et al. (2023) depicted on the right lateral surface of the macaque brain. B, Same cortical subregions illustrated in A with areas of comparison p46f and p46v in green and blue. Area p46d (light blue) shown only for context, indicated by gray lettering. C, Coronal slices displaying the area 46 ROI sphere used in Yusif Rodriguez et al. (2023) (red, outlined in black) superimposed on area 46 subregions. ROIs used for analysis in this study were green and blue, corresponding to regions illustrated in A. Light blue p46d only included for comparison and not used in analyses. Yellow voxels indicate overlap between the previous red sphere and current p46f ROI (green).
Figure 3.
Figure 3.
Right p46f and not p46v showed deviant responses in SEQ task. A, B, t values for the condition of interest > baseline are shown. Error bars are 95% confidence intervals (1.96 × standard error of the within-bin mean). A, Responses in rule deviants compared with new items, same rule (NISR) were different between p46f and p46v such that there was a significant main effect of ROI and a marginal interaction between ROI and condition (indicated with ∼). B, Number deviants compared with NISR between p46f and p46v showed a marginal main effect of ROI and significant interaction between ROI and condition. C, Voxel-wise contrast of Rule Deviants > NISR, false discovery rate (FDR) error cluster corrected for multiple comparisons (FDRc < 0.05, height p < 0.005 unc., extent = 100) are shown. D, Voxel-wise contrast of Number Deviants > NISR (FDRc < 0.05, height p < 0.005 unc., extent = 133) is shown. Color bar indicates t values in C and D.
Figure 4.
Figure 4.
Right p46v and not p46f showed different responses to timing templates in NoSEQ. A, B, t values for the condition of interest > baseline are shown. Error bars are 95% confidence intervals (1.96 × standard error of the within-bin mean). A, 4NST compared with standard timing between p46f and p46v shows a significant main effect of ROI and a marginal interaction between ROI and condition (indicated with ∼). B, 2/6NST compared with standard between p46f and p46v shows a significant main effect of ROI and interaction between ROI and condition (indicated with *). C, Voxel-wise contrasts of 4NST > Standard timing (Hot colors) false discovery rate (FDR) error cluster corrected for multiple comparisons (FDRc < 0.05, height p < 0.005 unc., extent = 84), overlaid with Standard timing > 4NST (Cold colors) false discovery rate (FDR) error cluster corrected for multiple comparisons (FDRc < 0.05, height p < 0.005 unc., extent = 204) are shown. D, Voxel-wise contrasts of 2/6NST > Standard timing (hot colors; FDRc < 0.05, height p < 0.005 unc., extent = 94), overlaid with Standard timing >2/6NST (cold colors; FDRc < 0.05, height p < 0.005 unc., extent = 104), are shown. Color bars indicate t values in C and D.
Figure 5.
Figure 5.
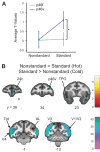
Right p46v and not p46f shows different responses to standard and nonstandard images in the NoSEQ task. t values for the condition of interest > baseline are shown. Error bars are 95% confidence intervals (1.96 × standard error of the within-bin mean). A, Nonstandard compared with standard images showing reliable differences between p46f and p46v showing a significant main effect of ROI with a significant interaction of ROI and condition (indicated with *). B, Voxel-wise contrasts of Nonstandard > Standard images false discovery rate (FDR) error cluster corrected for multiple comparisons (hot colors, FDRc < 0.05, height p < 0.005 unc., extent = 101), overlaid with Standard > Nonstandard image (cold colors, FDRc < 0.05, height p < 0.005 unc., extent = 88), are shown. Color bar indicates t values.

Update of

References

    1. Balan PF, Zhu Q, Li X, Niu M, Rapan L, Funck T, Wang H, Bakker R, Palomero-Gallagher N, Vanduffel W (2024) MEBRAINS 1.0: a new population-based macaque atlas. Imaging Neurosci 2:1–26. 10.1162/imag_a_00077 - DOI
    1. Bellet ME, Gay M, Bellet J, Jarraya B, Dehaene S, van Kerkoerle T, Panagiotaropoulos TI (2024) Spontaneously emerging internal models of visual sequences combine abstract and event-specific information in the prefrontal cortex. Cell Rep 43:113952. 10.1016/j.celrep.2024.113952 - DOI - PubMed
    1. Brett M, Anton JL, Valabregue R, Poline JB (2002) Region of interest analysis using an SPM toolbox. In: 8th international conference on functional mapping of the human brain 16:497.
    1. Camalier CR, Scarim K, Mishkin M, Averbeck BB (2019) A comparison of auditory oddball responses in dorsolateral prefrontal cortex, basolateral amygdala, and auditory cortex of macaque. J Cogn Neurosci 31:1054–1064. 10.1162/jocn_a_01387 - DOI - PMC - PubMed
    1. Chao ZC, Takaura K, Wang L, Fujii N, Dehaene S (2018) Large-scale cortical networks for hierarchical prediction and prediction error in the primate brain. Neuron 100:1252–1266.e3. 10.1016/j.neuron.2018.10.004 - DOI - PubMed