. 2024 Nov 20;44(47):e0885242024.
doi: 10.1523/JNEUROSCI.0885-24.2024.

Acid-Sensing Ion Channels Drive the Generation of Tactile Impulses in Merkel Cell-Neurite Complexes of the Glabrous Skin of Rodent Hindpaws

Affiliations

Acid-Sensing Ion Channels Drive the Generation of Tactile Impulses in Merkel Cell-Neurite Complexes of the Glabrous Skin of Rodent Hindpaws

Akihiro Yamada et al. J Neurosci. .

Abstract

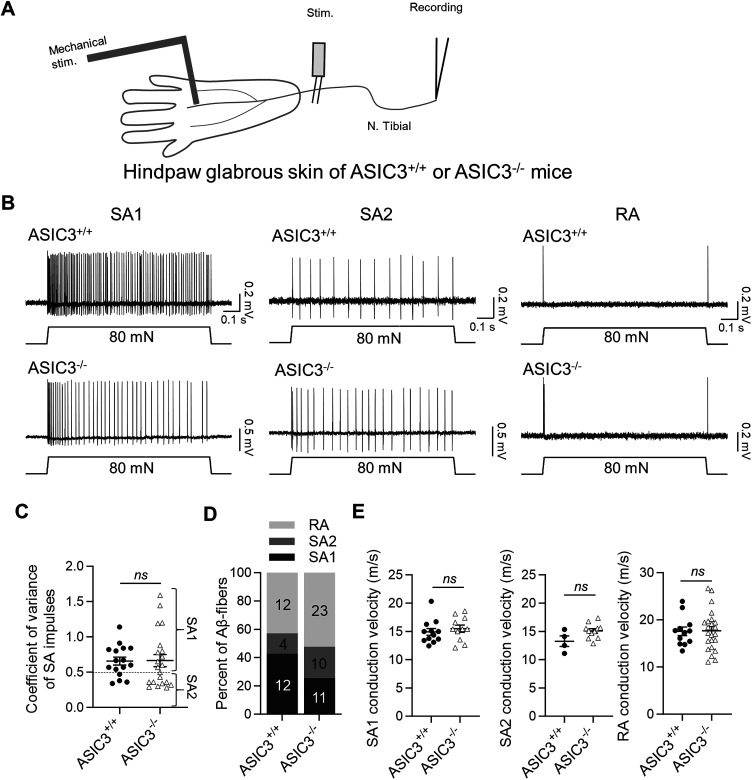
Merkel cell-neurite complexes (MNCs) are enriched in touch-sensitive areas, including whisker hair follicles and the glabrous skin of the rodent's paws, where tactile stimulation elicits slowly adapting type 1 (SA1) tactile impulses to encode for the sense of touch. Recently, we have shown with rodent whisker hair follicles that SA1 impulses are generated through fast excitatory synaptic transmission at MNCs and driven by acid-sensing ion channels (ASICs). However, it is currently unknown whether, besides whisker hair follicles, ASICs also play an essential role in generating SA1 impulses from MNCs of other body parts in mammals. In the present study, we attempted to address this question by using the skin-nerve preparations made from the hindpaw glabrous skin and tibial nerves of both male and female rodents and applying the pressure-clamped single-fiber recordings. We showed that SA1 impulses elicited by tactile stimulation to the rat hindpaw glabrous skin were largely diminished in the presence of amiloride and diminazene, two ASIC channel blockers. Furthermore, using the hindpaw glabrous skin and tibial nerve preparations made from the mice genetically deleted of ASIC3 channels (ASIC3-/-), we showed that the frequency of SA1 impulses was significantly lower in ASIC3-/- mice than in littermate wild-type ASIC3+/+ mice, a result consistent with the pharmacological experiments with ASIC channel blockers. Our findings suggest that ASIC channels are essential for generating SA1 impulses to underlie the sense of touch in the glabrous skin of rodent hindpaws.

Keywords: Merkel cell–neurite complex; Piezo2 channel; acid-sensing ion channel; low threshold mechanoreceptor; sense of touch; slowly adapting type 1 response.


Conflict of interest statement

The authors declare no competing financial interests.

Figures

Figure 1.
Figure 1.
SA1 impulses recorded from the skin–nerve preparation made from the glabrous skin and tibial nerves of rat hindpaws. A, Diagram illustrates the pressure-clamped single–fiber recordings of SA1 impulses following mechanical stimulation applied to the glabrous skin of rat hindpaws. SA1 impulses were evoked by a mechanical probe. An electrical stimulator was used to directly evoke AP impulses to determine AP CV. B, Sample trace shows an AP impulse (arrowhead indicated) elicited by electrical stimulation of the tibial nerve for determining CV. The arrow indicates an electrical stimulation artifact. C, Summary data of the CV of SA1 LTMRs (n = 15). D, Mechanical thresholds of SA1 LTMRs (n = 15). E, Sample trace shows AP impulses evoked from an SA1 LTMR by a mechanical indentation at a 15 mN force. The duration (1 s) of the mechanical indentation is indicated below the AP impulses. F, The plot of instantaneous frequency of the SA1 impulses in E. G, Coefficient of variance of SA1 impulses from SA1 LTMRs (n = 15). Data represent individual observations and mean ± SEM.
Figure 2.
Figure 2.
SA1 impulses elicited by mechanical indentation are suppressed pharmacologically by ASIC blockers. A, Sample traces show SA1 impulses before (control, left), following the application of 200 µM amiloride (middle), and after the wash-off of amiloride (right). B, Similar to A, except diminazene (100 µM) was tested. In both A and B, SA1 impulses were elicited by mechanical indentation at 15 mN. C, Pooled data of the experiments exemplified in A, showing the suppression of SA1 impulses by 200 µM amiloride (n = 7). D, Pooled data of the experiments exemplified in B, showing the suppression of SA1 impulses by 100 µM diminazene (n = 7). Data represent individual observations and mean ± SEM; *p < 0.05; **p < 0.01; ns, not significantly different; one-way ANOVA with Tukey's post hoc test.
Figure 3.
Figure 3.
Impulses of Aβ-fiber SA1 LTMRs induced by caffeine are suppressed pharmacologically by ASIC blockers. A, Sample traces show impulses of an SA1 LTMR before (control, top), following the application of 10 mM caffeine (middle) and the application of 10 mM caffeine plus 200 µM amiloride (bottom). B, Pooled data of the experiments exemplified in A, showing the suppression of caffeine-induced impulses by 200 µM amiloride (n = 5). Data represent individual observations and mean ± SEM; *p < 0.05; **p < 0.01; one-way ANOVA with Tukey's post hoc test.
Figure 4.
Figure 4.
Mechanical indentation-elicited impulses of Aβ-fiber LTMRs in hindpaw glabrous skin of ASIC3+/+ and ASIC3−/− mice. A, Diagram illustrates the pressure-clamped single–fiber recordings of mechanical indentation-elicited impulses of Aβ-fiber LTMRs in the hindpaw glabrous skin of mice. B, Three sets of sample traces show AP impulses evoked by mechanical indentation from an SA1 LTMR (left), SA2 LTMR, and RA LTMR. Mechanical indentation was applied at 80 mN force with a duration of 1 s. C, Coefficient of variance of SA LTMR (SA1 and SA2 LTMRs) recorded from the hindpaw glabrous skin of ASIC3+/+ and ASIC3−/− mice. The dashed line indicates the coefficient of variance value of 0.5, the level that is used to classify SA LTMRs into SA1 LTMRs (coefficient of variance ≥0.5) and SA2 LTMRs (coefficient of variance <0.5). D, The percentage of Aβ-fiber LTMRs being SA1 (black), SA2 (dark gray), and RA (light gray), as recorded from the hindpaw glabrous skin of ASIC3+/+ and ASIC3−/− mice. E, CV of SA1 LTMRs (left panel), SA2 LTMRs (middle panel), and RA LTMRs (right panel), as recorded from the hindpaw glabrous skin of ASIC3+/+ and ASIC3−/− mice. Data represent individual observations and mean ± SEM; ns, not significantly significant; Student's t test.
Figure 5.
Figure 5.
Comparison of mechanical responses of Aβ-fiber LTMRs in the hindpaw glabrous skin between ASIC3+/+ and ASIC3−/− mice. A, Von Frey threshold of SA1 LTMRs recorded from the hindpaw glabrous skin of ASIC3+/+ (solid circles) and ASIC3−/− mice (open triangles). B, Frequency of SA1 impulses in response to mechanical indentation at the forces of 0.5, 30, and 80 mN applied to the hindpaw glabrous skin of ASIC3+/+ (solid circles; n = 10) and ASIC3−/− mice (open triangles; n = 11). C, Similar to A, except SA2 LTMRs were examined in the hindpaw glabrous skin of ASIC3+/+ (solid circles) and ASIC3−/− mice (open triangles). D, Similar to B, except SA2 LTMRs were examined in the hindpaw glabrous skin of ASIC3+/+ (solid circles; n = 4) and ASIC3−/− mice (open triangles; n = 10). E, Similar to A, except RA LTMRs were examined in the hindpaw glabrous skin of ASIC3+/+ (solid circles) and ASIC3−/− mice (open triangles). F, Similar to B, except RA LTMRs were tested in the hindpaw glabrous skin of ASIC3+/+ (solid circles; n = 12) and ASIC3−/− mice (open triangles; n = 19). A–F, Mechanical indentation was applied for 1 s, and frequencies of the impulses were the averaged values in 1 s. Data represent individual observations and mean ± SEM; #p < 0.05; ###p < 0.001; *p < 0.05; **p < 0.01; ns, not significantly significant; two-way ANOVA with Bonferroni’s post hoc test or Student's t test.
Figure 6.
Figure 6.
ASIC3 expression on the neurons of lumbar DRGs of mice. A, Sample image shows ASIC3-ir on an L5 DRG section of a WT mouse. B, Histogram shows the cell diameter distribution of ASIC3-ir–positive neurons in L4 and L5 DRG sections. The ASIC3-ir–positive neurons were pooled from 24 DRG sections (L4 and L5) of five WT mice. C, Sample image shows the lack of ASIC3-ir in an L5 DRG section of an ASIC3−/− mouse. D–F, Sample images show double immunostaining for ASIC3 (ASIC3-ir, D) and NF200 (NF200-ir, E) in an L5 DRG section of a WT mouse. F is the overlay image of D and E to show the coimmunostaining of ASIC3 and NF200 in some large-sized DRG neurons.
Figure 7.
Figure 7.
Immunohistochemical staining of Troma1, NF200, and ASIC3 in mouse glabrous and hairy skin. A–D, Images show immunoreactivity of NF200 (A), Troma1 (B), and ASIC3 (C) in the cryosections of the plantar glabrous skin of a mouse hindpaw. D is the overlay image from A, B, and C, showing the innervation of Merkel cells (Troma1-staining) by primary afferent nerves (NF200-staining) and the close contact to the Merkel cells by some ASIC3-ir–positive structures in the glabrous skin. Arrows in D indicate two sites where the ASIC3-ir–positive structures contact Merkel cells. E–H, Similar to A–D, except that the immunohistochemical staining was performed on the back hairy skin of the whole-mount tissue preparations of a mouse. The overlay image in H demonstrates the innervation of Merkel cells (Troma1-staining) by primary afferent nerves (NF200-staining) and the close contact to the Merkel cells by the ASIC3-ir–positive structures in the hairy skin as well. Arrows in H indicate two sites where the ASIC3-ir–positive structures contact Merkel cells.
Figure 8.
Figure 8.
Proton-evoked inward currents in Nav1.8-ChR2-EYFP–negative Aβ-afferent neurons in L4 DRGs of mice. A, Experimental setting for recordings of proton-evoked currents in Nav1.8-ChR2-EYFP–negative Aβ-afferent neurons in L4 DRGs. An L4 DRG with an attached peripheral afferent bundle was anchored in a recording chamber. Whole-cell patch–clamp recordings were made from DRG neurons. Electrical stimulation was applied to the peripheral afferent bundle with a suction electrode to evoke APs. As illustrated in A, an acidified Krebs’ solution, pH 5, was applied to the recorded neuron. B, C, Image shows L4 DRG neurons under 40× bright-field (B) and fluorescent microscopy (C). An asterisk in each image indicates a large-sized Nav1.8-ChR2-EYFP–negative Aβ-afferent neuron. The shadow of a recording electrode can be seen on the right side of the asterisk. D, Overlay image of B and C to show the Nav1.8-ChR2-EYFP–negative (asterisk indicated) and Nav1.8-ChR2-EYFP–positive (green color) Aβ-afferent neurons. E, Sample trace shows an AP evoked by electrical stimulation to an afferent nerve bundle at its peripheral site, and the AP was recorded from a Nav1.8-ChR2-EYFP–negative Aβ-afferent neuron. F–H, Pooled data show CV (F), soma diameters (G), and AP widths (H) of Nav1.8-ChR2-EYFP–negative Aβ-afferent neurons. I, Sample trace shows an inward current evoked by protons, pH 5 (Krebs’ solution), in a Nav1.8-ChR2-EYFP–negative Aβ-afferent neuron. J, The percentage of Nav1.8-ChR2-EYFP–negative Aβ-afferent neurons being proton-responsive (n = 16) and not proton-responsive (n = 9). K, Pooled data of proton-evoked inward currents in Nav1.8-ChR2-EYFP–negative Aβ-afferent neurons in L4 DRGs (n = 16). Data represent individual observations and mean ± SEM.
Figure 9.
Figure 9.
Proton-evoked inward currents in Nav1.8-ChR2-EYFP–negative Aβ-afferent neurons that innervate the foot pads of mouse hindpaws. A–D, Images show L4 DRG neurons under 40× bright-field (A) and fluorescent microscopy (B–D). The L4 DRG was obtained from a Nav1.8-ChR2-EYFP mouse whose hindpaw foot pads were injected with the fluorescent dye DiD. DiD-labeled neurons and Nav1.8-ChR2-EYFP–positive neurons were shown in B (red) and C (green), respectively. D is the overlay image of B and C to show DiD-labeled and Nav1.8-ChR2-EYFP–negative DRG neurons (asterisk indicated) that were selected for patch-clamp recordings. E, Pooled data shows the soma diameters of the DiD-labeled Nav1.8-ChR2-EYFP–negative DRG neurons being recorded. F, Sample trace shows an inward current evoked by protons, pH 5 (Krebs’ solution), in a DiD-labeled Nav1.8-ChR2-EYFP–negative Aβ-afferent neuron. G, The percentage of DiD-labeled Nav1.8-ChR2-EYFP–negative Aβ-afferent neurons being proton-responsive (n = 9) and not proton-responsive (n = 2). H, Pooled data of proton-evoked inward currents in DiD-labeled Nav1.8-ChR2-EYFP–negative Aβ-afferent neurons in L4 DRGs (n = 9). Data represent individual observations and mean ± SEM.
Figure 10.
Figure 10.
Mechanical responses of Aβ-fiber SA1 LTMRs in the hindpaw glabrous skin of ASIC3+/+ and ASIC3−/− mice with prolonged mechanical indentation. A, Sample traces of SA1 impulses elicited by mechanical indentation at 80 mN. Mechanical indentation was applied to the glabrous skin of the hindpaw of an ASIC3+/+ (top panel) and an ASIC3−/− mouse (bottom panel) for a duration of 2.5 s. B, Time course of the frequency of SA1 impulses evoked by 80 mN mechanical indentation. The indentation was applied for 2.5 s onto the hindpaw glabrous skin of an ASIC3+/+ (solid circle) and an ASIC3−/− mice (open triangles). The gray color-shaded area indicates the late-phase SA1 impulses. C, Averaged frequency of SA1 impulses during 2.5 s mechanical indentation at 80 mN. The mechanical indentations were applied to the hindpaw glabrous skin of ASIC3+/+ (circles) and ASIC3−/− mice (triangles). Data represent individual observations and mean ± SEM; ###p < 0.001; *p < 0.05; **p < 0.01; two-way ANOVA with Bonferroni’s post hoc test (late-phase SA1 impulses in B) or Student's t test (C).

References

    1. Bensmaia SJ, Craig JC, Yoshioka T, Johnson KO (2006) SA1 and RA afferent responses to static and vibrating gratings. J Neurophysiol 95:1771–1782. 10.1152/jn.00877.2005 - DOI - PMC - PubMed
    1. Benson CJ, Xie J, Wemmie JA, Price MP, Henss JM, Welsh MJ, Snyder PM (2002) Heteromultimers of DEG/ENaC subunits form H+-gated channels in mouse sensory neurons. Proc Natl Acad Sci U S A 99:2338–2343. 10.1073/pnas.032678399 - DOI - PMC - PubMed
    1. Blake DT, Johnson KO, Hsiao SS (1997) Monkey cutaneous SAI and RA responses to raised and depressed scanned patterns: effects of width, height, orientation, and a raised surround. J Neurophysiol 78:2503–2517. 10.1152/jn.1997.78.5.2503 - DOI - PubMed
    1. Carvell GE, Simons DJ (1990) Biometric analyses of vibrissal tactile discrimination in the rat. J Neurosci 10:2638–2648. 10.1523/JNEUROSCI.10-08-02638.1990 - DOI - PMC - PubMed
    1. Chang W, Gu JG (2019) Impairment of tactile responses and Piezo2 channel mechanotransduction in mice following chronic vincristine treatment. Neurosci Lett 705:14–19. 10.1016/j.neulet.2019.03.045 - DOI - PMC - PubMed

Substances

LinkOut - more resources