. 2024 Oct 8;15(1):8722.
doi: 10.1038/s41467-024-52990-3.

Multiomic single-cell sequencing defines tissue-specific responses in Stevens-Johnson syndrome and toxic epidermal necrolysis

Collaborators, Affiliations

Multiomic single-cell sequencing defines tissue-specific responses in Stevens-Johnson syndrome and toxic epidermal necrolysis

Andrew Gibson et al. Nat Commun. .

Abstract

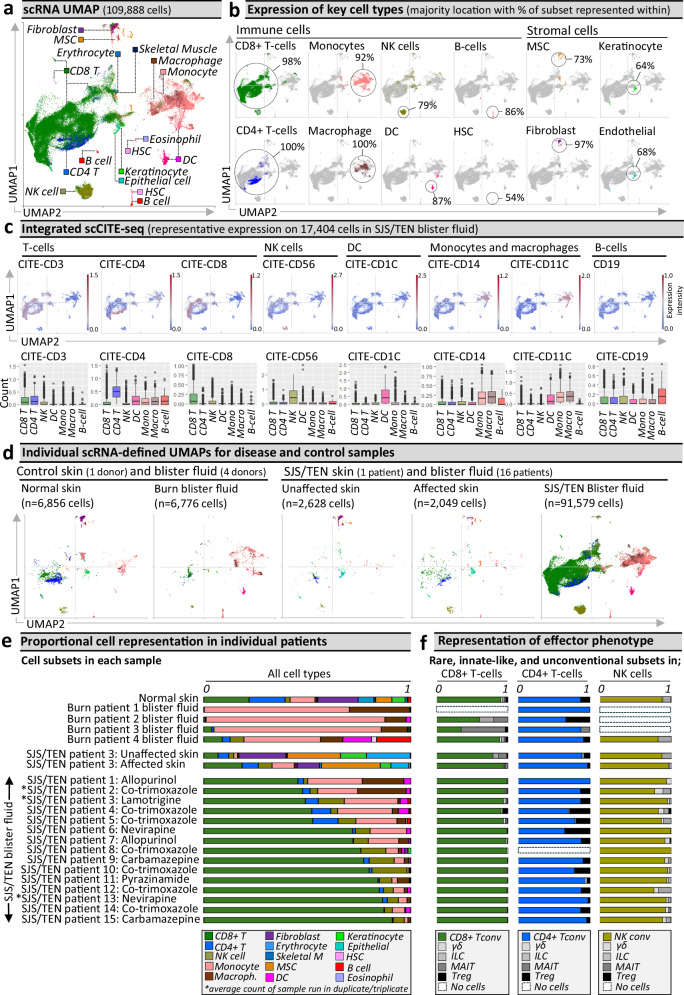
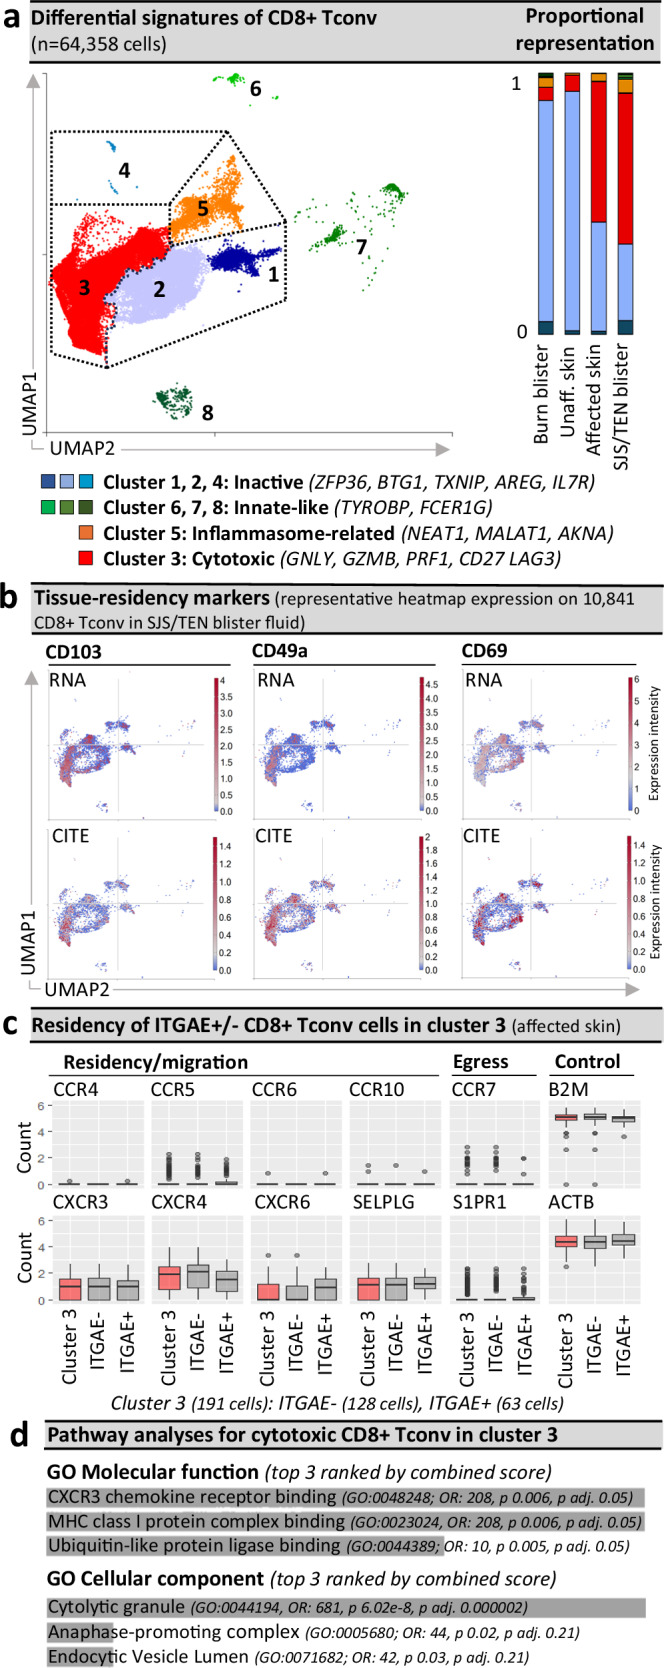
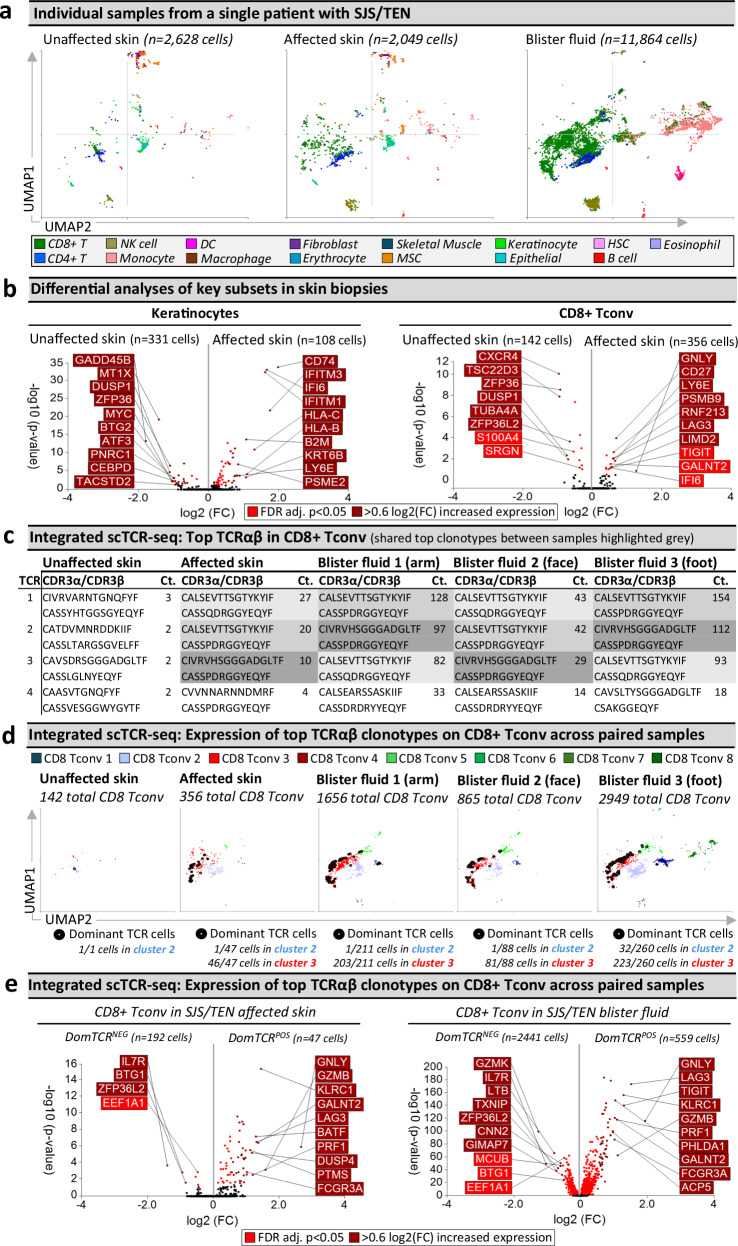
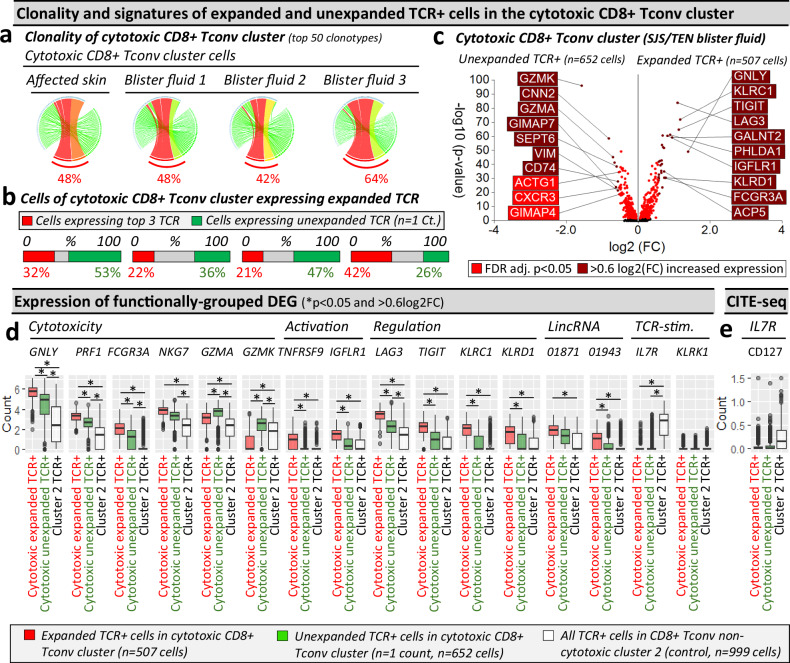
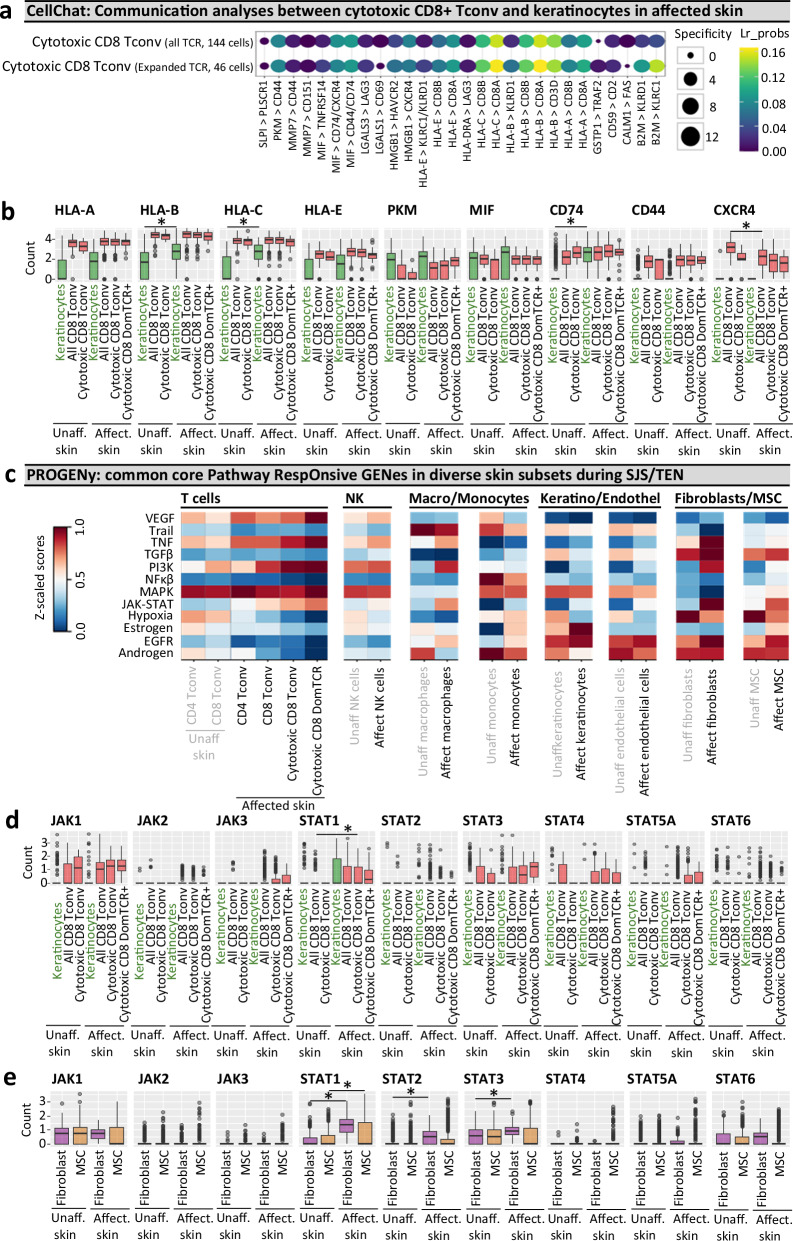
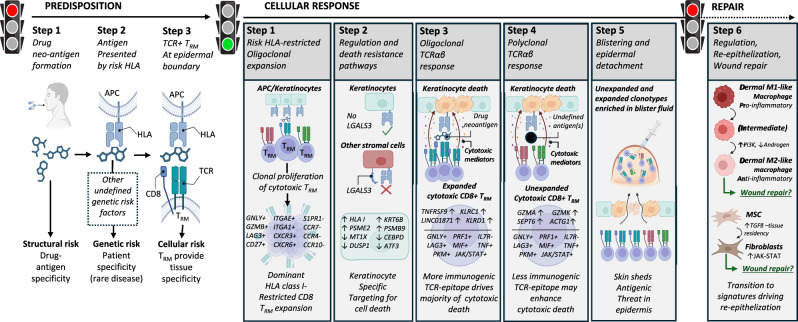
Stevens-Johnson syndrome and toxic epidermal necrolysis (SJS/TEN) is a rare but life-threatening cutaneous drug reaction mediated by human leukocyte antigen (HLA) class I-restricted CD8+ T cells. For unbiased assessment of cellular immunopathogenesis, here we perform single-cell (sc) transcriptome, surface proteome, and T cell receptor (TCR) sequencing on unaffected skin, affected skin, and blister fluid from 15 SJS/TEN patients. From 109,888 cells, we identify 15 scRNA-defined subsets. Keratinocytes express markers indicating HLA class I-restricted antigen presentation and appear to trigger the proliferation of and killing by cytotoxic CD8+ tissue-resident T cells that express granulysin, granzyme B, perforin, LAG3, CD27, and LINC01871, and signal through the PKM, MIF, TGFβ, and JAK-STAT pathways. In affected tissue, cytotoxic CD8+ T cells express private expanded and unexpanded TCRαβ that are absent or unexpanded in unaffected skin, and mixed populations of macrophages and fibroblasts express pro-inflammatory markers or those favoring repair. This data identifies putative cytotoxic TCRs and therapeutic targets.


Conflict of interest statement

E.J.P. receives royalties and consulting fees from UpToDate (where she is a Drug Allergy Section Editor) and has received consulting fees from Janssen, Vertex, Verve, Servier, Rapt and Esperion; she is co-director of IIID Pty Ltd, which holds a patent for HLA-B*57:01 testing for abacavir hypersensitivity, and she has a patent pending for detection of HLA-A*32:01 in connection with diagnosing drug reaction with eosinophilia and systemic symptoms (for these patents she does not receive any financial remuneration and neither are related to the submitted work). All other authors declare no competing interests.

Figures

Fig. 1
Fig. 1. Unbiased multi-focal single-cell sequencing identifies expanded pathogenic CD8+ Tconv in affected skin and blister fluid during Stevens-Johnson syndrome and toxic epidermal necrolysis.
a scRNA-defined uniform manifold approximation and projection (UMAP) of 109,888 live cells from normal skin, burn blister fluid, unaffected skin, affected skin, and/or blister fluid from 15 patients with acute SJS/TEN. b Expression distribution for key cell types, including immune and stromal populations. The majority UMAP location of each subset is labeled with the percentage of each subset within that location indicated. c Integrated scCITE-seq expression of subset-defining cell surface proteins for T cells (CD3, CD4, CD8), NK cells (CD56), DC (CD1c), monocytes and macrophages (CD14, CD11c), and B cells (CD19) on a representative UMAP of 17,404 cells obtained within a single 10x run (SJS/TEN blister fluid from n = 4 patients). Heatmap expression (high to low, red to blue) for each surface protein and average box plot expression is shown between scRNA-defined subsets (n = 11,261 CD8 + T cells, 593 CD4 + T cells, 727 NK cells, 536 DC, 3177 monocytes, 1034 macrophages, 45 B cells). The bounds of the box represent the interquartile range from the 25th to 75th percentile, the center line shows the median expression, and the whiskers identify maximum and minimum values to the 10th and 90th percentile, respectively. Outliers are shown. d Individual scRNA-defined UMAPs for tissue-relevant controls from unrelated donors (burn blister fluid, normal skin) and skin and blister fluid from patients with SJS/TEN. e, f scRNA-defined cell representation. Proportional representation of (e) all subsets in individual samples (culprit drug listed for each patient) and (f) rare, unconventional, and innate-like lymphoid cell (ILC) populations as a proportion of total CD8+ T cells, CD4+ T cells, or NK cells in each sample. The average expression is shown for patients with multiple samples from the same time point, indicated by an asterisk. Figure created using Visual Genomics Analysis Studio (VGAS). Source data are provided as a Source Data file. MSC, Mesenchymal stromal cell; HSC, Hematopoietic stem cell; NK, Natural killer; DC, Dendritic cell; Tconv, T conventional cell; ILC, innate-like lymphoid cell; Unaff, Unaffected; Aff, Affected; SJS/TEN, Stevens-Johnson syndrome and toxic epidermal necrolysis.
Fig. 2
Fig. 2. Pathogenic CD8+ Tconv are ITGAE +/− cytotoxic tissue-resident memory-like populations.
a Seurat-defined CD8+ Tconv clusters 1–8 across cells from normal skin (n = 1 donor), burn blister fluid (n = 4 patients), and unaffected and affected SJS/TEN skin (n = 1 patient) and SJS/TEN blister fluid (n = 15 patients; total n = 64,358 cells: cluster 1, n = 3295 cells; cluster 2, n = 19,761 cells; cluster 3, n = 36,428 cells; cluster 4, 60 cells; cluster 5, 3395 cells; cluster 6, 280 cells; cluster 7, 743 cells; cluster 8, 381 cells) with shared naming according to differential cluster makers. Clusters with < 20 cells were removed from cluster marker analyses (n = 15 cells). A proportional representation of CD8+ Tconv clusters in control and disease sample phenotypes is shown. b Heatmap expression (high to low, red to blue) of RNA and surface protein for ITGAE (CD103), ITGA1 (CD49a), and CLEC2C (CD69) on CD8+ Tconv of SJS/TEN blister fluid. UMAP shows representative 10,841 CD8+ Tconv cells obtained within a single 10x run. c Box plot expression of interest genes aligned with tissue residency, migration, and egress on ITGAE+ and ITGAE- CD8+ Tconv cluster 3 of affected skin (n = 1 patient, 128 ITGAE- cells, 63 ITGAE+ cells). Expression of housekeeping genes B2m and ACTB are shown as a control. For box plots, the bounds of the box represent the interquartile range from the 25th to 75th percentile, the center line shows the median expression, and whiskers identify maximum and minimum values to the 10th and 90th percentile, respectively. Outliers are shown. d Pathway analysis using the significantly enriched cluster markers genes of CD8+ Tconv cluster 3. All cluster marker genes above significance and 0.6 log2 fold change 0.6(log2FC) were included. Analyses were performed using Enrichr and Gene Ontology (GO) molecular and cellular terms, which were ranked by combined score. Figure created using Visual Genomics Analysis Studio (VGAS). Source data are provided as a Source Data file. Tconv, T conventional cell; GO, Gene Ontology; OR, odds ratio; p adj., adjusted p-value; CITE, cellular indexing of transcriptome and epitopes; SJS/TEN, Stevens-Johnson syndrome and toxic epidermal necrolysis.
Fig. 3
Fig. 3. Shared oligoclonal TCRαβ clonotypes on cytotoxic CD8+ Tconv in affected skin and blister fluid are absent from or unexpanded in unaffected skin.
a UMAPs for paired unaffected and affected skin and blister fluid samples from a single patient with SJS/TEN. b Differential gene expression (two-tailed Wilcoxon, Hochberg adj, p < 0.05) between keratinocytes or CD8+ Tconv cells from unaffected and affected skin (n = 1 patient with time-paired samples; unaffected skin keratinocytes, n = 331 cells; unaffected skin CD8+ Tconv, n = 142 cells; affected skin keratinocytes, n = 108 cells; affected skin CD8+ Tconv, 356 cells). Genes colored red are significantly (p < 0.05) increased (light red < 0.6 log2 fold change (log2FC), dark red > 0.6log2FC). The top 10 genes are labeled. c Top functional TCR CDR3αβ pairings and counts (Ct.) in CD8+ Tconv cells. The same top TCR clonotypes across affected samples are highlighted in gray. d Signatures of dominant TCR+ CD8+ Tconv align to the cytotoxic Tconv cluster. Expression of the top 3 dominantly-expanded TCR (black) on CD8+ Tconv cells of each sample. The number of dominant TCR+ cells aligned to CD8+ Tconv cluster 2 (control) and cluster 3 (cytotoxic) are indicated numerically. e Differential gene expression (two-tailed Wilcoxon, Hochberg adj, p < 0.05) between CD8+ Tconv expressing dominant TCRs or other TCRs in affected skin or blister fluids (n = 1 patient with time-paired samples; affected skin DomTCRNEG, 192 cells; affected skin DomTCRPOS, n = 47 cells; blister fluid DomTCRNEG, 2441 cells; blister fluid DomTCRPOS, n = 559 cells). Genes colored red are significantly (p < 0.05) increased (light red < 0.6log2FC, dark red > 0.6log2FC). The top 10 genes are labeled. Figure created using Visual Genomics Analysis Studio (VGAS). Source data are provided as a Source Data file. TCR, T cell receptor; Dom TCR, Dominantly-expanded TCR; MSC, Mesenchymal stromal cell; HSC, Hematopoietic stem cell; NK, Natural killer; DC, Dendritic cell; Tconv, T conventional cell; CDR3, Complementary determining region 3; Ct., count; FDR, false discovery rate; FC, fold change; Dom TCR, dominant TCRs; SJS/TEN, Stevens-Johnson syndrome and toxic epidermal necrolysis.
Fig. 4
Fig. 4. Cells in the cytotoxic CD8+ Tconv cluster consist of TCR-dependant expanded and unexpanded clonotypes.
ac Clonality of cells in the cytotoxic CD8+ Tconv cluster in affected skin and blister fluid samples from a single patient with SJS/TEN. a Clonality of cells in the cytotoxic CD8+ Tconv cluster. The top 50 TCRs are shown to demonstrate a similar expanded representation of the top TCRs. The percentage indicates the proportion of counts aligned to the top 3 dominantly-expanded TCRs. Circos plot segment width is proportionate to dominance (increasing green to red). b Proportional expression of dominantly-expanded TCRαβ (TCR+) cells (red) and unexpanded clonotypes (green, n = 1 count) in all cells of the cytotoxic CD8+ Tconv cluster across affected skin (n = 144 cells) and blister fluid samples (blister fluid 1, n = 919 cells; blister fluid 2, n = 379 cells; blister fluid 3, n = 532 cells). c Differential gene expression signatures (two-tailed Wilcoxon, Hochberg adj, p < 0.05) between expanded or unexpanded TCRαβ (TCR+) cells of the cytotoxic CD8+ Tconv cluster in SJS/TEN blister fluid. Genes colored red are significantly (p < 0.05) increased (light red < 0.6log2FC, dark red > 0.6log2FC). The top 10 genes are labeled. d, e Expression of functionally grouped genes and protein. d Expression of DEG and interest TCR-activation-related genes, and (e) surface scCITE-seq surface protein for CD127 between cells of the cytotoxic Tconv cluster expressing expanded TCR (red, n = 507 cells) or unexpanded TCR (green, n = 652 cells) compared to cells expressing TCR from non-cytotoxic Tconv cluster 2 (control; white, n = 999 cells) in a single patient with SJS/TEN. For box plots, bounds of the box represent the interquartile range from the 25th to 75th percentile, the center line shows the median expression, and whiskers identify maximum and minimum values to the 10th and 90th percentile, respectively. Outliers are shown. *Indicates significant differential expression (two-tailed Wilcoxon, Hochberg adj, p < 0.05 and >0.6 log2FC). Figure created using Visual Genomics Analysis Studio (VGAS). Source data are provided as a Source Data file. TCR, T cell receptor; Dom TCR, Dominantly-expanded TCR; Tconv, T conventional cell; CDR3, Complementary determining region 3; FDR, false discovery rate; FC, fold change; LincRNA, long intergenic non-coding RNA; Unaff, Unaffected; Aff, Affected; SJS/TEN, Stevens-Johnson syndrome and toxic epidermal necrolysis.
Fig. 5
Fig. 5. Cell communication and pathway analysis tools predict receptor-ligand interactions and the role of accessory populations during SJS/TEN.
a, b Cellchat communication analyses. a Highly ranked receptor-ligand interaction between keratinocytes and TCRαβ(TCR+)cells of the cytotoxic CD8+ Tconv cluster, including those expressing dominantly-expanded TCR+ cells. LIANA was used to rank and visualize the highest-scoring receptor-ligand interactions from CellChat. Increasing dot size indicates a more significant p-value for the specificity of an interaction to a given pair of cell groups, with coloring blue to yellow indicating higher bioinformatic ligand-receptor (Lr) probability as a measure of the magnitude of interaction strength. p-values are computed from the one-sided permutation test in CellChat. b Box plot expression of key receptors and ligands implicated by Cellchat on keratinocytes and cells of the cytotoxic CD8+ Tconv cluster in unaffected and affected SJS/TEN skin from a single patient with time-paired samples. Cells are shown for unaffected skin (keratinocytes, 331 cells; CD8+ Tconv, 142 cells; cytotoxic CD8+ Tconv, 9 cells) and affected skin (keratinocytes, 108 cells; CD8+ Tconv, 356 cells; cytotoxic CD8+ Tconv, 191 cells, cytotoxic CD8+ DomTCR, 46 cells). *Indicates significant differential expression (two-tailed Wilcoxon, Hochberg adj, p < 0.05 and > 0.6 log2FC). Significantly increased expression in keratinocytes of affected skin was identified for HLA-B (Pc = 5.19E-05), HLA-C (Pc = 8.66E-12), and CD74 (Pc = 1.18E-34). CXCR4 was significantly downregulated in CD8+ Tconv of affected skin (Pc = 1.29e-11). ce PROGENy pathway analyses. c Comparative heatmap expression (blue to red, low to high) of key cellular pathways in diverse subsets of unaffected skin (CD8+ Tconv, 142 cells; CD4+ Tconv, 118 cells; endothelial cells, 558 cells; fibroblasts, 594 cells; MSC, 673 cells; keratinocytes, 331 cells; macrophages, 18 cells; NK cells, 67 cells; monocytes, 45 cells) and affected skin (CD8+ Tconv, 356 cells; CD4+ Tconv, 155 cells; endothelial cells, 177 cells; fibroblasts, 219 cells; MSC, 578 cells; keratinocytes, 108 cells; macrophages, 21 cells; NK cells, 136 cells; monocytes, 220 cells) from a single SJS/TEN patient. Expression of JAK and STAT genes in (d) keratinocytes and cells of the cytotoxic CD8+ Tconv cluster, including those expressing dominantly-expanded TCR clonotypes, and (e) fibroblasts and MSC of time-paired unaffected and affected skin from a single SJS/TEN patient. *Indicates significant differential expression (two-tailed Wilcoxon, Hochberg adj, p < 0.05 and > 0.6 log2FC). Significantly increased expression in fibroblasts of affected skin was identified for STAT1 (Pc = 4.63E-68), STAT2 (Pc = 1.85E-27), and STAT3 (Pc = 6.41E-09). STAT1 was significantly upregulated in MSC (Pc = 5.55E-10) of affected skin, and significantly upregulated in cytotoxic CD8+ Tconv of affected skin (pc = 0.00073) compared to CD8+ Tconv of unaffected skin. Figure created using Cellchat, LIANA, PROGENy, and Visual Genomics Analysis Studio (VGAS). For all box plots, the bounds of the box represent the interquartile range from the 25th to 75th percentile, the center line shows the median expression, and the whiskers identify maximum and minimum values to the 10th and 90th percentile, respectively. Outliers are shown. Cells are shown for unaffected skin (keratinocytes, 331 cells; all CD8+ Tconv, 142 cells; cytotoxic CD8+ Tconv, 9 cells; fibroblasts, 594 cells; MSC, 673 cells) and affected skin (keratinocytes, 108 cells; all CD8+ Tconv, 356 cells; cytotoxic CD8+ Tconv, 191 cells, cytotoxic CD8+ DomTCR, 46 cells; fibroblasts, 219 cells; MSC, 578 cells). Source data are provided as a Source Data file. Pc, corrected p-value; DomTCR, dominantly-expanded T cell receptors; Tconv, T conventional cell; Lr_probs, ligand-receptor probability; Unaff, Unaffected; Affect, Affected; SJS/TEN, Stevens-Johnson syndrome and toxic epidermal necrolysis, MSC, mesenchymal stromal cell.
Fig. 6
Fig. 6. A common pathogenic population of locally proliferating cytotoxic CD8+ LAG3+ TRM T cells with private expanded and unexpanded TCRαβ clonotypes drives keratinocyte-specific cell death across patients with diverse HLA-restricted drug-induced SJS/TEN.
Predisposition: To develop SJS/TEN, the patient must be exposed to the drug neo-antigen (Step 1: structural risk) and carry a particular HLA risk allele for that drug. The risk HLA allele is necessary but not sufficient for the onset of SJS/TEN, and other currently undefined genetic risk factors may also contribute to disease predisposition (Step 2. Complete genetic risk). The patient must also have cytotoxic CD8+ TRM T cells in the skin and mucous membranes with TCR specificity for the HLA risk-restricted drug-neo-antigen. These cells do not recirculate (Step 3. HLA- and drug neoantigen-specific tissue-resident CD8+ T cells provide the tissue specificity of SJS/TEN). While the drug, HLA, and TRM clonotype may be different between individual patients, the resulting cellular response is shared. Cellular response: Drug-neoantigen is presented by keratinocytes and potentially other stromal cells in the skin by the HLA class I risk allele. HLA class I risk-restricted CD8+ LAG3+ TRM T cells with specificity for the risk HLA-drug neoantigen complex proliferate locally in the skin. In response to local proliferation and inflammation, keratinocytes regulate pathways associated with regulation and death resistance, enabling keratinocyte-specific targeting by cytotoxic LAG3+ CD8+ TRM T cells. The HLA class I-restricted and clonally-expanded cytotoxic CD8+ TRM population initiates keratinocyte death. An unknown antigen or antigens then triggers a similar population of unexpanded cytotoxic CD8+ TRM T cells. We hypothesize that this is either a range of alternate drug neoantigens or a broader array of new antigens produced by the pathological process, and these unexpanded but cytotoxic clonotypes may enhance cytotoxic keratinocyte death. Keratinocyte death leads to epidermal separation and the formation of a sub-epidermal cleft and blister. Both expanded and unexpanded cytotoxic CD8+ TRM T cells enter the cleft and become concentrated in the blister fluid, with eventual separation of the epidermis from the dermis. Repair: Pro-inflammatory M1 and intermediate-like macrophages increase PI3K and androgen signaling towards anti-inflammatory populations associated with re-epithelization and repair. MSC increase TGFβ signaling and differentiate into fibroblasts which express JAK-STAT pathways and are associated with wound repair. TGFβ is also known to promote T cell tissue residency. Created in BioRender. Phillips, E. (2024) BioRender.com/n10c928. APC, antigen-presenting cell; HLA, human leukocyte antigen; TCR, T cell receptor; TRM, tissue-resident memory, MSC, mesenchymal stromal cell.

Update of

References

    1. Marks, M. E. et al. Updates in SJS/TEN: collaboration, innovation, and community. Front. Med.10, 1213889 (2023). - PMC - PubMed
    1. Krantz, M., Yoon, B., Stone, C., Yu, R. & Phillips, E. Stevens-Johnson syndrome and toxic epidermal necrolysis in the FDA adverse event reporting system (FAERS) from 1995-2020. J. Allergy Clin. Immunol.149, AB62 (2022).
    1. Posadas, S. J. et al. Delayed reactions to drugs show levels of perforin, granzyme B, and Fas-L to be related to disease severity. J. Allergy Clin. Immunol.109, 155–161 (2002). - PubMed
    1. Chung, W.-H. et al. Granulysin is a key mediator for disseminated keratinocyte death in Stevens-Johnson syndrome and toxic epidermal necrolysis. Nat. Med.14, 1343–1350 (2008). - PubMed
    1. Clayberger, C. et al. 15 kDa granulysin causes differentiation of monocytes to dendritic cells but lacks cytotoxic activity. J. Immunol.188, 6119–6126 (2012). - PMC - PubMed

Publication types

MeSH terms

Associated data