. 2024 Oct 8;11(1):1069.
doi: 10.1038/s41597-024-03752-9.

The Global Dam Watch database of river barrier and reservoir information for large-scale applications

Affiliations

The Global Dam Watch database of river barrier and reservoir information for large-scale applications

Bernhard Lehner et al. Sci Data. .

Abstract

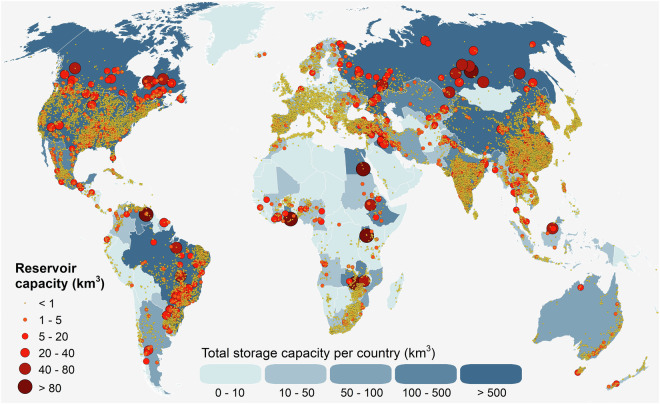
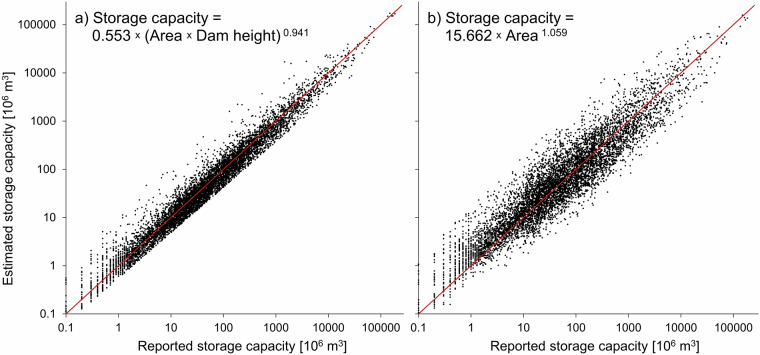
There are millions of river barriers worldwide, ranging from wooden locks to concrete dams, many of which form associated impoundments to store water in small ponds or large reservoirs. Besides their benefits, there is growing recognition of important environmental and social trade-offs related to these artificial structures. However, global datasets describing their characteristics and geographical distribution are often biased towards particular regions or specific applications, such as hydropower dams affecting fish migration, and are thus not globally consistent. Here, we present a new river barrier and reservoir database developed by the Global Dam Watch (GDW) consortium that integrates, harmonizes, and augments existing global datasets to support large-scale analyses. Data curation involved extensive quality control processes to create a single, globally consistent data repository of instream barriers and reservoirs that are co-registered to a digital river network. Version 1.0 of the GDW database contains 41,145 barrier locations and 35,295 associated reservoir polygons representing a cumulative storage capacity of 7,420 km3 and an artificial terrestrial surface water area of 304,600 km2.


Conflict of interest statement

The authors declare no competing interests.

Figures

Fig. 1
Fig. 1
Global distribution of river barriers and reservoirs in the GDW v1.0 database. Points with reservoir capacities <1 km3 include river barriers that do not create a storage reservoir.
Fig. 2
Fig. 2
Spatial and temporal distribution of global river barriers and reservoirs. (a) Latitudinal distribution of river barriers and their associated reservoirs in the GDW v1.0 database; values were calculated in 5-degree latitudinal bins and drawn with smoothed lines. Grey shaded area represents distribution of global land area for reference. (b) Total storage capacity of all reservoirs in GDW v1.0 database by continent, indicated by their respective wedge sizes, and by primary reservoir purpose per continent, including ‘other’ and ‘unknown’ (based on main purpose, see Table 5 for more details on purpose types). (c) Timeline of cumulative number of river barriers and their associated total reservoir surface area and storage capacity; graphs represent only those 15,230 records (37% of entire database) which have a construction year, yet they cover 92% and 91% of surface area and storage capacity, respectively.
Fig. 3
Fig. 3
Flow diagram of the main methodological steps involved in creating, augmenting, and combining data for the creation of the GDW v1.0 database. See main text and Fig. 4 for more details. Data sources, including HydroLAKES, JRC-GSW, and RiverATLAS are described in Tables 2 and 4 and in the main text.
Fig. 4
Fig. 4
Example of reservoir creation and pairing process using barrier points from the GOODD dataset. For the JRC-GSW grid, the Maximum Water Extent map of the dataset was used. See main text for more details.
Fig. 5
Fig. 5
Scatter plots between reported and estimated reservoir storage volumes. Results of bias-corrected power law regression models that use (a) surface area and dam height as predictors (as represented by Eq. 1); and (b) only surface area as predictor (Eq. 2). Red lines represent the 1:1 lines.
Fig. 6
Fig. 6
Pareto distribution model to estimate the number of reservoirs exceeding a given surface area threshold. Only reservoirs of the GDW 1.0 database in the size range between 10 and 1000 km2 were used to fit the Pareto model, assuming (near) completeness of these records.

References

    1. World Commission on Dams (WCD). Dams and development: A new framework for decision-making: The report of the World Commission on Dams. Earthscan, 404 pp., https://riverresourcehub.org/resources/dams-and-development-a-new-framew... (2000).
    1. Poff, N. L., Olden, J. D., Merritt, D. M. & Pepin, D. M. Homogenization of regional river dynamics by dams and global biodiversity implications. Proceedings of the National Academy of Sciences of the United States of America104, 5732–5737, 10.1073/pnas.0609812104 (2007). - PMC - PubMed
    1. Richter, B. D. et al. Lost in development’s shadow: The downstream human consequences of dams. Water Alternatives3, 14–42 (2010).
    1. Reidy Liermann, C., Nilsson, C., Robertson, J. & Ng, R. Y. Implications of dam obstruction for global freshwater fish diversity. Bioscience62, 539–548, 10.1525/bio.2012.62.6.5 (2012).
    1. Winemiller, K. O. et al. Balancing hydropower and biodiversity in the Amazon, Congo, and Mekong. Science351, 128–129, 10.1126/science.aac7082 (2016). - PubMed

LinkOut - more resources