. 2024 Oct 8;15(1):8711.
doi: 10.1038/s41467-024-52801-9.

Transcriptional coactivator MED15 is required for beta cell maturation

Affiliations

Transcriptional coactivator MED15 is required for beta cell maturation

Alex Z Kadhim et al. Nat Commun. .

Abstract

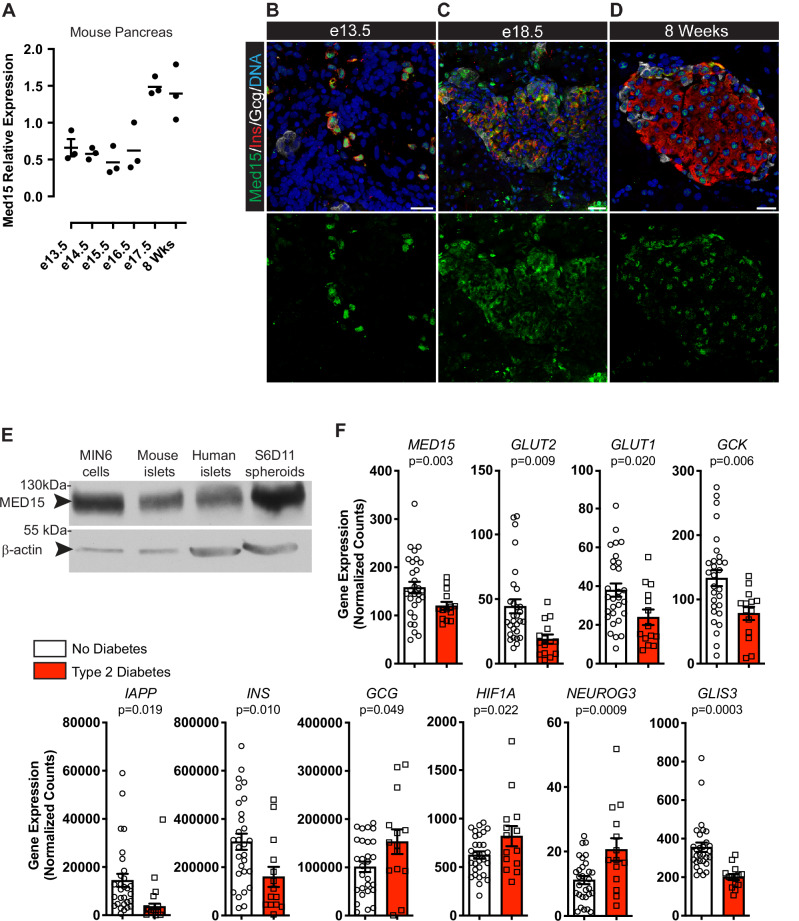
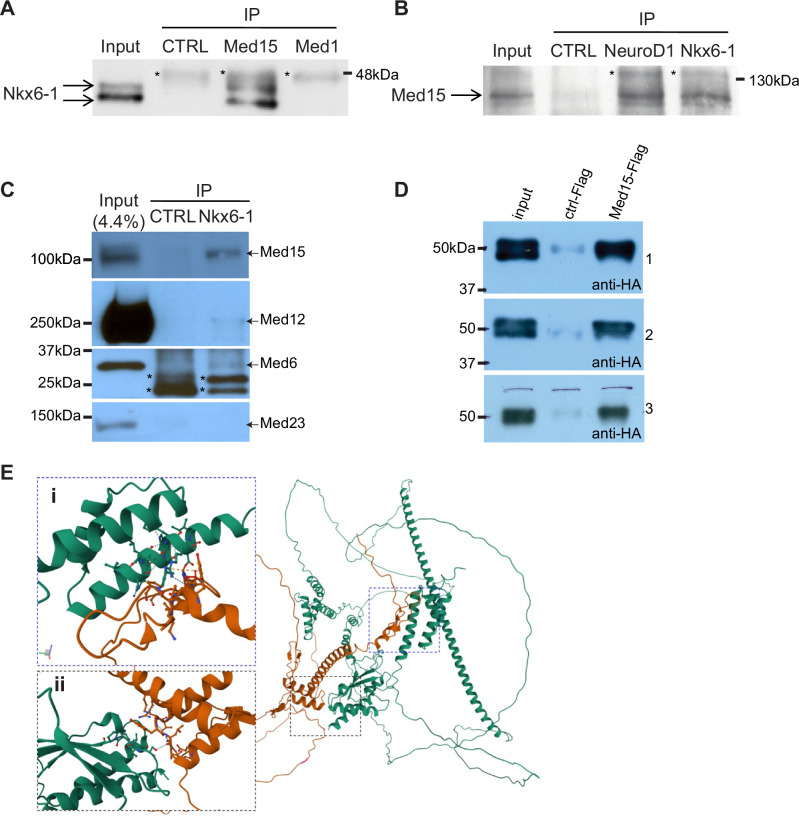
Mediator, a co-regulator complex required for RNA Polymerase II activity, interacts with tissue-specific transcription factors to regulate development and maintain homeostasis. We observe reduced Mediator subunit MED15 expression in endocrine hormone-producing pancreatic islets isolated from people living with type 2 diabetes and sought to understand how MED15 and Mediator control gene expression programs important for the function of insulin-producing β-cells. Here we show that Med15 is expressed during mouse β-cell development and maturation. Knockout of Med15 in mouse β-cells causes defects in β-cell maturation without affecting β-cell mass or insulin expression. ChIP-seq and co-immunoprecipitation analyses found that Med15 binds β-cell transcription factors Nkx6-1 and NeuroD1 to regulate key β-cell maturation genes. In support of a conserved role during human development, human embryonic stem cell-derived β-like cells, genetically engineered to express high levels of MED15, express increased levels of maturation markers. We provide evidence of a conserved role for Mediator in β-cell maturation and demonstrate an additional layer of control that tunes β-cell transcription factor function.


Conflict of interest statement

The authors declare no competing interests.

Figures

Fig. 1
Fig. 1. Med15 is expressed in β-cells and downregulated during type 2 diabetes.
A qPCR of Med15 expression in whole mouse pancreas from embryonic day (e) 13.5–17.5 and 8-week-old islets (n = 3 embryos from 3 litters); error bars represent mean ± SEM. BD Immunofluorescence of Med15 (green), glucagon (GCG; cyan), insulin (INS; red), and nuclei (Hoechst; blue) in E13.5 (B), E18.5 (C), and 8-week-old (D) mouse pancreas (representative of n = 3 mice), scale bars = 25 µm. E Western blot of Med15 in MIN6, mouse and human islets, and stage 6 day 11 (S6D11) differentiated β-like cell spheroids (representative of n = 3 individuals or differentiations). F Normalized expression levels of selected significantly differentially expressed genes in islets isolated from healthy individuals (white bars; n = 29) or those living with T2D (red bars; n = 14). Exact p-values indicated under gene name by two-tailed Student’s t-test; error bars represent mean ± SEM. Source data are provided as Source_Data.xlsx.
Fig. 2
Fig. 2. Med15 deletion in β-cells leads to glucose intolerance and impaired GSIS.
A Schematic of Ins1-Cre mouse model used in experiments. B Immunofluorescent staining of Med15 (green), insulin (Ins; red) in 8-week-old control (CTRL= Ins1Cre/+; Med15+/+) and knockout (M15betaKO= Ins1Cre/+; Med15fl/fl) mouse pancreas sections (representative of n = 3 mice; scale bars = 50 µm). C Intraperitoneal glucose tolerance of 3- and 8-week CTRL (black circles; n = 4 and n = 4 mice, respectively), and M15betaKO mice (red squares; n = 8 and n = 8 mice, respectively); *p ≤ 0.05 by ANOVA with Sidak post-test. D Serum insulin measurements at time 0 and 10 min of (C) in 3- and 8-week CTRL (black circles; n = 4 and n = 3 mice, respectively), and M15betaKO mice (red squares; n = 8 and n = 6 mice, respectively), *p ≤ 0.05 by ANOVA with Sidak post-test. E Quantification of β-cells as determined by insulin immunofluorescence per DAPI+ pancreatic cells in CTRL (black circles) and M15betaKO (red squares) mice (n = 4 mice). F Normalized insulin secretion from perifusion assay of 8-week CTRL (black circles) and M15betaKO (red squares) mouse islets stimulated with 25 mM glucose and 10 mM α-ketoglutarate (n = 3 mice); *p ≤ 0.05 by ANOVA with Sidak post-test. G Total insulin measured from islets in (F) from CTRL (black circles) and M15betaKO (red circles) mice as measured by ELISA (n = 3 mice). Throughout, error bars represent mean ± SEM. Source data are provided as Source_Data.xlsx.
Fig. 3
Fig. 3. Med15 is required for expression of β-cell maturation genes.
A Bulk RNA-seq expression for select β-cell maturation genes of 8-week control (black circles; Ins1+/+;Med15fl/fl) versus M15betaKO (red squares) islets (n = 5 mice). B Immunofluorescence of 8-week control versus knockout mouse pancreatic sections (representative of n = 3 mice), scale bars = 25 µm. C Transmission electron microscopy of 8-week control and knockout islets, arrowheads represent mature insulin secretory granules (representative of n = 3 CTRL, n = 4 M15betaKO mice) scale bars = 2 µm. D Quantification of mature insulin secretory granules from (C) (n = 3 CTRL, black circles; n = 4 M15betaKO, red squares), *p ≤ 0.05 by unpaired two-tailed Student’s t-test. E Quantification of mature insulin secretory granule size from (C) (n = 3 CTRL, black circles; n = 4 M15betaKO, red squares), *p ≤ 0.05 by unpaired two-tailed Student’s t-test. F Seahorse assay measuring mitochondrial function as oxygen consumption rate (OCR) per area of islets in control (black circles) and M15betaKO (red squares) samples (islets from n = 3 mice); *p ≤ 0.05 by two-way ANOVA with Sidak multiple-comparison test. G Maximal respiration (after addition of FCCP) normalized to basal OCR in control (black circles) and M15betaKO (red squares) islets (islets from n = 3 mice). H Glucose uptake as measured by glucose analog 2-NBDG in 8-week control (black circles) and M15betaKO (red squares) dispersed islets (islets from n = 3 mice), *p ≤ 0.05 by unpaired two-tailed Student’s t-test. Throughout, error bars represent mean ± SEM. Source data are provided as Source_Data.xlsx.
Fig. 4
Fig. 4. Med15 cooperates with mature beta cell transcription factors to regulate gene expression.
A Volcano plot comparing gene expression in M15betaKO and CTRL islets (n = 5 mice); p-values calculated using Wald tests; blue = downregulated; red = upregulated. B Enrichment analysis of Hallmark gene sets in M15betaKO vs. CTRL islet transcriptomes. Gene sets depleted in M15betaKO islets are shown in blue and gene sets enriched in M15betaKO are shown in red; p-values calculated using permutation tests with Benjamini–Hochberg correction. C Distribution of Med15 and Med1 binding site annotations in MIN6 cells (n = 3 independent ChIP experiments); blue = promoters; dark green = genic regions; light green = distal regions. D Enrichment analysis of genes with Med15 or Med1 bound at their promoters in M15betaKO vs. CTRL islet transcriptomes (n = 3 independent ChIP experiments). E Heatmaps of ChIP-seq signal at Med15 and Med1 binding sites in MIN6 cells. The heatmap is segregated into sites where peaks were statistically defined for both (shared) or for only one factor. FPM, fragments per million (n = 3 independent ChIP experiments). F Transcription factor binding motifs enriched in Med15 and Med1 binding sites. A positive signed -log10(p-value) indicates the motif is enriched in Med15 binding sites compared to Med1 binding sites. p-values calculated using HOMER v4.11.1; only motifs with p < 0.05 (Benjamini–Hochberg correction) are plotted. G Enrichment analysis of genes differentially expressed in published KO models in IM15KO vs. CTRL islet transcriptomes; p-values calculated using permutation tests with Benjamini–Hochberg correction. H Bar plot shows the mean odds ratios that Med15-bound promoters significantly overlap with promoters bound by the indicated transcription factors. Odds ratios greater than 1 indicate Med15 binds to promoters that are also bound by the transcription factor more frequently than expected by chance. Error bars indicate the 95% confidence intervals of the mean; p-values calculated using two-sided Fisher’s exact tests with Benjamini–Hochberg correction. I ChIP-seq tracks of Med15, Med1, Foxa2, Glis3, Isl1, Mafa, Nkx6-1, Neurod1, and Rfx6 at the Slc2a2, Iapp, and Mafa gene loci. Source data are provided as Source_Data.xlsx.
Fig. 5
Fig. 5. Med15 interacts with Nkx6-1 and Neurod1 to regulate β-cell maturation.
A Co-immunoprecipitation of Med15 and Med1 with Nkx6-1 using mouse β-cell line (MIN6) lysates (representative of n = 3 biological replicates); CTRL = nonspecific IgG control using MIN6 cell lysates. B Co-immunoprecipitation of Med15 with NeuroD1 and Nkx6-1 using mouse β-cell line (MIN6) lysates (representative of n = 3 biological replicates); CTRL = nonspecific IgG control. C Co-immunoprecipitation of Med15, Med12, and Med6 with Nkx6-1 using mouse β-cell line (MIN6) lysates (representative of n = 3 biological replicates); CTRL = nonspecific IgG control. D In vitro interaction between HA-tagged Nkx6-1 and Flag-tagged Med15. Flag-tagged proteins (Med15 or control) were immobilized on a Flag affinity resin and then incubated with HA-tagged full-length Nkx6-1 prior to Western blotting using anti-HA antibodies (n = 3 biological replicates). E AlphaPulldown predicted interactions between domains of MED15 (green) and NKX6.1 (orange). Inset (i) MED15 helix subunit (amino acids 52–71) and NKX6.1 (amino acids 306–367) and (ii) MED15 (amino acids 740–787) and NKX6.1 (amino acids 240–290). In all panels, arrows = predicted molecular weight, * = nonspecific signal. Source data are provided as Source_Data.xlsx.
Fig. 6
Fig. 6. Overexpression of MED15 drives β-cell maturation marker expression in human embryonic stem cell (hESC)-derived pancreatic islets.
A Differentiation efficiencies of Stage 6 Day 23–26 stem cell-derived spheroids derived from CTRL (closed circles; n = 6 differentiations) and MED15betaOE (open circles; n = 5 differentiations) hESC lines; error bars represent mean ± SEM. B MED15, C UCN3, D IAPP, and E NKX6-1 transcript levels in Stage 6 Day 23–26 sorted INS-expressing differentiated islet cells derived from CTRL (closed circles) and MED15betaOE (open circles) hESCs (n = 4 differentiations); *p ≤ 0.05; **p ≤ 0.005 by two-tailed unpaired Student’s t-test; error bars represent mean ± SEM. F Gene expression heatmap using NanoString profiling of sorted INS-expressing cells from Stage 6 Day 23–26 differentiated islets derived from CTRL and MED15betaOE hESCs, n = 6 differentiations, *p ≤ 0.05 by two-tailed unpaired Student’s t-test. G UCN3 (green) and INS (red) protein expression in Stage 6 Day 23 differentiated spheroids derived from CTRL and MED15betaOE hESC lines; blue = DAPI; representative of n = 3 differentiations; scale bars = 50 μm. Source data are provided as Source_Data.xlsx.

References

    1. Blum, B. et al. Functional beta-cell maturation is marked by an increased glucose threshold and by expression of urocortin 3. Nat. Biotechnol.30, 261–264 (2012). - PMC - PubMed
    1. Barsby, T. & Otonkoski, T. Maturation of beta cells: lessons from in vivo and in vitro models. Diabetologia65, 917–930 (2022). - PMC - PubMed
    1. Kolic, J. et al. Proteomic predictors of individualized nutrient-specific insulin secretion in health and disease. Cell Metab. 36, 1619–1633.e5 (2024). - PMC - PubMed
    1. Goodyer, W. R. et al. Neonatal β cell development in mice and humans is regulated by calcineurin/NFAT. Dev. Cell23, 21–34 (2012). - PMC - PubMed
    1. Heit, J. J., Karnik, S. K. & Kim, S. K. Intrinsic regulators of pancreatic beta-cell proliferation. Annu. Rev. Cell Dev. Biol.22, 311–338 (2006). - PubMed

Publication types

MeSH terms