. 2024 Oct 8;15(1):8712.
doi: 10.1038/s41467-024-52940-z.

Improved influenza vaccine responses after expression of multiple viral glycoproteins from a single mRNA

Affiliations

Improved influenza vaccine responses after expression of multiple viral glycoproteins from a single mRNA

Rebecca A Leonard et al. Nat Commun. .

Abstract

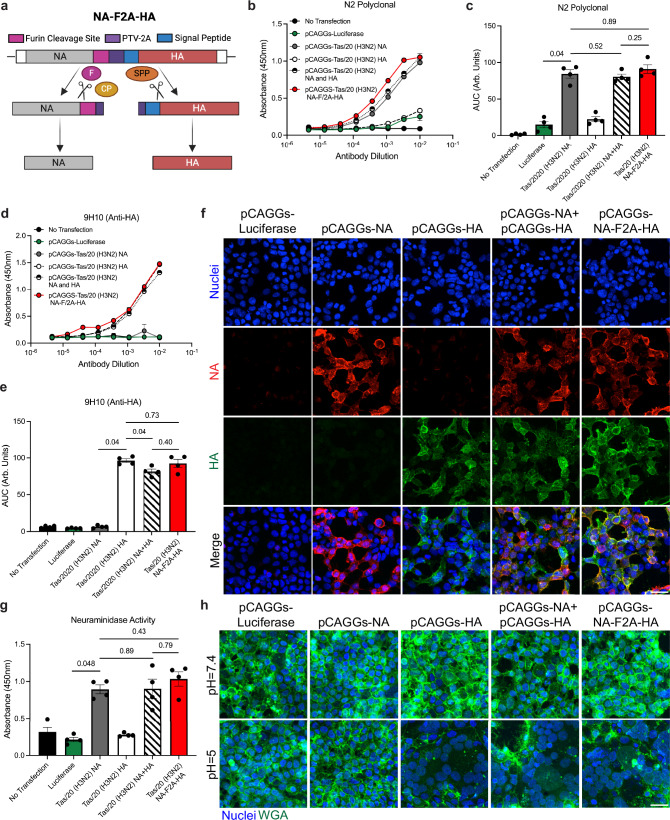
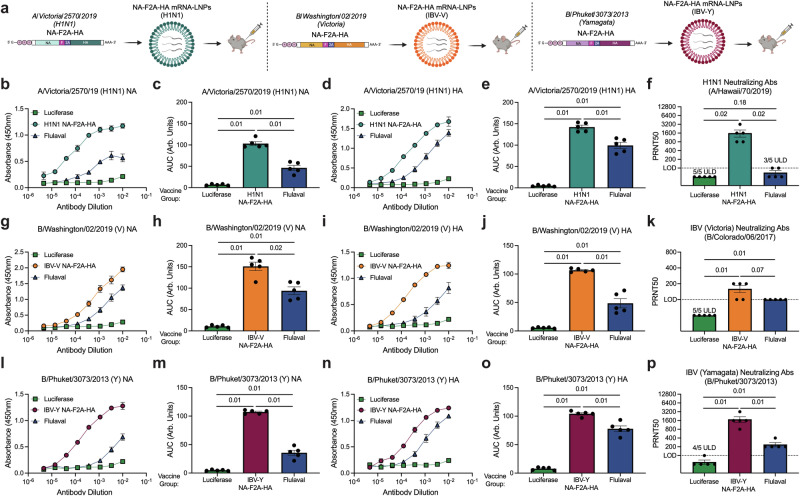
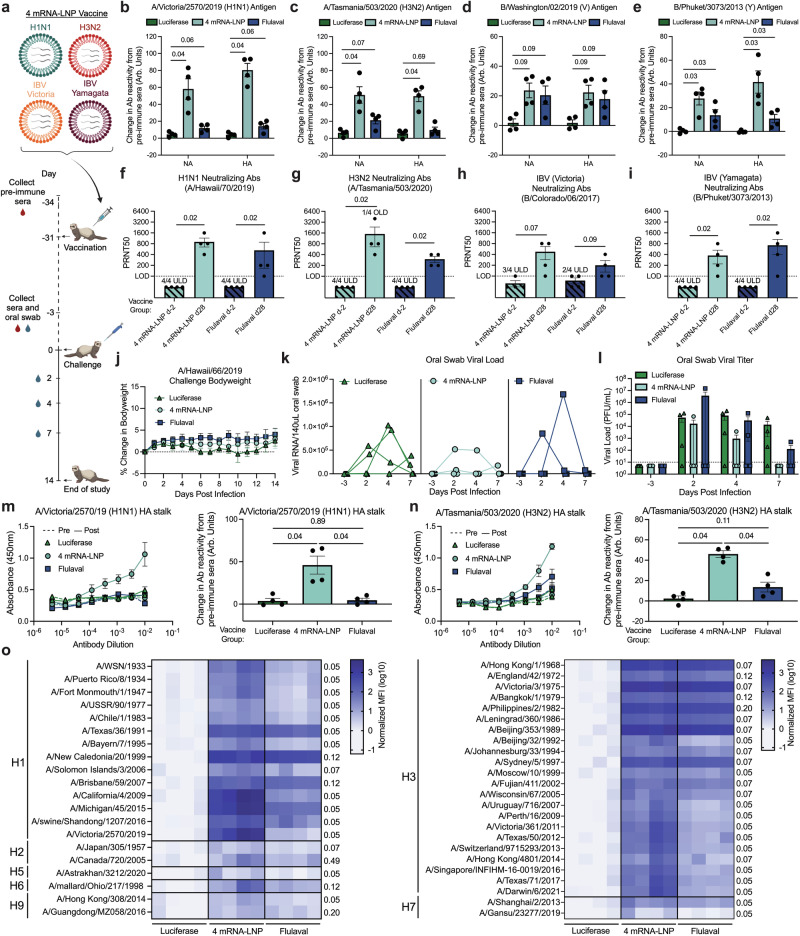
Influenza viruses cause substantial morbidity and mortality every year despite seasonal vaccination. mRNA-based vaccines have the potential to elicit more protective immune responses, but for maximal breadth and durability, it is desirable to deliver both the viral hemagglutinin and neuraminidase glycoproteins. Delivering multiple antigens individually, however, complicates manufacturing and increases cost, thus it would be beneficial to express both proteins from a single mRNA. Here, we develop an mRNA genetic configuration that allows the simultaneous expression of unmodified, full-length NA and HA proteins from a single open reading frame. We apply this approach to glycoproteins from contemporary influenza A and B viruses and, after vaccination, observe high levels of functional antibodies and protection from disease in female mouse and male ferret challenge models. This approach may further efforts to utilize mRNA technology to improve seasonal vaccine efficacy by efficiently delivering multiple viral antigens simultaneously and in their native state.


Conflict of interest statement

Duke University has filed for protection of intellectual property related to the vaccine approach described in this manuscript on behalf of N.S.H. Y.T. is an officer with Acuitas Therapeutics, a company dedicated to the development of lipid nanoparticulate nucleic acid delivery systems for therapeutic and other applications. Y.T. is named on patents describing uses of modified mRNA LNPs. D.W. is a coinventor on patents that describe the use of nucleoside-modified mRNA as a platform to deliver therapeutic proteins or vaccines. The remaining authors declare no competing interests.

Figures

Fig. 1
Fig. 1. NA and HA can be properly expressed from a single DNA construct by separation via furin cleavage sites and PTV-2A motif.
a Diagram of NA-F2A-HA expression vector. Open reading frame, ORF; furin protease, F; carboxypeptidase, CP; signal peptide peptidase, SPP. Created in BioRender. Leonard, R. (2024) BioRender.com/d14z470. b Cell-based ELISAs against 293T cells transfected with the indicated plasmids and stained with dilutions of an N2 polyclonal antibody. c Area under the curve-analysis (AUC) of 4 independent experiments represented in b. Arb. Units=Arbitrary Units. d Cell-based ELISAs against 293T cells transfected with the indicated plasmids and stained with an H3 HA-specific monoclonal antibody, 9H10. e AUC analysis of 4 independent experiments represented in d. f Confocal microscopy of cells transfected with the indicated plasmids, stained with Hoescht 33342 (blue), N2 polyclonal antibody (red), and H3 monoclonal antibody, 9H10 (green). g NA activity detected by ELLA assay using 293Ts transfected with plasmids expressing the indicated genes. h Confocal microscopy of HA fusion assay in 293Ts 24 h post transfection, stained with Hoescht 33342 (blue) and the fluorescent lectin, WGA (green). Panels b and d are representative of four independent experiments, and panels c, e, and g include means from all four independent experiments. For panels f and h, images were taken 24 h post transfection and are representative of two independent experiments. All scale bars = 30 μm. For all panels including statistics, significance was determined using Kruskal–Wallis test followed by pairwise Wilcoxon rank-sum tests with a Benjamini–Hochberg FDR correction. FDR-corrected p-values are reported above sample groups. Data are shown as means ± standard error of mean (SEM). Source data are provided as a Source Data file.
Fig. 2
Fig. 2. Vaccination with an H3N2 NA-F2A-HA mRNA-LNP is as immunogenic against both antigens in mice as mRNA-LNPs encoding either antigen.
a Schematic of vaccine groups and vaccination regimen. Created in BioRender. (Heaton, N. (2024) BioRender.com/l47n232). b Cell-based ELISAs against 293T cells transfected with an A/Tasmania/503/2020 NA expression plasmid. c AUC analysis for data shown in b. d Cell-based ELISAs against 293T cells transfected with an A/Tasmania/503/2020 HA expression plasmid. e AUC analysis for data shown in d. f HAI assays performed with the indicated virus. Values below the limit of detection (LOD) (10 HAI units, dotted line) were set to 6 HAI units for inclusion in the plot. g ELLA assays performed with an active N2 enzyme. Values below the LOD (10 units, dotted line) were set to 5 for inclusion in the plot. h MN50 assays using the indicated virus. Values below LOD (1, dotted line) were set to 0.5 for inclusion in the plot. i PRNT50 assays using the indicated virus in MDCK cells. Any values under the LOD (ULD) (100, dotted line) are shown as 50 for inclusion in the plot. j Schematic of vaccine groups and challenge layout. Created in BioRender. (Heaton, N. (2024) BioRender.com/l47n232). k Change in bodyweight over 14 days following lethal challenge with the indicated virus. Dashed line indicates human endpoint, loss of greater than 25% of starting bodyweight. l Percent survival of vaccinated mice following challenge with the indicated virus. If only part of the group survived, that number is indicated in parentheses. For panels fi, line shown is the mean. For all experiments, n = 5 mice per group and experiments using sera were all performed with sera taken 21 days post vaccination. Mice were vaccinated with doses as follows: BSA, 10 μg; luciferase mRNA-LNPs, 5.1 μg; NA mRNA-LNPs, 2.275 μg; HA mRNA-LNPs, 2.725 μg; NA mRNA-LNP, 2.275 and HA mRNA-LNPs, 2.725 μg; NA-F2A-HA mRNA-LNPs 5.1 μg; Flulaval, 10 μg. For all panels, data are representative of two independent experiments, and are shown as means ± SEM. For all panels including statistics, significance was determined using Kruskal–Wallis test followed by pairwise Wilcoxon rank-sum tests with a Benjamini–Hochberg FDR correction. FDR-corrected p-values are reported above sample groups. Source data are provided as a Source Data file.
Fig. 3
Fig. 3. NA-F2A-HA mRNA-LNP design can be applied to additional influenza virus subtypes to induce superior immunogenic responses to Flulaval in mice.
a Schematic showing vaccine design of H1N1, IBV-Victoria and IBV-Yamagata NA-F2A-HA mRNA-LNPs. Created in BioRender. (Heaton, N. (2024) BioRender.com/h60o989). b Cell-based ELISAs against 293Ts transfected with the indicated NA expression plasmid. c AUC analysis of data in b. d Cell-based ELISAs against 293Ts transfected with the indicated HA expression plasmid. e AUC analysis of data in d. f PRNT50 assays using the indicated virus in MDCK cells. g Cell-based ELISAs against 293Ts transfected with the indicated NA expression vector. h AUC analysis of data in g. i Cell-based ELISAs against 293Ts transfected with the indicated HA expression plasmid. j AUC analysis of data in i. k PRNT50 assay using the indicated virus in MDCK cells. l Cell-based ELISAs against 293Ts transfected with the indicated NA expression plasmid. m AUC analysis of data in l. n Cell-based ELISAs against 293Ts transfected with the indicated HA expression plasmid. o AUC analysis of data in n. p PRNT50 assays using the indicated virus in MDCK cells. For panels f, k, and p, any values under the LOD (ULD) (100, dotted line) are shown as 50 for inclusion in the plot. For all experiments, n = 5 mice per group and experiments using sera were all performed with sera taken 21 days post vaccination. mRNA-LNP vaccinated mice all received 5 μg of their respective vaccine, and Flulaval vaccinated mice received 10 μg of a Flulaval dose. For all panels, data are representative of two independent experiments, and shown as means ± SEM. For all panels including statistics, significance was determined using Kruskal–Wallis test followed by pairwise Wilcoxon rank-sum tests with a Benjamini–Hochberg FDR correction. FDR-corrected p-values are reported above sample groups. Source data are provided as a Source Data file.
Fig. 4
Fig. 4. A mixture of four NA-F2A-HA mRNA-LNPs elicits protective immune responses against lethal H1N1, H3N2, and IBV-Yamagata challenges.
a Schematic of vaccination and challenge experiment. Created in BioRender. (Heaton, N. (2024) BioRender.com/k48b864). be AUC analysis using cell-based ELISAs against 293Ts transfected with the NA or HA for the indicated virus strains. fi PRNT50 assays using the indicated viruses in MDCK cells. Any values under the LOD (ULD) (100, dotted line) are shown as 50 for inclusion in the plot. jl Change in bodyweight through 14 days following lethal challenge with the indicated viruses. Dashed line indicates human endpoint, loss of greater than 25% of starting bodyweight. mo Percent survival of vaccinated mice following challenge with the indicated viruses. For all experiments, n = 5 mice per group and experiments using sera were all performed with sera taken 21 days post vaccination. mRNA-LNP vaccinated mice all received 10 μg total of their respective vaccine (2.5 μg of each H1N1, H3N2, IBV-V and IBV-Y NA-F2A-HA mRNA-LNPs for ‘four mRNA-LNP’ group), and Flulaval vaccinated mice received 10 μg of a Flulaval dose. For all panels, data are representative of two independent experiments, and are shown as means ± SEM. For all panels including statistics, significance was determined using Kruskal–Wallis test followed by pairwise Wilcoxon rank-sum tests with a Benjamini–Hochberg FDR correction. FDR-corrected p-values are reported above sample groups. Source data are provided as a Source Data file.
Fig. 5
Fig. 5. A mixture of four NA-F2A-HA mRNA-LNPs elicits a strong immune response to not only vaccine strain NA, HA, and HA stalk, but also diverse group 1 and 2 HAs, and limits disease following H1N1 viral challenge in ferrets.
a Schematic of vaccination and challenge experiment. Created in BioRender. (Heaton, N. (2024) BioRender.com/k70m759). be AUC analysis using cell-based ELISAs against 293Ts transfected with the NA or HA for the indicated virus strains. ELISAs are shown as net change in antibody reactivity between pre-vaccination sera (d-2) to post-vaccination (d28) sera. fi PRNT50 assays using the indicated viruses in MDCK cells. Any values under the LOD (ULD) (100, dotted line) are shown as 50 for inclusion in the plot. Any values over the LOD (OLD) (3200) are shown as 4000 for inclusion in the plot. j Change in bodyweight over 14 days post viral challenge. Dotted line = 0. k qRT-PCR on oral swab samples taken from ferrets at −3-, 2-, 4- or 7-days post infection. l Viral load determined from plaque assays using oral swabs taken from ferrets at −3, 2-, 4-, or 7-days post infection. Any values not detected (LOD = 10 PFU/mL, dotted line) are shown as 5 for inclusion in the plot. m, n Cell-based ELISAs (left) and corresponding AUC analysis (right) against 293Ts transfected with the indicated HA stalk expression plasmid. AUC analysis is shown as net change in antibody reactivity between pre- (dotted line) and post-vaccination (solid line) ferret sera. o Luminex binding assay of group 1 HAs (left), and group 2 HAs (right). Comparisons to the right of each panel are between the four mRNA-LNP- and Flulaval-vaccinated groups of animals. For all panels, n = 4 ferrets per experimental group and the experiment was performed once. mRNA-LNP vaccinated ferrets received 30 μg total of their respective vaccine (7.5 μg of each H1N1, H3N2, IBV-V and IBV-Y NA-F2A-HA LNPs for ‘four mRNA-LNP’ group), and Flulaval vaccinated ferrets received a full 60 μg of a Flulaval dose. Data are shown as means ± SEM. For all panels including statistics, significance was determined using Kruskal–Wallis test followed by pairwise Wilcoxon rank-sum tests with a Benjamini–Hochberg FDR correction. FDR-corrected p-values are reported above sample groups. Source data are provided as a Source Data file.

References

    1. Thompson, W. W. et al. Influenza-associated hospitalizations in the United States. JAMA292, 1333–1340 (2004). - PubMed
    1. Prevention, C.f.D.C.a. Preliminary Estimated Influenza Illnesses, Medical Visits, Hospitalizations, and Deaths in the United States—2022–2023 Influenza Season. 2024 (2023).
    1. Putri, W., Muscatello, D. J., Stockwell, M. S. & Newall, A. T. Economic burden of seasonal influenza in the United States. Vaccine36, 3960–3966 (2018). - PubMed
    1. Hobson, D., Curry, R. L., Beare, A. S. & Ward-Gardner, A. The role of serum haemagglutination-inhibiting antibody in protection against challenge infection with influenza A2 and B viruses. J. Hyg. (Lond.)70, 767–777 (1972). - PMC - PubMed
    1. Chen, Y. Q. et al. Influenza infection in humans induces broadly cross-reactive and protective neuraminidase-reactive antibodies. Cell173, 417–429.e410 (2018). - PMC - PubMed

Publication types

MeSH terms

LinkOut - more resources