. 2024 Nov;43(22):5548-5585.
doi: 10.1038/s44318-024-00242-x. Epub 2024 Oct 8.

DELE1 maintains muscle proteostasis to promote growth and survival in mitochondrial myopathy

Affiliations

DELE1 maintains muscle proteostasis to promote growth and survival in mitochondrial myopathy

Hsin-Pin Lin et al. EMBO J. 2024 Nov.

Abstract

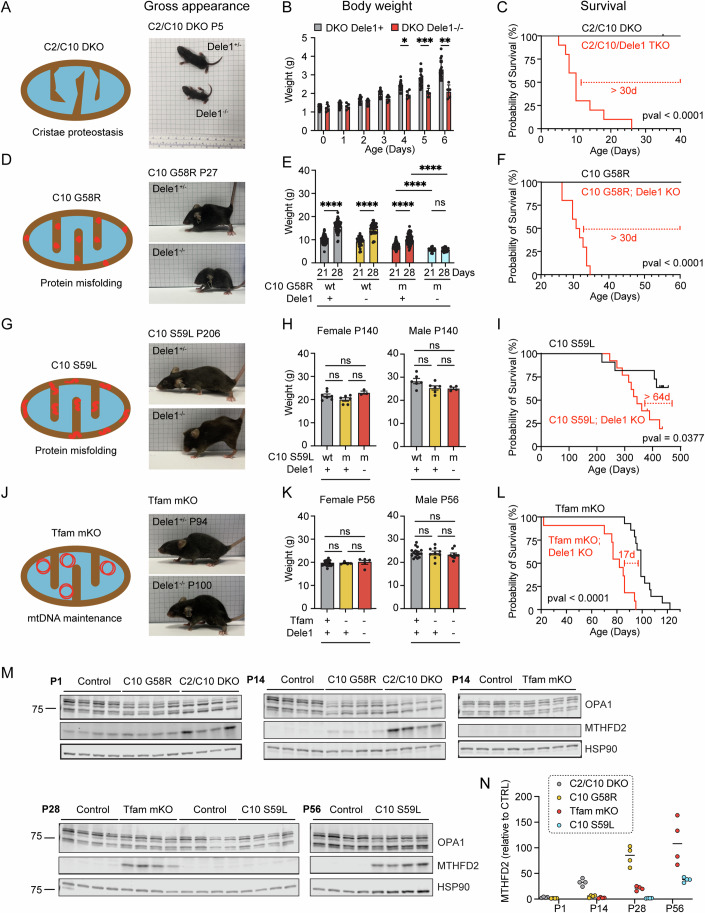
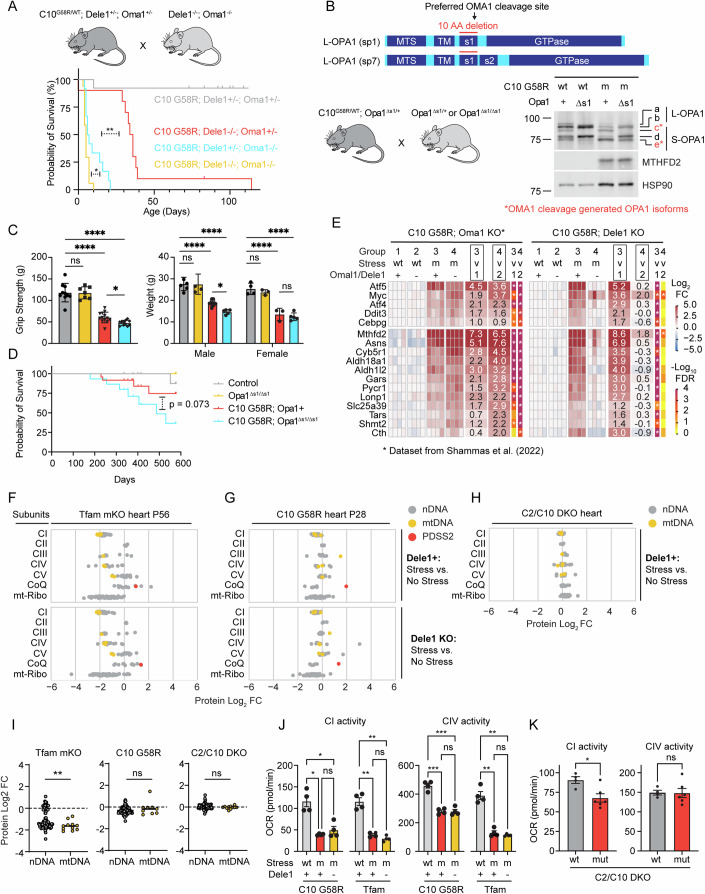
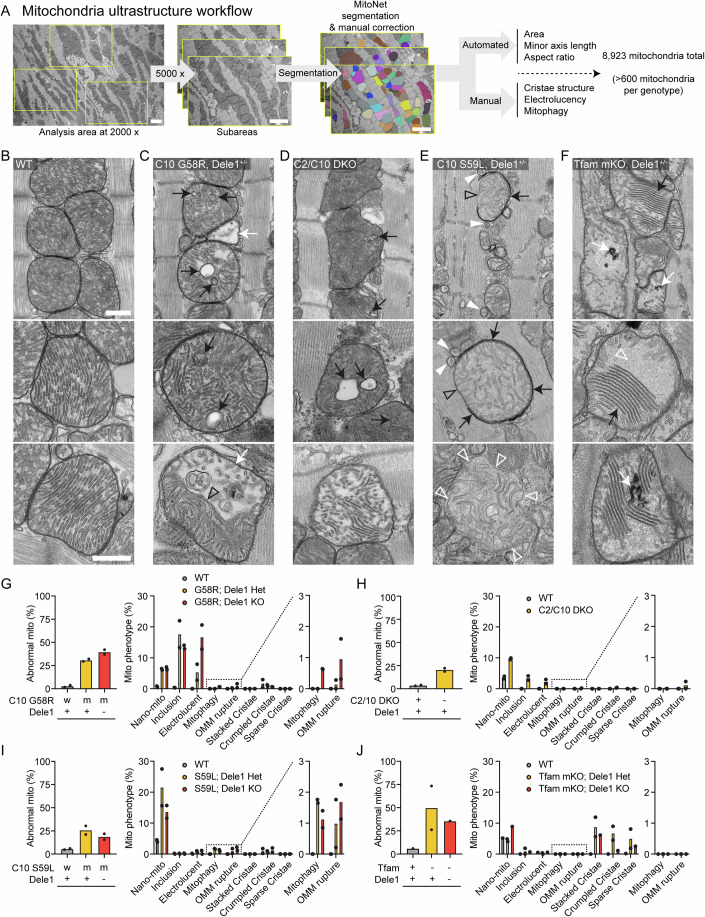
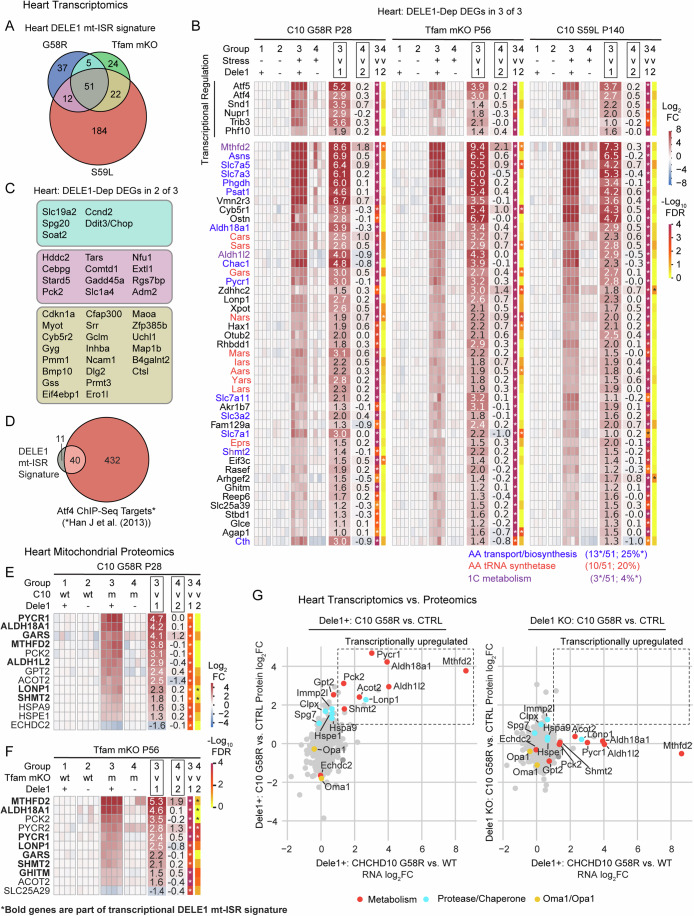
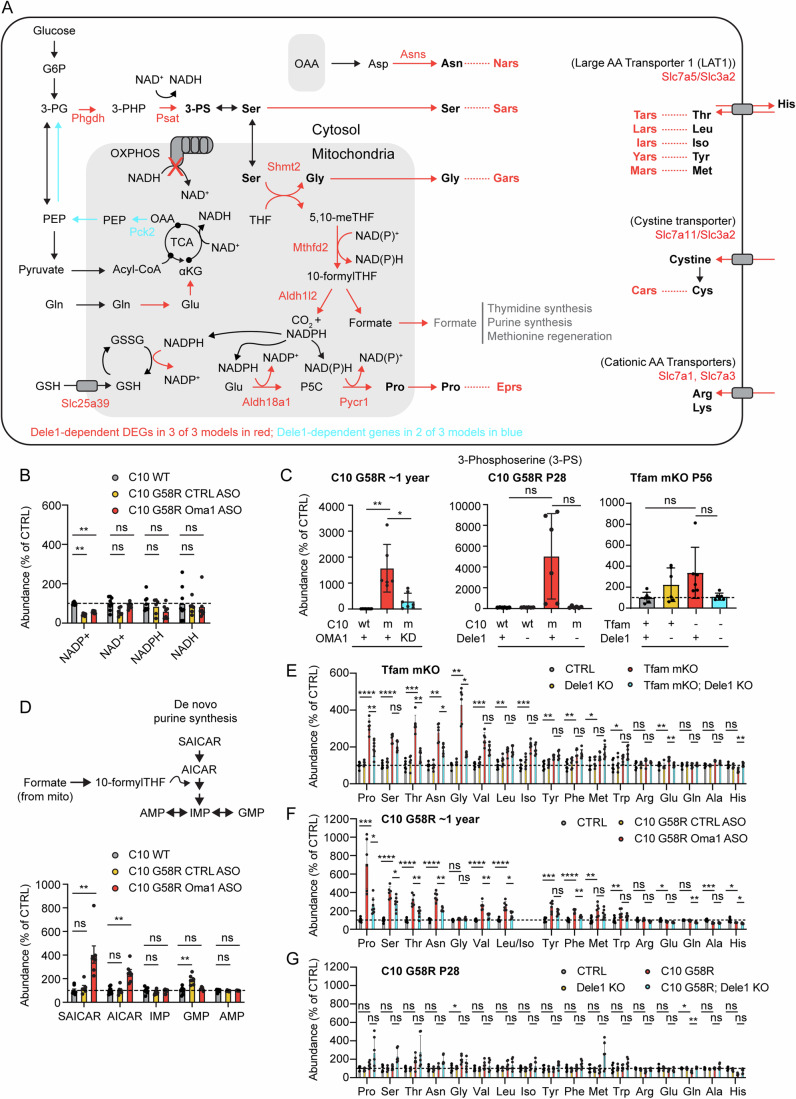
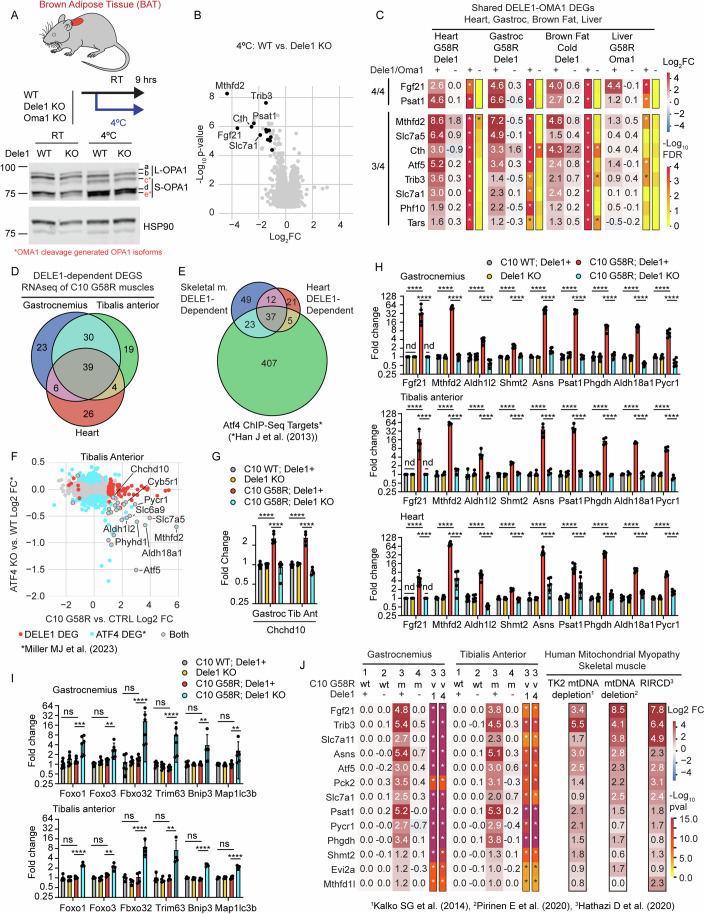
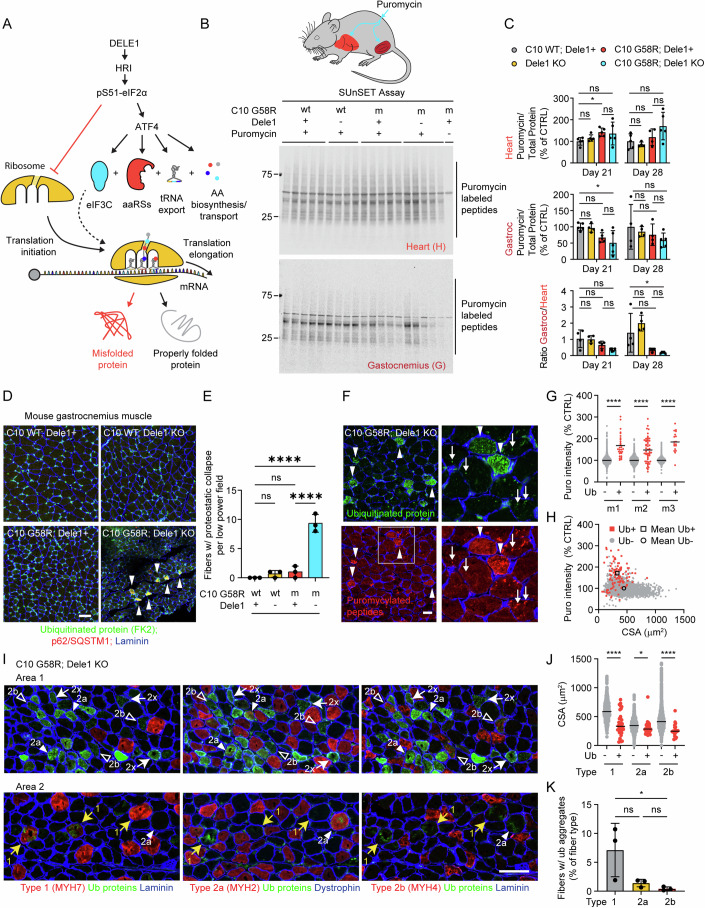
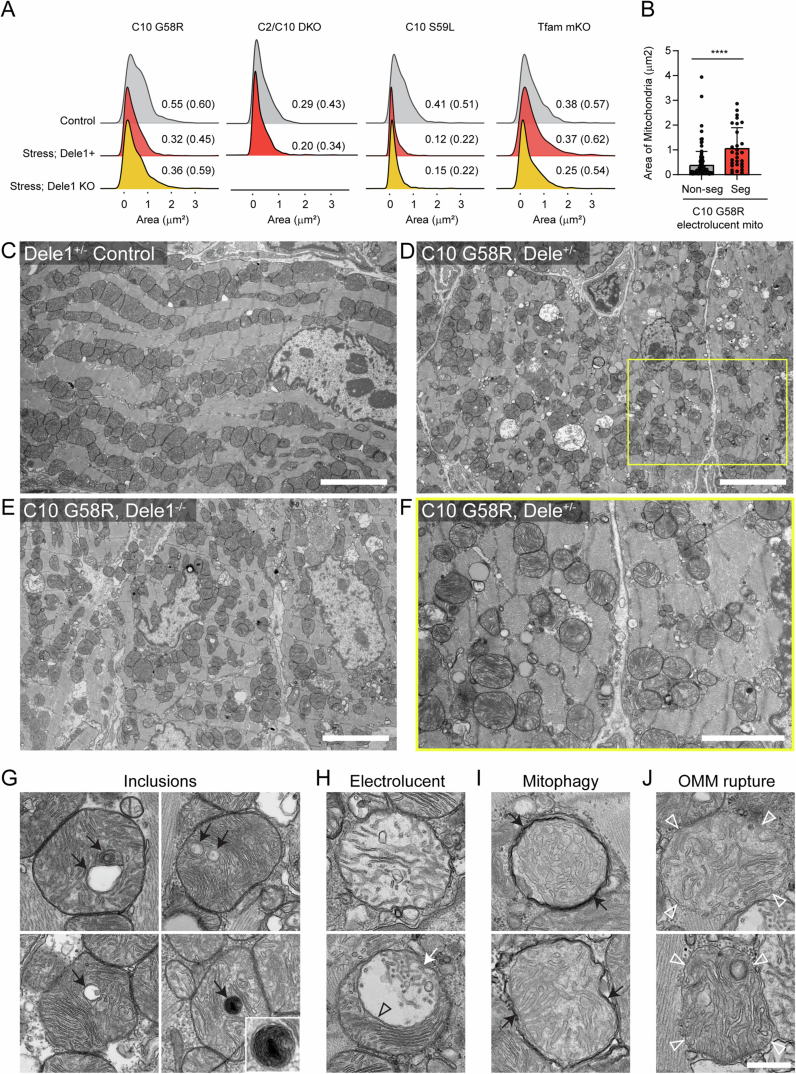
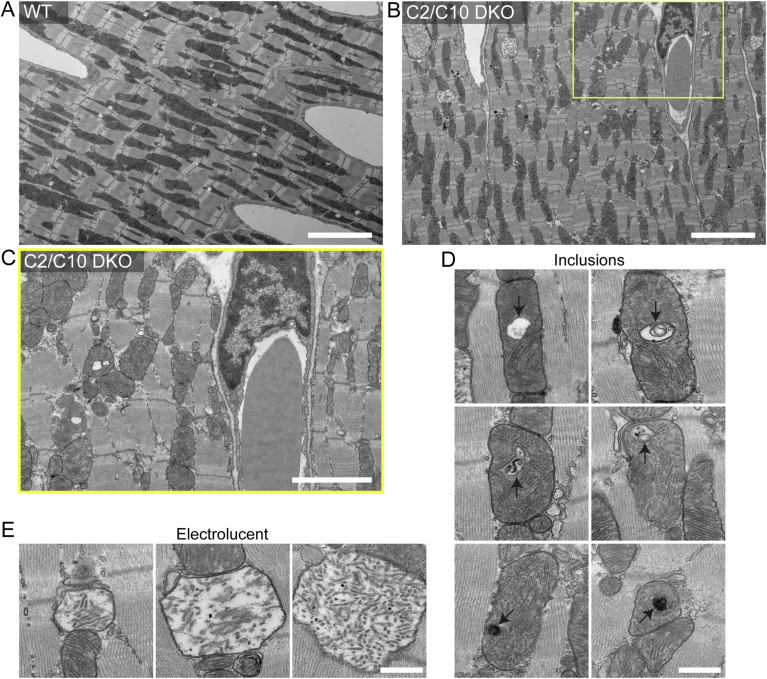
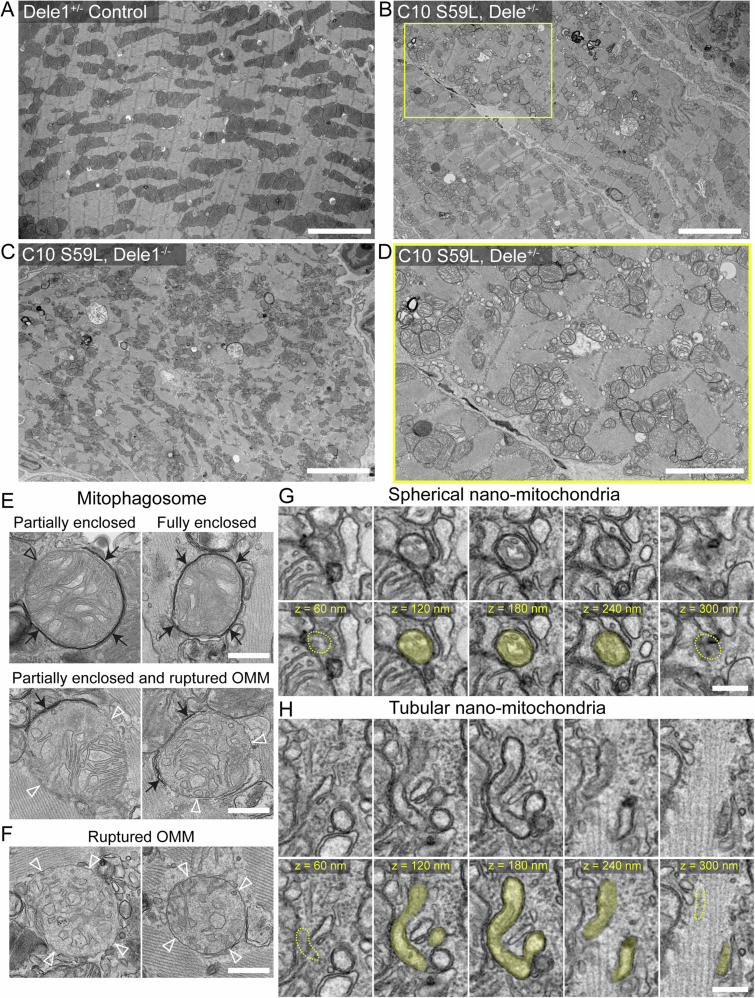
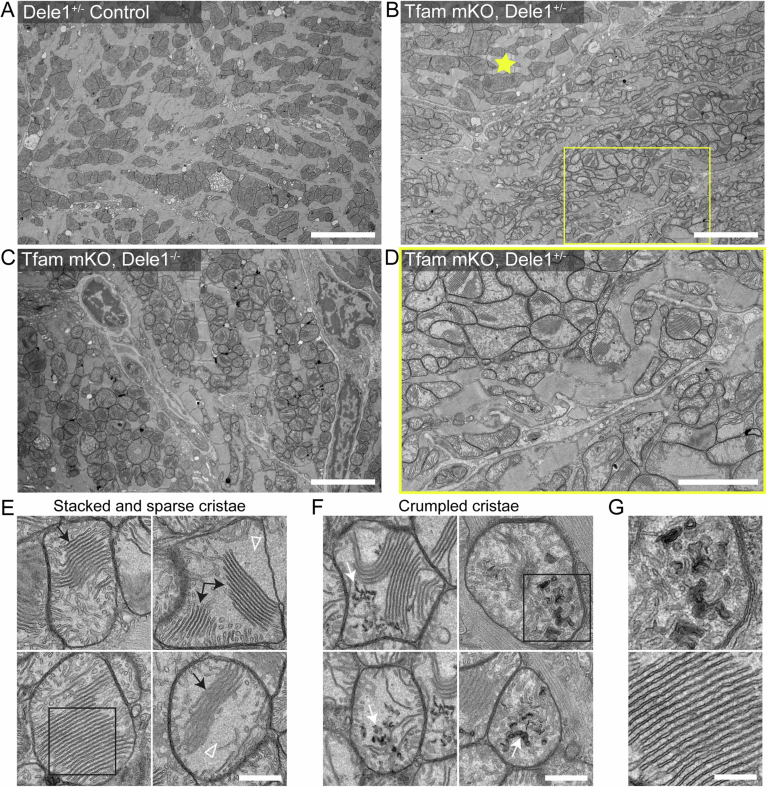
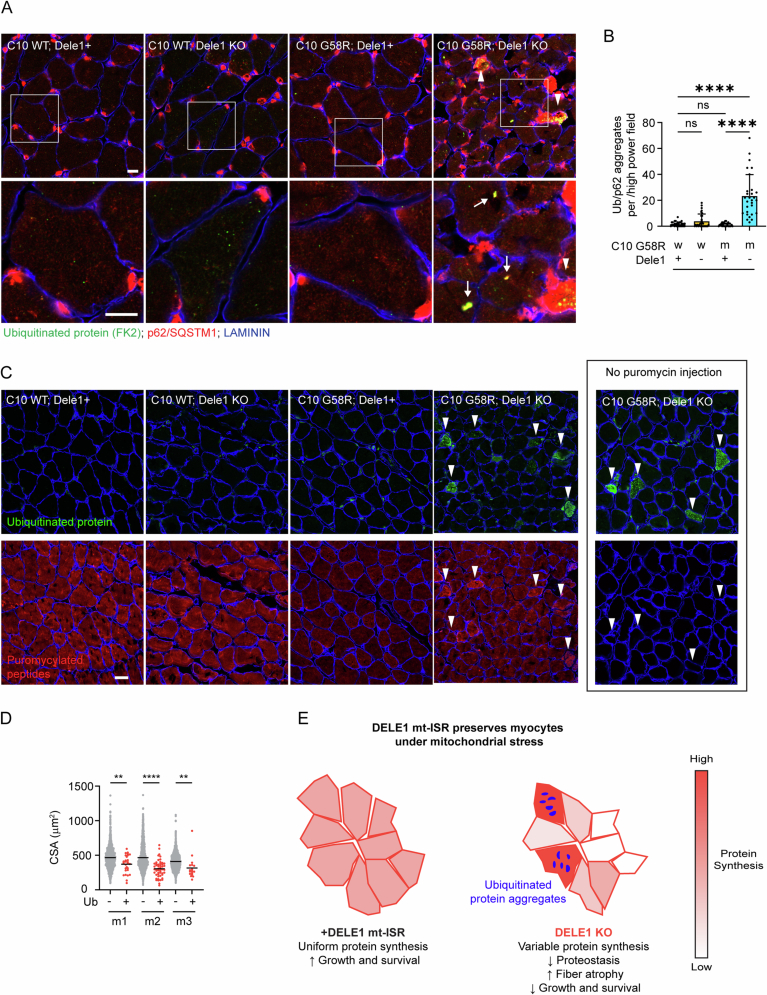
Mitochondrial dysfunction causes devastating disorders, including mitochondrial myopathy, but how muscle senses and adapts to mitochondrial dysfunction is not well understood. Here, we used diverse mouse models of mitochondrial myopathy to show that the signal for mitochondrial dysfunction originates within mitochondria. The mitochondrial proteins OMA1 and DELE1 sensed disruption of the inner mitochondrial membrane and, in response, activated the mitochondrial integrated stress response (mt-ISR) to increase the building blocks for protein synthesis. In the absence of the mt-ISR, protein synthesis in muscle was dysregulated causing protein misfolding, and mice with early-onset mitochondrial myopathy failed to grow and survive. The mt-ISR was similar following disruptions in mtDNA maintenance (Tfam knockout) and mitochondrial protein misfolding (CHCHD10 G58R and S59L knockin) but heterogenous among mitochondria-rich tissues, with broad gene expression changes observed in heart and skeletal muscle and limited changes observed in liver and brown adipose tissue. Taken together, our findings identify that the DELE1 mt-ISR mediates a similar response to diverse forms of mitochondrial stress and is critical for maintaining growth and survival in early-onset mitochondrial myopathy.

Keywords: Mitochondria Unfolded Protein Response (mt-UPR); Mitochondrial Disorders; Mitohormesis; Mitonuclear Communication; Mitophagy.


Conflict of interest statement

Disclosure and competing interests statement The authors declare no competing interests.

Figures

Figure 1
Figure 1. Dependence on DELE1 for growth and survival correlates with onset of mitochondrial stress in diverse models of myopathy and cardiomyopathy.
(A) Schematic depicting the cristae proteostasis stress induced by C2/C10 DKO and gross appearance of C2/C10 DKO mice with and without Dele1 at P5. (B) Body weights of C2/C10 DKO mice with and without Dele1 (Dele1+ indicates either Dele1+/- or Dele1+/+). Statistical analysis performed using mixed-effects model with Geisser-Greenhouse correction and Šidák’s multiple comparisons test with individual variances computed for each comparison. N ≥ 3 mice per group (genotype/age). *, **, *** indicate p ≤ 0.05, 0.01, 0.001, respectively. From left to right, adjusted p-values are 0.0359, 0.0007, and 0.0017. Bar and error bars indicate mean and standard deviation (SD), respectively. (C) Survival analysis of C2/C10 DKO mice. Statistical analysis performed with Log-rank (Mantel-Cox) test. (D) Cartoon depicting protein misfolding stress of C10 G58R (aggregates in IMS) and gross appearance of C10 G58R mice with and without Dele1 at P27. (E) Body weights of C10 G58R mice with and without Dele1 (Dele1+ indicates either Dele1+/- or Dele1+/+). wt = wild type; m = mutant. Statistical analysis performed with Welch ANOVA and Dunnett’s T3 multiple comparisons test. N ≥ 16 mice per group (genotype/age). **** indicates p ≤ 0.0001, “ns” not significant. Adjusted p-values are <0.0001, <0.0001, <0.0001, 0.9986 (bottom row, left to right), <0.0001 (middle row), <0.0001 (top row). Bar and error bars indicate mean and SD, respectively. (F) Survival analysis of C10 G58R mice. Statistical analysis performed with Log-rank (Mantel-Cox) test. (G) Cartoon depicting protein misfolding stress of C10 S59L (aggregates in IMS) and gross appearance of C10 S59L mice with and without Dele1 at P206. (H) Body weights of C10 S59L mice with and without Dele1 (Dele1+ indicates either Dele1+/- or Dele1+/+). wt = wild type; m = mutant. Statistical analysis performed with Welch ANOVA and Dunnett’s T3 multiple comparisons test. Bar and error bars indicate mean and standard error of the mean (SEM), respectively. N ≥ 3 mice per group (genotype/age/sex). (I) Survival analysis of C10 S59L mice. Statistical analysis performed with Log-rank (Mantel-Cox) test. (J) Cartoon depicting disruption of mtDNA maintenance stress induced by Tfam mKO, and gross appearance of Tfam mKO mice with Dele1 at P94 or without Dele1 at P100. (K) Body weights of Tfam mKO mice with and without Dele1 (Dele1+ indicates either Dele1+/- or Dele1+/+). wt = wild type; m = mutant. Statistical analysis performed with Welch ANOVA and Dunnett’s T3 multiple comparisons test. Bar and error bars indicate mean and SEM, respectively. N ≥ 4 mice per group (genotype/age/sex). (L) Survival analysis of Tfam mKO mice. Statistical analysis performed with Log-rank (Mantel-Cox) test. (M) Immunoblots of OPA1 cleavage and mt-ISR marker protein MTHFD2 expression, showing differential time course of activation of the mt-ISR postnatally, in the sequence C2/C10 DKO, C10 G58R, Tfam mKO, and C10 S59L. N = 4 mice per timepoint. Note: in wild-type mouse hearts MTHFD2 is expressed embryonically and on P1 but declines during postnatal development (Nilsson et al, 2014). (N) Quantification of MTHFD2 protein levels from immunoblots in (M). Levels for each group and timepoint are normalized to littermate controls except for C2/C10 DKO, which were normalized to controls for C10 G58R. Median values indicated by bars. N = 4 mice per group (genotype/age). Source data are available online for this figure.
Figure 2
Figure 2. The DELE1 mt-ISR mediates only some of the protective OMA1 stress response and does not reverse underlying OXPHOS defect.
(A) Illustration of breeding strategy to create the cohort. Survival analysis for C10 G58R; Oma1 KO; Dele1 KO triple mutant mice and their littermates. Statistical analysis performed with Log-rank (Mantel-Cox) test. *, **** indicate p ≤ 0.05 and p ≤ 0.0001, respectively. From left to right, p-values are 0.0127 and <0.0001. (B) Schematic demonstrating generation of Opa1∆s1/∆s1 mice through a 30 bp deletion removing the OMA1 preferred cleavage site, s1, from OPA1. Wild-type splice variants 1 and 7 (sp1 and sp7) contain the s1 site. (top); and OPA1 cleavage patterns of C10 G58R; Opa1∆s1/∆s1 mice and control mouse heart lysates (bottom, right). (C) Grip strength (left) and body weights (right) of C10 G58R; Opa1∆s1/∆s1 and their littermates at 13 weeks. Gray bar = control; yellow bar = Opa1∆s1/∆s1; red bar = C10 G58R; blue bar = C10 G58R; Opa1∆s1/∆s1. Each dot represents one mouse. Statistical analysis for grip strength (left graph) performed with Welch ANOVA and Dunnett’s T3 multiple comparisons test. N ≥ 7 mice per group (genotype/age/sex). Adjusted p-values are 0.0243 (bottom row), >0.9999 (second from bottom), <0.0001 (third from bottom), <0.0001 (top row). (right) Statistical analysis for body weight performed with an ordinary two-way ANOVA with Tukey’s multiple comparisons test, with a single pooled variance. (for males) adjusted p-values are 0.0298 (bottom), 0.9997(second from bottom), <0.0001 (third from bottom), <0.0001 (top). (for females) adjusted p-values are 0.9241 (bottom), 0.8223 (second from bottom), <0.0001 (third from bottom), <0.0001 (top). In all graphs, *, **** indicates p ≤ 0.05 and p ≤0.0001, respectively, “ns” not significant. Bar and error bars indicate mean and SD, respectively. (D) Survival analysis of C10 G58R; Opa1∆s1/∆s1 mice and their littermates. Statistical analysis performed with Log-rank (Mantel-Cox) test. (E) Gene expression analysis of prespecified ISR genes from C10 G58R; Dele1 KO mice and littermates at P28 compared to a previously published dataset from 14-week-old C10 G58R; Oma1 KO mice (Shammas et al, 2022). Data from same C10 G58R; Dele1 KO dataset also appears in (Appendix Figs. S1B; Figs. 4A–D,G and 6C). wt = wild type; m = mutant. (F) Scatterplot depicting relative abundance of OXPHOS complexes I–V subunits, Coenzyme Q biosynthesis pathway, and mito-ribosome in Tfam mKO; Dele1 KO mice and littermates detected from crude mitochondrial preparations of mouse hearts. See also Appendix Fig. S4A for statistical analysis. N = 4 mice per group. Data from this proteomics dataset also appears in Fig. 4F and Appendix Fig. S7B,C,E. (G) Scatterplot depicting relative abundance of OXPHOS complexes I–V subunits, Coenzyme Q biosynthesis pathway, and mito-ribosome in C10 G58R; Dele1 KO mice and littermates detected from crude mitochondrial preparations of mouse hearts. See also Appendix Fig. S4A for statistical analysis comparing differences in subunit expression between genotypes. N = 4 mice per group. Data from this proteomics dataset also appears in Appendix Fig. S1D, Fig. 4E,G, and S7C,D. (H) Scatterplot depicting relative abundance of OXPHOS complexes I–V subunits, Coenzyme Q biosynthesis pathway, and mito-ribosome in C2/C10 DKO and unrelated age-matched WT animals detected from crude mitochondrial preparations of mouse hearts. See also Appendix Fig. S4A for statistical analysis. N = 4 mice per group. (I) Graphs compare protein abundance of mtDNA- vs. nDNA-encoded OXPHOS subunits from data in (FH). Statistical analysis for Tfam (left graph) was performed using the Mann–Whitney test, as the data were not normally distributed, and statistical analysis for C10 G58R (middle graph) and C2/C10 DKO (right graph) were performed using the unpaired Welch’s t-test. P-values = 0.0087 (left graph), 0.4005 (middle graph), and 0.1508 (right graph). In all graphs, ** indicates p ≤ 0.01 and “ns” not significant. Bars indicate median values. (J, K) Seahorse oxygen consumption-based measurements of CI and CIV activities from frozen mitochondria isolated from hearts of the indicated genotypes. wt = wild type; m or mut = mutant. Statistical analysis performed with Welch ANOVA and Dunnett’s T3 multiple comparisons test (J) and unpaired Welch’s t-test (K). In (J, left most graph) p-values = 0.02304 and 0.6378 (bottom row, left to right) and 0.0188 (top row); in (J, second graph from left) p-values = 0.0032 and 0.1719 (bottom row, left to right) and 0.0022 (top row); in (J, third graph from left) p-values = 0.0006 (bottom), >0.9999 (middle) and 0.0006 (top)); in (J, right most graph) p-values = 0.0029 (bottom), 0.5977 (middle) and 0.0054 (top). In (K), p-value = 0.0102 (left graph) and 0.9437 (right graph). In all graphs, *, **, and *** indicate p ≤ 0.05, p ≤ 0.01, p ≤ 0.001, respectively, and “ns” not significant. Bars indicate mean values and error bars SEM. Source data are available online for this figure.
Figure 3
Figure 3. Mitochondrial stressors alter the ultrastructure of heart mitochondria in characteristic ways, most of which are not suppressed by the DELE1 mt-ISR.
(A) Workflow for analysis of mitochondria from hearts of diverse myopathy/cardiomyopathy models, combining deep learning aided segmentation of TEM images with manual scoring of characteristic ultrastructural features. Scale bars = 2 µm. (B) Representative TEM images of mitochondria from wild-type hearts. A field of view containing several mitochondria (top) and higher magnification views of individual mitochondria (below). Scale bars = 500 nm. (C) Representative TEM images of mitochondria in C10 G58R hearts which exhibited cristal inclusions (black arrows) and electrolucent mitochondria (white arrow in top and bottom images). The bottom image shows a segmented type of electrolucent mitochondria with a cut-through cristae (open black arrowhead) forming the boundary between the electrolucent portion of the mitochondria, and that with a more typical appearance. Scale bars = 500 nm. (D) Representative TEM images of mitochondria in the C2/C10 DKO hearts which were characterized by cristal inclusions (black arrows) and the presence of electrolucent mitochondria (bottom). Scale bars = 500 nm. (E) Representative TEM images of mitochondria in C10 S59L hearts showed nano-sized mitochondria defined as measuring <250 nm diameter in their minor axis with an aspect ratio <1.5 (white arrowheads), mitochondria partially enclosed in electron-dense phagophore membranes (black arrows) with a portion of their periphery not enclosed (open black arrowheads), and mitochondria with a ruptured OMM (bottom image). Open white arrowheads indicate sites where the single layer of IMM is visible and OMM is absent. Scale bars = 500 nm. (F) Representative images of mitochondria in Tfam mKO hearts that displayed closely aligned stacked cristae (black arrows) and crumpled cristae (white arrows), as well as areas of where cristae were sparse, and a homogeneous light gray matrix material was present (open white arrowheads). Scale bars = 500 nm. The mitochondrion in middle image is cropped from same cell as the mitochondrion shown in (Fig. EV4E, bottom left). (G) Quantification of ultrastructural features for C10 G58R; Dele1 KO at P28 and indicated littermates. (H) Quantification of ultrastructural features for C2/C10 DKO animals and unrelated age-matched controls at 3–4 months old. (I) Quantification of ultrastructural features for C10 S59L; Dele1 KO at P140 and indicated littermates. (J) Quantification of ultrastructural features for Tfam mKO; Dele1 KO at P56 and indicated littermates. Source data are available online for this figure.
Figure 4
Figure 4. DELE1 drives a stereotyped transcriptional response to diverse mitochondrial stressors and reshapes the mitochondrial proteome in the heart.
(A) Venn diagram depicting intersection of 51 DELE1-dependent DEGs common to all three MM/CM models (the DELE1 mt-ISR heart signature), identified in microarray data. Data from the C10 G58R; Dele1 KO dataset also appears in Appendix Fig. S1B, Figs. 2E and 6C. (B) Heat map depicting fold change for DELE1-dependent DEGs identified in all three models (left). Those annotated as regulating transcription in Lambert et al, (2018) are separated from other genes. *Shmt2 is in both the “AA transport/biosynthesis” and the “1C metabolism” categories. Reported FDR was calculated in TAC v4.0.3 software across all genes in dataset, using the default settings, which uses a one-way ANOVA corrected with the Benjamini-Hochberg procedure for multiple procedures. (C) DELE1-dependent DEGs common to two of three myopathy/cardiomyopathy models (color coded as in (A)). (D) Venn diagram shows overlap between DELE1 mt-ISR heart signature and previously identified ATF4 targets in mouse cells, using ATF4 ChIP-Seq from (Han et al, 2013). (E) Heat map showing significant DELE1-dependent changes in mitochondrial protein abundance in C10 G58R hearts. N = 4 mice per condition. Statistics for proteomics data (which also appear in Dataset EV3) were performed as described in the Methods with correction for multiple comparisons across all protein groups in the dataset. (F) Heat map showing significant DELE1-dependent changes in mitochondrial protein abundance in Tfam mKO hearts. N = 4 mice per condition, except for C10 S59L group2 which was N = 3 mice. Statistics for proteomics data (which also appear in Dataset EV3) were performed as described in the Methods with correction for multiple comparisons across all protein groups in the dataset. (G) Scatterplots compares RNA log2FC for C10 G58 vs. control (in the presence of Dele1) and mitochondrial protein log2FC for C10 G58R vs. control animals in the presence of Dele1 (left) or the absence of Dele1 (right). Source data are available online for this figure.
Figure 5
Figure 5. DELE1 mt-ISR maintains anabolic mitochondrial pathways, including for protein synthesis intermediates.
(A) Diagram depicts major intersections among 22 (out of 51) pro-anabolic genes that are upregulated as part of the DELE1 mt-ISR heart signature (gene names in red). Additional genes (in blue) were identified in 2/3 models. Key pathways intersecting mitochondria include those for the biosynthesis of glycine, serine, proline, and asparagine. Upregulation of these pathways is coordinated with upregulation of genes for the corresponding aminoacyl tRNA synthases. (B) Individual data for levels of NAD+, NADH, NADP+, and NADPH detected by untargeted metabolomics of heart tissue from ~1-year-old (319–411 days) C10 G58R mice injected with CTRL or Oma1 ASOs or wild-type littermates injected with PBS for 6 weeks prior to sacrifice. Data is from the named dataset that also appears in Dataset EV4. Statistical analysis for the metabolomics dataset is described in Methods. Significance indicated on graph, tested using two-sided Student’s t-tests, was corrected for multiple comparisons across all metabolites in the dataset, using the Benjamini–Hockberg procedure. Error bars indicate the SD. From left to right, adjusted p-values = 2.58E−07, 0.04948, 0.6861, 0.8274 (bottom row) and 1.08E−06, 0.5264, 0.1282, 0.7702 (top row). ** indicates p ≤ 0.01 and “ns” not significant. (C) Levels of 3-phosphoserine measured by untargeted proteomics in adult C10 G58R mice as in (B) or by targeted metabolomics in P28 C10 G58R mice and P56 Tfam mKO mice. W denotes wild type; m denotes mutant. Data is from the named dataset that also appears in Dataset EV4 (for C10 G58R ~ 1 year) and Dataset EV5 (for P28 C10 G58R and Tfam mKO). Statistical analysis for the metabolomics dataset is described in Methods. Significance indicated on graph, tested using two-sided Student’s t-tests, was corrected for multiple comparisons across all metabolites in the dataset, using the Benjamini–Hockberg procedure. Error bars indicate the SD. (In left graph) adjusted p-values = 0.001630 and 0.05766 (left to right); (in middle graph) adjusted p-values = 0.3344 and 0.2107 (left to right); and (in right graph) adjusted p-values = 0.1039 and 0.2845 (left to right). *, ** indicates p ≤ 0.05 and p ≤ 0.01, respectively, and “ns” not significant. N ≥ 6 mice per group (genotype). (D) Levels of intermediates of de novo purine synthesis that are sensitive to blocks in the mitochondrial 1C metabolism pathway measured from hearts of ~1-year-old C10 G58R by untargeted metabolomics as in (B). Data is from the unnamed dataset that also appears in Dataset EV4 (for C10 G58R ~ 1 year). Statistical analysis for the metabolomics dataset is described in Methods. Significance indicated on graph, tested using two-sided Student’s t-tests, was corrected for multiple comparisons across all metabolites in the dataset, using the Benjamini–Hockberg procedure. Adjusted p-values (for metabolites left to right) for C10 WT vs. C10 G58R; CTRL ASO are 0.9709, 0.5572, 0.4919, 0.004337, and 0.6930. Adjusted p-values (for metabolites left to right) for C10 WT vs. C10 G58R; OMA1 ASO are 0.003006, 0.007981, 0.8724, 0.3951, and 0.8988. Error bars indicate the SD. ** indicates p ≤ 0.01 and “ns” not significant. N ≥ 6 mice per group (genotype). (EG) Levels of amino acids measured from hearts of P56 Tfam mKO, ~1-year-old C10 G58R, or P28 C10 G58R mice as in (C). Data is from the unnamed dataset that also appears in Dataset EV4 (for C10 G58R ~ 1 year) and the named datasets in Dataset EV5 (for P28 C10 G58R and Tfam mKO). Statistical analysis for the metabolomics dataset is described in Methods. Significance indicated on graph, tested using two-sided Student’s t-tests, was corrected for multiple comparisons across all metabolites in the dataset, using the Benjamini–Hockberg procedure. In (E), adjusted p-values for CTRL vs. Tfam mKO; Dele1 KO comparison (for metabolites listed left to right) were 2.67E−05, 9.30E−06, 0.0001437, 0.001376, 0.001376, 0.0002088, 0.001959, 0.0002551, 0.007751, 0.005143, 0.01233, 0.03223, 0.08644, 0.001959, 0.5636, 0.0002551, 0.1087. In (E), adjusted p-values for Tfam mKO vs. Tfam mKO; Dele1 KO comparison (for metabolites listed left to right) were 0.003740, 0.0006115, 0.01132, 0.001234, 0.003740, 0.001615, 0.001740, 0.001615, 0.004377, 0.003740, 0.004263, 0.004849, 0.06566, 0.2845, 0.1847, 0.1052, 0.1515. In (F) adjusted p-values for CTRL vs. C10 G58R; CTRL ASO comparison (for metabolites listed left to right) were 0.0006519, 3.58E−06, 4.57E−05, 2.71E−06, 0.04601, 3.55E−05, 6.62E−05, 0.0005232, 3.16E−05, 0.007724, 0.01307, 0.5611, 0.06687, 0.2196, 0.001016, 0.04463. In (F), adjusted p-values for C10 G58R; CTRL ASO vs. C10 G58R; Oma1 ASO KO comparison (for metabolites listed left to right) were 0.004201, 0.0005487, 0.01111, 1.47E−05, 0.1337, 0.005503, 0.007491, 0.001017, 0.001807, 0.03986, 0.08713, 0.09570, 0.005235, 5.26E−05, 0.0009977, 0.009547. In (G), adjusted p-values for CTRL vs. C10 G58R Dele1 KO comparison (for metabolites listed left to right) were 0.1762, 0.06858, 0.1762, 0.06858, 0.2655, 0.2837, 0.2655, 0.2655, 0.1630, 0.1242, 0.1866, 0.1418, 0.7218, 0.6800, 0.2655, 0.1762, 0.8507. In (G), adjusted p-values for C10 G58R vs. C10 G58R; Dele1 KO comparison (for metabolites listed left to right) were 0.2684, 0.1241, 0.3593, 0.1500, 0.2196, 0.9517, 0.8701, 0.6962, 0.1512, 0.2196, 0.2196, 0.2196, 0.2196, 0.7206, 0.008545, 0.3180, 0.1500. In all graphs, *, **, ***, **** indicates p ≤ 0.05, 0.01, 0.001, 0.0001, respectively, and “ns” not significant. N ≥ 6 mice per group (genotype). Error bars represent SD. Source data are available online for this figure.
Figure 6
Figure 6. The DELE1 mt-ISR is observed in several mitochondria-rich tissues and has greatest overlap between heart and skeletal muscle.
(A) Dele1 KO and WT littermates were challenged with cold stress for 9 h and interscapular BAT was analyzed by immunoblotting for OPA1 cleavage by OMA1. OMA1 cleavage generated OPA1 isoforms are in indicated in red as c* and e*. (B) Volcano plot of global gene expression changes in cold stressed Dele1 KO vs. WT littermates measured by microarray; significant genes (FDR < 0.05 and |Log2FC| > 1) are in black. Statistics were performed as described in Methods for all microarray-based transcriptomics. N = 7 mice per group. (C) Heat map shows overlap among DELE1-dependent DEGS in four mitochondrial-rich tissues: heart, gastrocnemius (gastroc) skeletal muscle, and liver from C10 G58R mice, in addition to BAT from mice subjected to cold stress. BAT microarray data from same dataset that also appears in Appendix Fig. S1B. C10 G58R heart microarray data are from the same dataset that also appears in Appendix Fig. S1B, Fig. 2E, and Fig. 4B. Statistics on all microarray data (which also appear in Dataset EV6) were performed as described in Methods for all microarray-based transcriptomics. FDR values were corrected for multiple comparisons across all transcripts in dataset. N = 4 for all groups except for C10 G58R; Dele1+ liver, which was N = 3. (D) Venn diagram shows intersection of C10 G58R DELE1-dependent DEGs from three muscles (gastrocnemius, tibalis anterior, and heart), measured by RNA-Seq at P28 (data also available in Dataset EV7–EV9). (E) Venn diagram shows intersection of skeletal and and heart muscle DELE1-dependent DEGs as in (D) with ATF4 target genes, from previously published ATF4 ChIP-Seq dataset (Han et al, 2013). (F) Scatterplot shows correlation between genes that increase in tibalis anterior of P28 C10 G58R mice vs. CTRL and those that decrease in abundance in tibalis anterior from 6-month-old ATF4 skeletal muscle knockout mice vs. CTRL, from a previously published dataset (Miller et al, 2023). (G, H) Individual data is shown for select DELE1-dependent genes detected from skeletal muscle and/or heart from P28 C10 G58R mice, by RNA-Seq (data for all detected genes in Dataset EV7–EV9). Fgf21 was below detection limit (not detected, “nd”) in all but the C10 G58R; Dele1+ condition. Significance was first tested with a two-way ANCOVA including genotype and sex as variables. For post hoc testing) after ANCOVA (shown in Figure), the general linear hypotheses was used in conjunction with the multiple comparisons of means (“mcp”) function to test for all possible two-way comparisons via “Tukey” method. For (G), p-values were 1.98E−08 and 6.98E−07 (for bottom row) and 7.12E−10 and 6.62E−08 (for top row). For (H, top graph, gastrocnemius) p-values for C10 WT; Dele1+ vs. C10 G58R; Dele1+ (for genes left to right) were 0, 0, 2.58E−09, 1.89E−15, 0, 0, 0, 0, and 1.11E−16, and for C10 G58R; Dele1+ vs. C10 G58R; Dele1 KO (for genes left to right) were 0, 0, 1.19E−12, 2.50E−13, 0, 0, 0, 0, and 0. For (H, middle graph, tibialis anterior) p-values for C10 WT; Dele1+ vs. C10 G58R; Dele1+ (for genes left to right) were 4.37E−07, 0, 4.63E−06, 7.99E−09, 4.97E−11, 0, 0, 2.33E−15, 3.42E−13 and for C10 G58R; Dele1+ vs. C10 G58R; Dele1 KO (for genes left to right) were 8.51E−08, 0, 2.24E−05, 1.37E−08, 1.24E−12, 0, 2.22E−16, 7.77E−16, and 0. For (H, top graph, heart) p-values for C10 WT; Dele1+ vs. C10 G58R; Dele1+ (for genes left to right) were 1.57E−10, 0, 1.42E−11, 1.63E−12, 0, 2.71E−09, 0, 0, and 0, and for C10 G58R; Dele1+ vs. C10 G58R; Dele1 KO (for genes left to right) were 6.21E−10, 1.22E−12, 1.55E−15, 3.22E−15, 1.16E−13, 0.0001011, 0, 0, 0. In all graphs, **** indicates p ≤ 0.0001, respectively, and “ns” not significant. Error bars represent SD. N ≥ 4 mice per group (genotype). (I) individual data is shown for select genes significantly elevated in skeletal muscles of only C10 G58R; Dele1 KO and no other genotypes relative to control. Significance was first tested with a two-way ANCOVA including genotype and sex as variables. For post hoc testing) after ANCOVA (shown in Figure), the general linear hypotheses was used in conjunction with the multiple comparisons of means (“mcp”) function to test for all possible two-way comparisons via “Tukey” method. For gastrocnemius (top graph), p-values for C10 WT; Dele1+ vs. C10 G58R; Dele1+ (for genes left to right) were 0.7386, 0.3720, 0.8302, 0.8152, 0.9998, and 0.9999, and for C10 G58R; Dele1+ vs. C10 G58R; Dele1 KO (for genes left to right) were 0.0007080, 0.001020, 7.28E−05, 2.80E−05, 0.003794, 0.005845. For tibialis anterior (bottom graph), p-values for C10 WT; Dele1+ vs. C10 G58R; Dele1+ (for genes left to right) were 0.9919, 0.3088, 0.9999, 0.9984, 0.2705, 0.9920, and for C10 G58R; Dele1+ vs. C10 G58R; Dele1 KO (for genes left to right) were 3.52E−05, 0.002405, 1.66E−05, 0.001349, 1.16E−07, 1.30E−08. In all graphs, **, ***, **** indicates p ≤ 0.01, 0.001, 0.0001, respectively, and “ns” not significant. Error bars represent SD. N ≥ 4 mice per group (genotype). (J) Heat map of 13 mouse genes that are DELE1-dependent in C10 G58R gastrocnemius and tibialis anterior model (as in D) and have human orthologs that are upregulated by >2-fold (on average) in three previously published datasets from mitochondrial myopathy patients (Hathazi et al, ; Pirinen et al, ; Kalko et al, 2014). P-values were corrected for multiple comparisons across all transcripts in dataset. Source data are available online for this figure.
Figure 7
Figure 7. DELE1 mt-ISR promotes translation-associated proteostasis in striated muscle.
(A) Model depicts predicted effects of the DELE1 mt-ISR on protein translation including acute inhibition of translation initiation by pS51-eIF2α, resumption of protein initiation following the transcriptional upregulation of Eif3c, and facilitation of translation elongation through increased production of protein synthesis intermediates by the coordinated upregulation of (1) genes related amino biosynthesis and transport, (2) Xpot to mediate tRNA export from the nucleus to the cytosol, and (3) aminoacyl-tRNA synthases (aaRSs) to promote aminoacyl conjugation to tRNAs. Protein translation dynamics and fidelity can affect the proportion of newly translated proteins that fold properly vs. misfold. (B, C) Measurement of in vivo protein synthesis in C10 G58R; Dele1 KO mice and indicated littermates at P21 and P28, using the SUnSET assay. Blot for P21 timepoint is shown in (B). Mice were injected with the aminoacyl-tRNA ortholog, puromycin, sacrificed 30 min later, and puromycin incorporation into newly synthesized polypeptides in heart and gastrocnemius tissue lysates was measured by immunoblotting. Statistical analysis performed using Welch ANOVA and Dunnett’s T3 multiple comparisons test. (Top graph, heart, Day 21) adjusted p-values were 0.4894 for C10 WT; Dele1+ vs. Dele1 KO, 0.0236 for C10 WT; Dele1+ vs. C10 G58R; Dele1+, 0.5341 for C10 WT; Dele1+ vs. C10 G58R; Dele1 KO, and 0.9978 for C10 G58R; Dele1+ vs. C10 G58R; Dele1 KO. (Top graph, heart, Day 28) adjusted p-values were 0.8419 for C10 WT; Dele1+ vs. Dele1 KO, 0.8923 for C10 WT; Dele1+ vs. C10 G58R; Dele1+, 0.2250 for C10 WT; Dele1+ vs. C10 G58R; Dele1 KO, and 0.4979 for C10 G58R; Dele1+ vs. C10 G58R; Dele1 KO. (Middle graph, gastroc, Day 21) adjusted p-values were 0.9990 for C10 WT; Dele1+ vs. Dele1 KO, 0.1338 for C10 WT; Dele1+ vs. C10 G58R; Dele1+, 0.0136 for C10 WT; Dele1+ vs. C10 G58R; Dele1 KO, and 0.7086 for C10 G58R; Dele1+ vs. C10 G58R; Dele1 KO. (Middle graph, gastroc, Day 28) adjusted p-values were 0.9841 for C10 WT; Dele1+ vs. Dele1 KO, 0.9399 for C10 WT; Dele1+ vs. C10 G58R; Dele1+, 0.7107 for C10 WT; Dele1+ vs. C10 G58R; Dele1 KO, and 0.8419 for C10 G58R; Dele1+ vs. C10 G58R; Dele1 KO. (Top graph, gastroc/heart ratio, Day 21) adjusted p-values were 0.9999 for C10 WT; Dele1+ vs. Dele1 KO, 0.6361 for C10 WT; Dele1+ vs. C10 G58R; Dele1+, 0.2390 for C10 WT; Dele1+ vs. C10 G58R; Dele1 KO, and 0.1941 for C10 G58R; Dele1+ vs. C10 G58R; Dele1 KO. (Top graph, gastroc/heart ratio, Day 28) adjusted p-values were 0.8820 for C10 WT; Dele1+ vs. Dele1 KO, 0.4304 for C10 WT; Dele1+ vs. C10 G58R; Dele1 +, 0.3415 for C10 WT; Dele1+ vs. C10 G58R; Dele1 KO, and 0.1941 for C10 G58R; Dele1+ vs. C10 G58R; Dele1 KO. In all graphs, * indicates p ≤ 0.05 and “ns” not significant. N ≥ 4 mice per group (genotype). Error bars represent SD. (D) Representative immunofluorescence images of gastrocnemius muscle from P28 C10 G58R; Dele1 KO mice and indicated littermates, showing fibers with many or confluent aggregates of ubiquitinated proteins co-localized with the aggregate-forming adapter protein p62, suggesting proteostatic collapse (arrowheads) in low power (20×) images (top panels). Scale bars = 50 μm. (E) Quantification of (D). N = 3 mice per genotype with 30 low power fields counted per genotype. Low-power field size was 397.75 μm × 397.75 μm. Statistical analysis performed using ordinary one-way ANOVA with Šidák’s multiple comparisons test, with a single pooled variance. N = 3 in each group. P = 0.8857 for C10 WT; Dele1+ vs. C10 WT; Dele1 KO. P = 0.6605 for C10 WT; Dele1+ vs. C10 G58R; Dele1 +. ns = non-significant. **** =< 0.0001. Error bars represent SD. (F) Representative immunofluorescence images of gastrocnemius muscle from P28 C10 G58R; Dele1 KO mice injected with puromycin 30 min prior to sacrifice as in (B). Muscle cross-sections were immunostained for ubiquitinated proteins (using the FK2 antibody) (green), puromycin (red), and laminin (blue). Arrowheads indicate muscle fibers containing many or confluent aggregates of ubiquitinated proteins that were also co-stained for elevated puromycylated polypeptides. Arrows indicate individual aggregates of ubiquitin proteins that also contain puromycylated polypeptides. Scale bars = 20 μm. (G, H) Quantification of (F). Individual myofibers were automatically segmented using the Laminin immunofluorescence to define the myofiber border. Average puromycin fluorescence intensity and cross-sectional area (CSA) were measured for each myofiber. Separately myofibers were manually scored as containing many or confluent aggregates of ubiquitinated proteins (Ub+ or Ub- muscle fibers, respectively). The average puromycin intensity for Ub+ and Ub- myofiber is shown in graph separately for three mice (m1–3). N = 3 mice with 10 high power fields counted per mouse. The scatterplot in (H) shows the relationship between myofiber CSA and puromycin intensity for all myofibers analyzed in (G). Fibers with CSA < 50 μm were excluded from analysis. Statistical analysis was performed using Kruskal–Wallis test with Dunn’s multiple comparisons test as data was non-parametrically distributed for (G). (I) Representative confocal images show three consecutive sections through two areas of gastrocnemius from C10 G58R; Dele1 KO mice triple stained for muscle fiber type 1, 2a, or 2b (red) and FK2 to detect ubiquitin protein aggregates (green) and a sarcolemma marker protein laminin or dystrophin (blue). Fiber type 2x is defined by the absence of any other fiber marker in the consecutive sections. Areas 1 and 2 are magnifications of the boxed areas in Appendix Fig. S16, which shows the whole tissue section. Scale bar = 100 μm. Yellow arrow = type 1 fiber, solid white arrowhead = type 2a fiber, open white arrowhead = 2b fiber, and solid white arrow = 2x fiber. (J) Graph quantifying the CSA of fibers with and without aggregates of ubiquitinated proteins, separated by fiber type as in (I). Gastrocnemius from three C10 G58R; Dele1 KO mice were analyzed. Statistical analysis was performed using Kruskal–Wallis test with Dunn’s multiple comparisons test as data was non-parametrically distributed. (K) Graph quantifying the proportion of each fiber types that contained aggregates of ubiquitinated proteins from tissue stained as in (I). Gastrocnemius from three C10 G58R; Dele1 KO mice were analyzed. Statistical analysis was performed using Kruskal–Wallis test with Dunn’s multiple comparisons test as data was non-parametrically distributed. N = 3 in each group. P = 0.4081 for percent of type 1 myofibers with FK2 aggregates vs. percent of type 2a myofibers with FK2 aggregates. P = 0.0338 for percent of type 1 myofibers with FK2 aggregates vs. percent of type 2b myofibers with FK2 aggregates. P = 0.8902 for percent of type 1 myofibers with FK2 aggregates vs. percent of type 2b myofibers with FK2 aggregates. ns = non-significant. * = <0.05. Error bars represent SD. Source data are available online for this figure.
Figure EV1
Figure EV1. TEM of myocardium and ultrastructural features of mitochondria in C10 G58R on Dele1+/− and Dele1 KO backgrounds.
(A) Kernel density plots showing distribution of mitochondrial areas for indicated genotypes, measured from TEM images of heart mitochondria. Median values and, in parentheses, interquartile ranges are reported adjacent to curves. N = 2 animals per genotype except for Tfam mKO; Dele1 KO, where only 1 animal was available. >600 mitochondria were measured per animal. P value was <0.0001. Bar and error bars represent mean and SD, respectively. (B) Bar graph comparing the areas of segmented and non-segmented types of electrolucent mitochondria that were obtained from analysis of C10 G58R animals and littermates in (A). Statistics were performed using Mann–Whitney test, as the data had a non-parametric distribution. **** indicates p ≤ 0.0001. (CE) Representative TEM images acquired at 2000× direct magnification show areas of myocardium of indicated genotype used for analysis of mitochondria. Scale bar = 5 µm. (F) Image of the subarea boxed yellow in (D), acquired at 5000× direct magnification and representative of the images used to quantify ultrastructural features of mitochondria detailed in Fig. 3. Scale bar = 2.5 µm. (G) Examples of inclusions observed in C10 G58R mutant mitochondria (black arrows). Scale bar = 500 nm. (H) Examples of two types of electrolucent mitochondria characterized by an enlarged matrix area absent of electron-dense substance and fewer cristae. (Top) A uniformly electrolucent mitochondrion. (Bottom) a segmented mitochondrion that has an electrolucent part (white arrow) separated from a portion of normal-looking matrix and cristae by a cut-through cristae. Open black arrowhead indicates the junction between electrolucent and normal portions of the segmented mitochondria. Scale bar = 500 nm. Please note: mitochondrion in (H, bottom) also appears in bottom right corner of image (J, top). (I) Mitochondria that are fully wrapped by electron-dense phagosome membranes (black arrows). Scale bar = 500 nm. (J) Mitochondria with ruptured OMMs. Open white arrowheads indicate sites where the intact IMM is visible, but OMM is absent. Scale bar = 500 nm. Please note: mitochondrion in image (H, bottom) also appears in the lower right corner of (J, top). Source data are available online for this figure.
Figure EV2
Figure EV2. TEM of myocardium and ultrastructural features of mitochondria in C2/C10 DKO.
(A, B) Representative TEM images acquired at 2000× direct magnification show areas of myocardium of indicated genotype used for analysis of mitochondria. Scale bar = 5 µm. (C) Image of the subarea boxed yellow in (B), acquired at 5000× direct magnification and representative of the images used to quantify ultrastructural features of mitochondria detailed in Fig. 3. Scale bar = 2.5 µm. (D) Examples of inclusions observed in C2/C10 DKO mitochondria (black arrows). Scale bar = 500 nm. (E) Examples of electrolucent mitochondria characterized by an enlarged matrix area absent of electron-dense substance and fewer cristae. Scale bar = 500 nm. Source data are available online for this figure.
Figure EV3
Figure EV3. TEM of myocardium and ultrastructural features of mitochondria in C10 S59L on Dele1+/− and Dele1 KO backgrounds.
(AC) Representative TEM images acquired at 2000× direct magnification show areas of myocardium of indicated genotype used for analysis of mitochondria. Scale bar = 5 µm. (D) Image of the subarea boxed yellow in (B), acquired at 5000× direct magnification and representative of images used to quantify ultrastructural features of mitochondria detailed in Fig. 3. Scale bar = 2.5 µm. (E) Examples of mitochondria that are partially or fully enclosed by electron-dense phagosome membranes (black arrows). Open black arrowhead indicates a portion of the mitochondria that is not enclosed. Partially enclosed mitochondria with ruptured OMMs were also observed. Open white arrowheads indicate sites where the intact IMM is visible, but the OMM is absent. Scale bar = 500 nm. (F) Examples of mitochondria with ruptured OMMs. Open white arrowheads indicate sites where the intact IMM is visible, but an OMM is absent. Scale bar = 500 nm. (G) Serial sections through a 250 nm diameter mitochondrion show that it is a spherical nano-mitochondrion spanning fewer than five 60-nm sections (< 300 nm in (Z)). Top row shows the five serial sections without colorization, bottom row shows the same serial sections with the nano-mitochondrion shaded yellow. Yellow dotted lines indicate absence of the mitochondrion in neighboring serial sections. Scale bar = 200 nm. (H) Five serial sections of 60-nm thickness show a 100 nm-wide tubule-shaped mitochondrion. Top row shows five serial sections through the tubular nano-mitochondrion, bottom row shows the same serial sections with the tubular nano-mitochondrion shaded yellow. The yellow dotted lines indicate absence of the mitochondrion in the neighboring section. Scale bar = 200 nm. Source data are available online for this figure.
Figure EV4
Figure EV4. TEM of myocardium and ultrastructural features of mitochondria in Tfam mKO on Dele1+/− and Dele1 KO backgrounds.
(AC) Representative TEM images acquired at 2000× direct magnification show areas of myocardium of indicated genotype used for analysis of mitochondria. Yellow star in (B) indicates a myocyte with milder structural phenotype compared to neighboring myocytes, illustrating the observed mosaicism of the phenotype. Scale bar = 5 µm. (D) Image of the subarea boxed yellow in (B), acquired at 5000× direct magnification and representative of images used to quantify ultrastructural features of mitochondria detailed in Fig. 3. Scale bar = 2.5 µm. (E) Tfam mKO mitochondria displayed populations of closely aligned “stacked” cristae (black arrows) and sparse areas filled with a granular matrix material and few cristae (open white arrowheads). Scale bar = 500 nm. The mitochondrion in the bottom left image is cropped from same cell as the mitochondrion shown in (Fig. 3F, middle). At least some Images of mitochondria are taken from the same cell. (F) Examples of crumpled cristae (white arrows) that occurred in Tfam mKO mitochondria. Scale bar = 500 nm. At least some Images of mitochondria are taken from the same cell. (G) This panel shows enlargements of images that are also shown in (Fig. EV4E, boxed area with “stacked cristae”) and (Fig. EV4F, boxed area with “crumpled cristae”). Scale bar = 250 nm. Source data are available online for this figure.
Figure EV5
Figure EV5. The Dele1 mt-ISR prevents disruptions in translation-associated proteostasis in skeletal muscle.
(A) Representative immunofluorescence images of gastrocnemius muscle from C10 G58R; Dele1 KO and indicated littermates triple-stained for the ubiquitinated protein marker, FK2 (green), the aggregate adapter protein p62 (red) and laminin (blue). In the C10 G58R; Dele1 KO genotype, a subset of fibers displayed FK2 and p62 colocalized in individual (white arrows) or confluent aggregates (arrowheads), suggesting proteostatic collapse. High power (60X) views of the boxed areas are shown in bottom panels. Scale bars = 10 μm. Note: animals were not injected with puromycin in this experiment. (B) Quantification of (A). Aggregates positive for both FK2 and p62 were counted in 10 high power (60X) fields. N = 3 mice per genotype with 29 or 30 fields counted total per sample. High-power (60X) field size is 132.58 μm × 132.58 μm. Statistical analysis was performed using the Kruskal–Wallis test with Dunn’s multiple comparisons test, as the data distribution was non-parametric. **** indicates p ≤ 0.0001 and “ns” not significant. Adjusted p-values are >0.9999 for WT vs. Dele1 KO, >0.9999 for WT vs. C10 G58R, <0.0001 for WT vs. C10 G58R; Dele1 KO, and <0.0001 for C10 G58R vs. C10 G58R; Dele1 KO. (C) Representative immunofluorescence images of gastrocnemius muscle from P28 C10 G58R; Dele1 KO mice and indicated littermates injected with puromycin 30 min prior to sacrifice as in (Fig. 7E). Muscle cross-sections were immunostained for the ubiquitinated protein marker, FK2 (green), puromycin (red), and laminin (blue). Arrowheads indicate muscle fibers containing many or confluent aggregates of ubiquitinated protein that were also co-stained for elevated puromycylated polypeptides. N = 1 mouse for each genotype except for P28 C10 G58R; Dele1 KO mice for which N = 3 mice. Scale bars = 20 μm. (D) Quantification of myofiber cross-sectional area (CSA) as in (Fig. 7E). The average CSA for Ub+ and Ub- myofiber is shown in graph separately for three G58R; Dele1 KO mice (m1–3) in graph. N = 3 mice with 10 high power fields counted per mouse. Statistical analysis was performed using the Kruskal–Wallis test with Dunn’s multiple comparisons test, as the data distribution was non-parametric. ** and **** indicates p ≤ 0.01 and 0.0001, respectively, and “ns” not significant. P-values (from left to right) are 0.0055, <0.0001, and 0.0016. (E) Schematic summarizing data showing that Dele1 KO results in variable protein synthesis, decreased proteostasis, and increased muscle fiber atrophy within skeletal muscle undergoing mitochondrial stress. We hypothesize that these changes are responsible for the decreased growth and survival in MM models with early mitochondrial stress, in the absence of the Dele1 mt-ISR.

Update of

References

    1. Ahola S, Rivera Mejías P, Hermans S, Chandragiri S, Giavalisco P, Nolte H, Langer T (2022) OMA1-mediated integrated stress response protects against ferroptosis in mitochondrial cardiomyopathy. Cell Metab 34:1875–1891.e7 - PubMed
    1. Ajroud-Driss S, Fecto F, Ajroud K, Lalani I, Calvo SE, Mootha VK, Deng H-X, Siddique N, Tahmoush AJ, Heiman-Patterson TD et al (2015) Mutation in the novel nuclear-encoded mitochondrial protein CHCHD10 in a family with autosomal dominant mitochondrial myopathy. Neurogenetics 16:1–9 - PMC - PubMed
    1. Anderson CJ, Bredvik K, Burstein SR, Davis C, Meadows SM, Dash J, Case L, Milner TA, Kawamata H, Zuberi A et al (2019) ALS/FTD mutant CHCHD10 mice reveal a tissue-specific toxic gain-of-function and mitochondrial stress response. Acta Neuropathol 138:103–121 - PMC - PubMed
    1. Austin S, Mekis R, Mohammed SEM, Scalise M, Wang W-A, Galluccio M, Pfeiffer C, Borovec T, Parapatics K, Vitko D et al (2022) TMBIM5 is the Ca2+/H+ antiporter of mammalian mitochondria. EMBO Rep 23:e54978 - PMC - PubMed
    1. Bannwarth S, Ait-El-Mkadem S, Chaussenot A, Genin EC, Lacas-Gervais S, Fragaki K, Berg-Alonso L, Kageyama Y, Serre V, Moore DG et al (2014) A mitochondrial origin for frontotemporal dementia and amyotrophic lateral sclerosis through CHCHD10 involvement. Brain 137:2329–2345 - PMC - PubMed