. 2024 Nov;21(11):1335-1349.
doi: 10.1038/s41423-024-01220-3. Epub 2024 Oct 8.

Silencing of SIRPα enhances the antitumor efficacy of CAR-M in solid tumors

Affiliations

Silencing of SIRPα enhances the antitumor efficacy of CAR-M in solid tumors

Han Zhang et al. Cell Mol Immunol. 2024 Nov.

Abstract

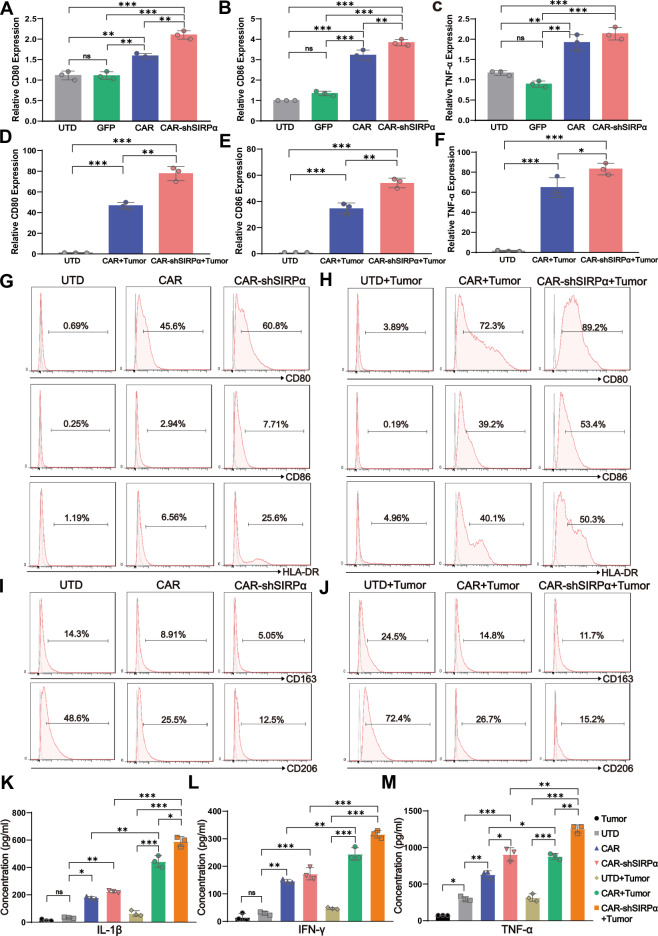
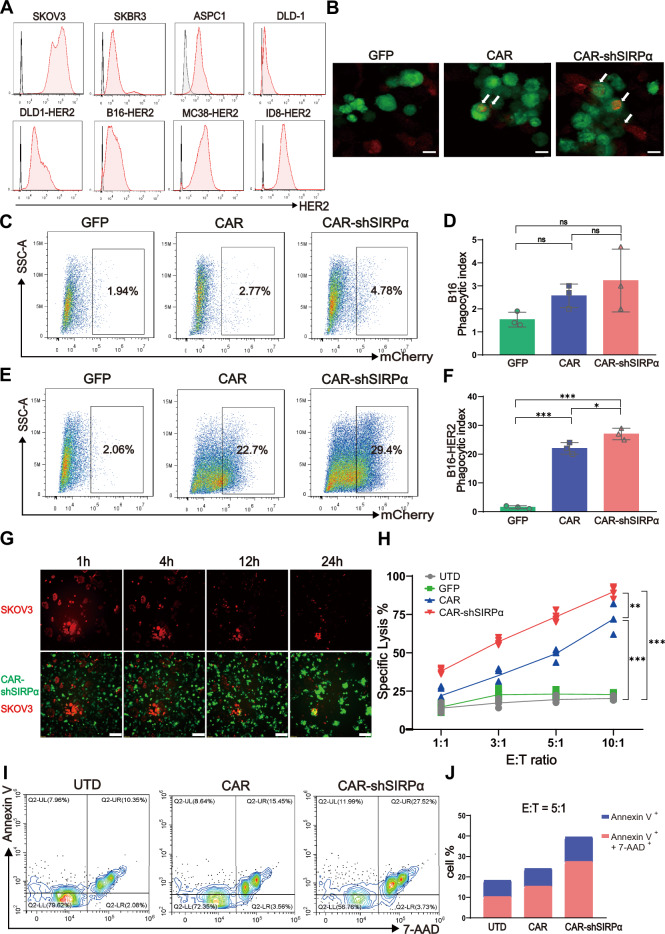
The potential of macrophage-mediated phagocytosis as a cancer treatment is promising. Blocking the CD47-SIRPα interaction with a CD47-specific antibody significantly enhances macrophage phagocytosis. However, concerns regarding their toxicity to nontumor cells remain substantial. Here, we engineered chimeric antigen receptor macrophages (CAR-Ms) by fusing a humanized single-chain variable fragment with FcγRIIa and integrating short hairpin RNA to silence SIRPα, thereby disrupting the CD47-SIRPα signaling pathway. These modified CAR-shSIRPα-M cells exhibited an M1-like phenotype, superior phagocytic function, substantial cytotoxic effects on HER2-positive tumor cells, and the ability to eliminate patient-derived organoids. In vivo, CAR-M cells significantly inhibited tumor growth and prolonged survival in tumor-bearing mice. Notably, CAR-shSIRPα-M cells enhanced cytotoxic T-cell infiltration into tumors, thereby enhancing the antitumor response in both the humanized immune system mouse model and immunocompetent mice. Mechanistically, SIRPα inhibition activated inflammatory pathways and the cGAS-STING signaling cascade in CAR-M cells, leading to increased production of proinflammatory cytokines, reactive oxygen species, and nitric oxide, thereby enhancing their antitumor effects. These findings underscore the potential of SIRPα inhibition as a novel strategy to increase the antitumor efficacy of CAR-M cells in cancer immunotherapy, particularly against solid tumors.

Keywords: CAR-M; Cancer immunotherapy; Phagocytosis; SIRPα; Solid tumor.


Conflict of interest statement

The authors declare no competing interests.

Figures

Fig. 1
Fig. 1
The FcγRIIa domain enhances CAR-mediated tumor phagocytosis. A Construction of HER2-targeting CAR macrophages incorporating diverse FcγR domains. B Flow cytometry histograms illustrating the lentivirus transfection efficiency in THP-1 cells. C Fluorescence-activated cell sorting (FACS) analysis of the phagocytic efficiency of the GFP+ macrophages. GFP- and CAR-modified macrophages were cocultured with mCherry+ SKOV3 cells at an effector-to-target ratio (E:T) of 1:1 for 1 h before flow cytometry analysis. D Structural diagram of CAR and CAR-shSIRPα. Flow cytometry histograms depicting CAR and CAR-shSIRPα expression levels, with GFP (E) and His-tagged recombinant HER2 (F) in sorted THP-1 cells. G Immunoblot analysis of SIRPα protein levels in untransduced (UTD), CAR, and CAR-shSIRPα macrophages. H FACS analysis of SIRPα expression levels in unstained (USD), untreated (UTD), CAR, and CAR-shSIRPα macrophages, as well as UTD, CAR, and CAR-shSIRPα macrophages cocultured with SKOV3 cells for 24 h
Fig. 2
Fig. 2
CAR-shSIRPα-treated macrophages exhibit an enhanced M1-like polarization phenotype. qRT‒PCR analysis of CD80 (A), CD86 (B), and TNF-α (C) expression levels in UTD, GFP, CAR, and CAR-shSIRPα macrophages. qRT‒PCR analysis of CD80 (D), CD86 (E), and TNF-α (F) expression levels in UTD-stimulated, and SKOV3-cocultured CAR- and CAR-shSIRPα-stimulated macrophages. GJ FACS analysis of M1- and M2-like phenotypic markers in resting macrophages and macrophages cocultured with SKOV3 cells. Expression levels of CD80, CD86, and HLA-DR in resting (G) and SKOV3-cocultured (H) UTD, CAR, and CAR-shSIRPα macrophages. Expression of CD163 and CD206 in resting (I) and SKOV3-cocultured (J) UTD, CAR, and CAR-shSIRPα macrophages. ELISA analysis of IL-1β (K), INF-γ (L), and TNF-α (M) production in UTD, CAR, and CAR-shSIRPα macrophages with or without coculture with SKOV3 cells. The data are presented as the means ± s.e.m. of three technical replicates. For all panels, *P < 0.05, **P < 0.01, ***P < 0.001
Fig. 3
Fig. 3
CAR-shSIRPα macrophages exhibit enhanced tumor phagocytosis and cytotoxicity. A FACS analysis of HER2 expression levels in human and mouse tumor cell lines. B Confocal microscopy analysis of macrophage phagocytosis. mCherry+ SKOV3 cells were cocultured with GFP, CAR, or CAR-shSIRPα macrophages at an effector-to-target (E:T) ratio of 5:1 for 1 h before visualization. Scale bars represent 20 μm. CF FACS analysis of targeted tumor phagocytosis by GFP+ macrophages. HER2-negative B16 cells (C) and HER2-positive B16-HER2 cells (E) were cocultured with GFP, CAR, or CAR-shSIRPα macrophages at an E:T ratio of 1:1 for 1 h prior to analysis. Statistical analysis of the phagocytosis efficiency of HER2-negative B16 cells (D) and HER2-positive B16-HER2 cells (F). G Cytotoxic effects of CAR-modified macrophages against HER2-positive tumor cells. mCherry-positive SKOV3 cells were cocultured with GFP, CAR, or CAR-shSIRPα macrophages at an E:T ratio of 5:1 for 24 h. Continuous images were obtained via a Lumascope 720 fluorescence microscope. Scale bars represent 100 μm. H Luciferase-based cytotoxicity analysis of CAR-modified macrophages at E:T ratios of 1:1, 3:1, 5:1, and 10:1 against SKOV3 cells after 24 h of coculture. I Apoptosis analysis of CAR-modified macrophages cocultured with SKOV3 cells. J Statistical analysis of the results presented in (I). The data are presented as the means ± s.e.m. of three technical replicates. For all panels, *P < 0.05, **P < 0.01, ***P < 0.001
Fig. 4
Fig. 4
CAR-modified macrophages effectively eradicate tumor patient-derived organoids (PDOs). Cultivation of gallbladder cancer PDOs (A) and pancreatic cancer PDOs (B). The morphology of the PDOs was examined via bright-field microscopy. Additionally, hematoxylin and eosin (HE) staining and immunohistochemical (IHC) staining were performed to assess the expression of HER2 and CA199 in the PDOs. Scale bars represent 20 μm for bright-field and HE-stained images and 50 μm for IHC-stained images. C Confocal imaging of the accumulation of CAR-modified macrophages around PDOs. PDOs were cocultured with CAR- and CAR-shSIRPα-treated macrophages (green) for 12 h. Nuclei were stained prior to confocal imaging. Scale bars represent 20 μm. D Phagocytosis of PDOs by CAR-shSIRPα macrophages. PDOs were stained with CellTracker (red) and cocultured with CAR-shSIRPα macrophages (green) for 48 h before confocal imaging. Scale bars represent 50 μm. E Cytotoxic effects of CAR-shSIRPα macrophages on PDO cells. PDOs labeled with CellTracker (red) were cocultured with CAR-shSIRPα macrophages that did not express GFP for 48 h, after which Apopxin™ Green was added to identify apoptotic cells before confocal imaging. Scale bars represent 50 μm. Destruction of the PDO structure by CAR-modified macrophages. Gallbladder cancer PDOs (F, scale bars represent 100 μm) or pancreatic cancer PDOs (G, scale bars represent 20 μm) were cocultured with GFP, CAR, and CAR-shSIRPα macrophages. Bright-field microscopy and HE were performed at the specified time points. HK Identification of proinflammatory cytokines in the supernatants of the cocultures. Gallbladder cancer PDOs (H, J) and pancreatic cancer PDOs (I, K) were cocultured with GFP, CAR, and CAR-shSIRPα macrophages for 72 h. The supernatant was analyzed via ELISA to measure the levels of IL-1β (H, I) and TNF-α (J, K). For all panels, *P < 0.05, **P < 0.01, ***P < 0.001
Fig. 5
Fig. 5
Enhanced inflammatory signaling, cGAS-STING pathway activation, and ROS and NO production in CAR-shSIRPα macrophages. SKOV3 cells cocultured with GFP, CAR, or CAR-shSIRPα macrophages were sorted via flow cytometry and subsequently subjected to RNA sequencing. Gene Ontology (GO) term enrichment analysis of differentially expressed genes (DEGs) was conducted for CAR vs. GFP (A), CAR-shSIRPα vs. GFP (B), and CAR-shSIRPα vs. CAR (C). D Heatmap analysis of DEGs related to polarization and glycolysis in GFP, CAR, and CAR-shSIRPα macrophages. E Lactate levels were detected in the supernatants of GFP, CAR, and CAR-shSIRPα macrophages cocultured with SKOV3 cells for 24 h. Immunoblot analysis of PFKFB3 and LDHA (F) and cGAS-STING signaling (G) protein levels in GFP, CAR, and CAR-shSIRPα-sorted macrophages stimulated with SKOV3 cells at an E:T ratio of 10:1 for 24 h. H Luciferase-based cytotoxicity analysis of CAR-modified macrophages at E:T ratios of 10:1 against SKOV3 cells after 24 h of coculture, with or without the STING inhibitor H-151. (I) ELISA analysis of INF-β production in CAR-modified macrophages at E:T ratios of 10:1 against SKOV3 cells after 24 h of coculture with or without the STING inhibitor H-151. J Heatmap analysis of DEGs related to NADPH oxidase complex-related genes in GFP, CAR, and CAR-shSIRPα macrophages. K Immunoblot analysis of iNOS protein levels in GFP-, CAR-, and CAR-shSIRPα-sorted macrophages stimulated with SKOV3 cells. L NO production by GFP, CAR, and CAR-shSIRPα macrophages with or without recombinant HER2 stimulation. *P < 0.05, **P < 0.01
Fig. 6
Fig. 6
Potent antitumor activity of CAR-shSIRPα macrophages in vivo. A, B Lenti-CAR and Ad-CAR macrophages were used to treat nude mice bearing peritoneal SKOV3 tumors. A The tumor burden was assessed via bioluminescence imaging (BLI), and representative images at different time points were presented. B Kaplan‒Meier curve showing the survival of the mice (n = 5 mice per group). C The tumor burden in the B16-HER2 cell subcutaneous injection model was evaluated via BLI, and representative images at different time points were shown (n = 5 mice per group). D IHC staining and TUNEL immunofluorescence staining were performed on tumor tissue sections from the B16-HER2 cell subcutaneous injection mouse model to examine the expression of Ki67, CD31, and active caspase-3, as well as apoptosis, in the tumor tissues. Scale bars represent 100 μm. E Polarization markers for M1 (CD80 and CD86) and M2 (CD163 and CD206) infiltrating macrophages were analyzed via FACS. F, G Tumor-bearing mice were euthanized four weeks after receiving caudal vein transfusions of CAR-modified macrophages in the B16-HER2 lung metastasis model. F Representative macroscopic images of lungs excised from the specified treatment groups at the end of the experiment. G Lung metastatic burden was assessed via HE staining. Scale bars represent 1 mm (n = 7 mice per group). For all panels, *P < 0.05, **P < 0.01, ***P < 0.001
Fig. 7
Fig. 7
CAR-shSIRPα macrophages promote T-cell infiltration and antitumor immunity. A The tumor burden in humanized immune system (HIS) mice treated with CAR-modified macrophages was assessed via BLI, with representative images presented at different time points following tumor implantation (n = 5 mice per group). B, C The percentage of hCD45+ cells in the tumor tissues of tumor-bearing HIS mice was measured 2 weeks after treatment, with each point representing one mouse (n = 3 per group). D, E The percentage of IFN-γ+ cells among hCD8+ T cells in the tumor tissue of tumor-bearing HIS mice was assessed 2 weeks posttreatment, with each point representing one mouse (n = 3 per group). F The tumor burden in immunocompetent C57BL/6 mice treated with CAR-modified macrophages was evaluated via BLI, with representative images shown at different time points (n = 5 mice per group). G CD3+ T, CD4+ T, and CD8+ T cells were detected via FACS in tumor tissues from tumor-bearing C57BL/6 mice. H IHC staining of CD3, CD8, and active caspase-3 was conducted on tumor tissue sections from tumor-bearing C57BL/6 mice. Scale bars represent 100 μm. For all panels, *P < 0.05, **P < 0.01, ***P < 0.001

References

    1. Liu G, Rui W, Zhao X, Lin X. Enhancing CAR-T cell efficacy in solid tumors by targeting the tumor microenvironment. Cell Mol Immunol. 2021;18:1085–95. - PMC - PubMed
    1. Rafiq S, Hackett CS, Brentjens RJ. Engineering strategies to overcome the current roadblocks in CAR T-cell therapy. Nat Rev Clin Oncol. 2020;17:147–67. - PMC - PubMed
    1. Hong M, Clubb JD, Chen YY. Engineering CAR-T cells for next-generation cancer therapy. Cancer Cell. 2020;38:473–88. - PubMed
    1. Labanieh L, Mackall CL. CAR immune cells: design principles, resistance and the next generation. Nature. 2023;614:635–48. - PubMed
    1. Maalej KM, Merhi M, Inchakalody VP, Mestiri S, Alam M, Maccalli C, et al. CAR-cell therapy in the era of solid tumor treatment: current challenges and emerging therapeutic advances. Mol Cancer. 2023;22:20. - PMC - PubMed

MeSH terms

LinkOut - more resources