. 2024 Oct 9;7(1):1285.
doi: 10.1038/s42003-024-06924-w.

Interplay between preclinical indices of obesity and neural signatures of fluid intelligence in youth

Affiliations

Interplay between preclinical indices of obesity and neural signatures of fluid intelligence in youth

Thomas W Ward et al. Commun Biol. .

Abstract

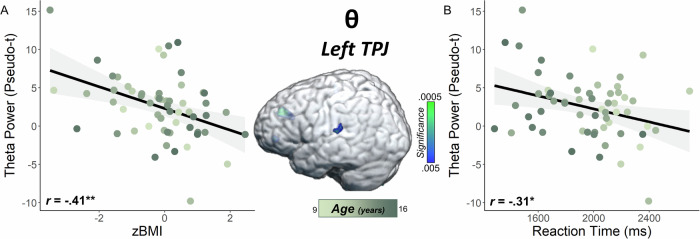
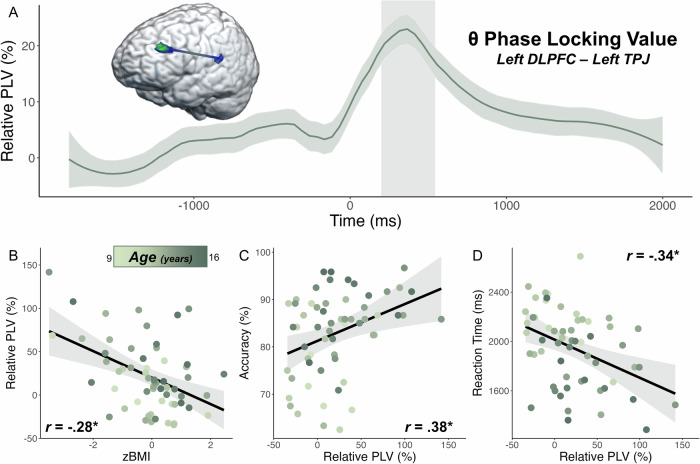
Pediatric obesity rates have quadrupled in the United States, and deficits in higher-order cognition have been linked to obesity, though it remains poorly understood how deviations from normal body mass are related to the neural dynamics serving cognition in youth. Herein, we determine how age- and sex-adjusted measures of body mass index (zBMI) scale with neural activity in brain regions underlying fluid intelligence. Seventy-two youth aged 9-16 years underwent high-density magnetoencephalography while performing an abstract reasoning task. The resulting data were transformed into the time-frequency domain and significant oscillatory responses were imaged using a beamformer. Whole-brain correlations with zBMI were subsequently conducted to quantify relationships between zBMI and neural activity serving abstract reasoning. Our results reveal that participants with higher zBMI exhibit attenuated theta (4-8 Hz) responses in both the left dorsolateral prefrontal cortex and left temporoparietal junction, and that weaker temporoparietal responses scale with slower reaction times. These findings suggest that higher zBMI values are associated with weaker theta oscillations in key brain regions and altered performance during an abstract reasoning task. Thus, future investigations should evaluate neurobehavioral function during abstract reasoning in youth with more severe obesity to identify the potential impact.


Conflict of interest statement

The authors declare no competing interests.

Figures

Fig. 1
Fig. 1. Abstract reasoning task paradigm.
Participants were presented with an empty grid of gray boxes for 2500 to 3000 ms with either the left or right bottom square highlighted by a white border to indicate the location of the upcoming target. Complex images then populated each of the four squares within the grid for 4000 ms. Participants indicated whether the image in the highlighted square correctly completed the pattern in the grid by responding via button press (i.e., right index finger for matching patterns, 60 trials; right middle finger for non-matching patterns, 60 trials). Match and non-match trials of each pattern were presented in a pseudo-randomized order for the duration of the task.
Fig. 2
Fig. 2. Accuracy on the MEG abstract reasoning task was associated with measures of fluid intelligence.
Accuracy (% correct) was significantly associated with scales from the Wechsler Abbreviated Scale of Intelligence – 2nd Edition (WASI-II), including the (A) Block Design and (B) Matrix Reasoning subtests, as well as the (C) Perceptual Reasoning Index (PRI) Composite. (D) Finally, zBMI was significantly associated with Block Design T-scores. The gray shaded area depicts the standard error of the mean. The gradient of the data points reflects each participant’s age in years. Note that one participant had incomplete data for the Matrix Reasoning subtest and the PRI Composite (n = 65), but all participants had complete data for the Block Design subtest (n = 66). *p < 0.05.
Fig. 3
Fig. 3. Neural oscillatory responses to the abstract reasoning task.
(Left): Grand-averaged time-frequency spectrograms of MEG sensors exhibiting one or more significant oscillatory responses. Shown from top to bottom: gamma (62–66 Hz, 200–1200 ms; MEG1913), alpha/beta (8–16 Hz, 450–1450 ms; MEG2042), and theta (4–8 Hz, 100–425 ms; MEG1123). Each spectrogram displays frequency (Hz) on the y-axis and time (ms) on the x-axis. Signal power data are expressed as a percent difference from the baseline period (−1800 to −800 ms) with color scale bars shown to the right of each spectrogram. Data from all 66 participants included for further analysis are represented in the spectrograms. Please refer to Supplementary Fig. 1 for a map of the MEG sensor locations. (Right): One-sample t-tests across all participants for each time-frequency component depicting the significant oscillatory responses serving abstract reasoning. Color scale bars display uncorrected p values.
Fig. 4
Fig. 4. Higher zBMI is associated with blunted theta oscillations in the left DLPFC.
(Left): Extracted pseudo-t values from the peak voxel in the left dorsolateral prefrontal cortex (DLPFC) are plotted to show the significant relationship between zBMI (x-axis) and oscillatory theta power (pseudo-t, y-axis) during task performance. Note that data from 59 participants were used for analyses following outlier exclusion at the whole-brain level. The gray shaded area depicts the standard error of the mean. The gradient of the data points reflects each participant’s age in years, which was not significantly related to these findings. (Right): Thresholded correlation map across all participants showing the left DLPFC cluster where theta oscillations were inversely linked to zBMI. **p < 0.005.
Fig. 5
Fig. 5. Elevated zBMI is associated with attenuated theta oscillations in the left TPJ.
A Extracted pseudo-t values from the peak voxel in the left temporoparietal junction (TPJ) region are plotted to demonstrate the significant relationship between zBMI (x-axis) and weaker oscillatory theta power (pseudo-t, y-axis) during abstract reasoning. B Weaker oscillatory theta power in the left TPJ was associated with slower reaction times (ms) during the abstract reasoning task. Note that data from 59 participants were used for analyses following outlier exclusion at the whole-brain level. In both scatterplots, the gray shaded area depicts the standard error of the mean. The gradient of the data points reflects each participant’s age in years, which was not related to either finding. *p < 0.05, **p < 0.005.
Fig. 6
Fig. 6. Exploratory analyses evaluating relationships between dynamic functional connectivity along the left DLPFC and left TPJ pathway with zBMI and task behavior.
A The theta phase locking value (PLV) expressed as percent change relative to baseline was computed as a measure of dynamic functional connectivity between the left dorsolateral prefrontal cortex (DLPFC) and temporoparietal junction (TPJ) The gray shaded area depicts the active period (i.e., 100–425 ms), and the green shaded area depicts the standard error of the mean. Controlling for source power, (B) higher zBMI was associated with weaker theta connectivity (i.e., hypoconnectivity) between the left DLPFC and left TPJ, while stronger theta PLVs scaled with better task performance in terms of (C) accuracy (% correct) and (D) reaction time (ms). Note that data from 59 participants were used for analyses after controlling for source power. The gray shaded areas depict the standard error of the mean. The gradient of the data points reflects each participant’s age in years. *p < 0.05, **p < 0.005.

Similar articles

Cited by

References

    1. World Health Organization. Noncommunicable diseases: Childhood overweight and obesity. https://www.who.int/news-room/questions-and-answers/item/noncommunicable... (2020).
    1. Fryar, C. D., Carroll, M. D. & Afful, J. Prevalence of overweight, obesity, and severe obesity among children and adolescents aged 2–19 years: United States, 1963–1965 through 2017–2018. NCHS Health E-Stats. https://www.cdc.gov/nchs/data/hestat/obesity-child-17-18/obesity-child.htm (2020).
    1. Stierman, B. et al. National Health and Nutrition Examination Survey 2017–March 2020 Prepandemic Data Files Development of Files and Prevalence Estimates for Selected Health Outcomes. Natl Health Stat. Rep. 158, 1–20 (2021). - PMC - PubMed
    1. Palmer, M. K. & Toth, P. P. Trends in lipids, obesity, metabolic syndrome, and diabetes mellitus in the United States: An NHANES Analysis (2003–2004 to 2013–2014). Obesity27, 309–314 (2019). - PubMed
    1. Kopelman, P. G. Obesity as a medical problem. Nature404, 635–643 (2000). - PubMed

LinkOut - more resources