. 2025 May;97(6):2056-2064.
doi: 10.1038/s41390-024-03604-7. Epub 2024 Oct 8.

Early prediction of mortality and morbidities in VLBW preterm neonates using machine learning

Affiliations

Early prediction of mortality and morbidities in VLBW preterm neonates using machine learning

Chi-Hung Shu et al. Pediatr Res. 2025 May.

Abstract

Background: Predicting mortality and specific morbidities before they occur may allow for interventions that may improve health trajectories.

Hypothesis: Integrating key maternal and postnatal infant variables in the first 2 weeks of age into machine learning (ML) algorithms will reliably predict survival and specific morbidities in VLBW preterm infants.

Methods: ML algorithms were developed to integrate 47 features for predicting mortality, bronchopulmonary dysplasia (BPD), neonatal sepsis, necrotizing enterocolitis (NEC), intraventricular hemorrhage (IVH), cystic periventricular leukomalacia (PVL), and retinopathy of prematurity (ROP). A retrospective cohort (n = 3341) was used to train and validate the models with a repeated 10-fold cross-validation strategy. These models were then tested on a separate cohort (n = 447) to evaluate the final model performance.

Results: Among the seven ML algorithms employed, tree-based ensemble models, specifically Random Forest (RF) and XGBoost, had the best performance metrics. The area under the receiver operating characteristic curve (AUROC) of sepsis with or without meningitis (0.73), NEC (0.73), BPD (0.71), and mortality (0.74) exceeded 0.7, while the area under Precision-Recall curve (AUPRC) for all outcomes was greater than the prevalence, demonstrating effective risk stratification in VLBW preterm infants.

Conclusions: Our study demonstrates the potential of predictive analytics leveraging ML techniques in advancing precision medicine.

Impact: Reliable prediction of adverse outcomes before they occur has the potential to institute interventions and possibly improve health trajectories in VLBW preterm infants. We used machine learning to develop and test predictive models for mortality and five major morbidities in VLBW preterm infants. Individualized prediction of outcomes and individualized interventions will advance Precision Medicine in Neonatology.


Conflict of interest statement

Competing interests: The authors declare no competing interests.

Figures

Figure 1.
Figure 1.. Study Overview.
1a. A schematic representation of the machine learning (ML) pipeline is depicted here. Various ML models were trained and validated with the Texas Childrens’ Hospital (TCH) Vermont Oxford Network (VON) database for each adverse outcome. After that, these models were tested utilizing the TCH Children’s Hospital Neonatal Consortium (CHNC) database to assess final performance. The models with testing AUROC > 0.70 in each outcome were selected for downstream analysis to mitigate potential biases. 1b. A two-dimensional representation of clinical features from the first 2 weeks post-delivery was generated by applying the UMAP algorithm on their correlation coefficient matrix. Nodes within this framework correspond to specific features from the dataset and are color-coded according to their respective categories. The presence of edges between nodes signifies statistically significant correlations, with an absolute Spearman correlation coefficient exceeding 0.1 and a Spearman correlation p value below 0.05. The width of edges reflects the strength of correlation. (Abbreviations used: BW: birth weight; GA: gestational age; PDA: patent ductus arteriosus; RDS: Respiratory distress syndrome; FIP: Focal Intestinal Perforation)
Figure 2.
Figure 2.. Receiver operating characteristic (ROC) and precision-recall (PRC) curves.
(a) ROC curves, AUROC and (b) PRC curves, AUPRC were obtained by evaluating the model with the best testing performance utilizing the TCH CHNC database for every adverse outcome prediction task. The AUROC of BPD, NEC, sepsis with or without meningitis, and mortality were greater than 0.7, indicating fair predictive power leveraging ML models on these two databases. However, the AUPRC values for all adverse outcomes exceeded the prevalence in the dataset, thus demonstrating the capability of these ML models to accurately predict positive cases among VLBW preterm infants.
Figure 3.
Figure 3.. Correlation networks of clinical features with adverse outcomes.
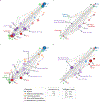
The top 10 significant features derived from SHAP method in the optimal models for (a) Bronchopulmonary Dysplasia (b) Necrotizing Enterocolitis (c) Sepsis with or without meningitis (d) Mortality are highlighted with black edges around the nodes and the darker color using the correlation network layout. The significance of univariate correlations between the features and the corresponding outcomes after Benjamini-Hochberg adjustment for multiple hypothesis correction are represented by node sizes. (Abbreviations used: BW: birth weight; GA: gestational age; PDA: patent ductus arteriosus; RDS: Respiratory distress syndrome; FIP: Focal Intestinal Perforation; CLD: chronic lung disease; CNSI: coagulase negative staphylococcal infection; CV: conventional ventilation; HFV: high frequency ventilation; ETT: endotracheal tube ventilation; HFNC: high flow nasal cannula; CPAP: continuous positive airway pressure)
Figure 4.
Figure 4.. SHAP swarm plots.
The influence of the top 10 significant features derived from SHAP method in the optimal models for (a) Bronchopulmonary Dysplasia (b) Necrotizing Enterocolitis (c) Sepsis with or without Meningitis (d) Mortality on model outputs, namely the corresponding risk scores are demonstrated here. Features on the left are ranked in descending order of importance. Red color represents higher feature values, while blue color indicates lower feature values. Points to the right of the baseline contribute to a higher disease risk score, while points on the left contribute to a lower disease risk score. (Abbreviations used: NICU: neonatal intensive care units; BW: birth weight; GA: gestational age; PDA: patent ductus arteriosus; RDS: Respiratory distress syndrome; CLD: chronic lung disease; FIP: Focal Intestinal Perforation; CLD: chronic lung disease; CNSI: coagulase negative staphylococcal infection; CV: conventional ventilation; HFV: high frequency ventilation; ETT: endotracheal tube ventilation; HFNC: high flow nasal cannula; CPAP: continuous positive airway pressure)

References

    1. Quinn J-A et al. Preterm Birth: Case Definition & Guidelines for Data Collection, Analysis, and Presentation of Immunisation Safety Data. Vaccine 34, 6047–6056 (2016). - PMC - PubMed
    1. Preterm Birth: Causes, Consequences, and Prevention (National Academies Press, 2007). - PubMed
    1. in Centers for Disease Control and Prevention (2023).
    1. Beam AL et al. Estimates of Healthcare Spending for Preterm and Low-Birthweight Infants in a Commercially Insured Population: 2008–2016. Journal of Perinatology 40, 1091–1099 (2020). - PMC - PubMed
    1. Youssef MRL Clinical Risk Index for Babies (Crib Ii) Scoring System in Prediction of Mortality in Premature Babies. JOURNAL OF CLINICAL AND DIAGNOSTIC RESEARCH (2015). - PMC - PubMed

LinkOut - more resources