. 2024 Nov;56(11):2407-2421.
doi: 10.1038/s41588-024-01939-9. Epub 2024 Oct 8.

GWAS of multiple neuropathology endophenotypes identifies new risk loci and provides insights into the genetic risk of dementia

Collaborators, Affiliations

GWAS of multiple neuropathology endophenotypes identifies new risk loci and provides insights into the genetic risk of dementia

Lincoln M P Shade et al. Nat Genet. 2024 Nov.

Erratum in

Abstract

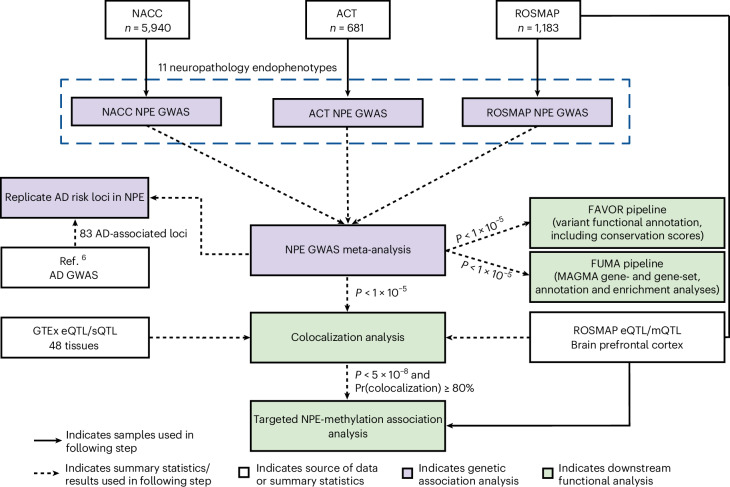
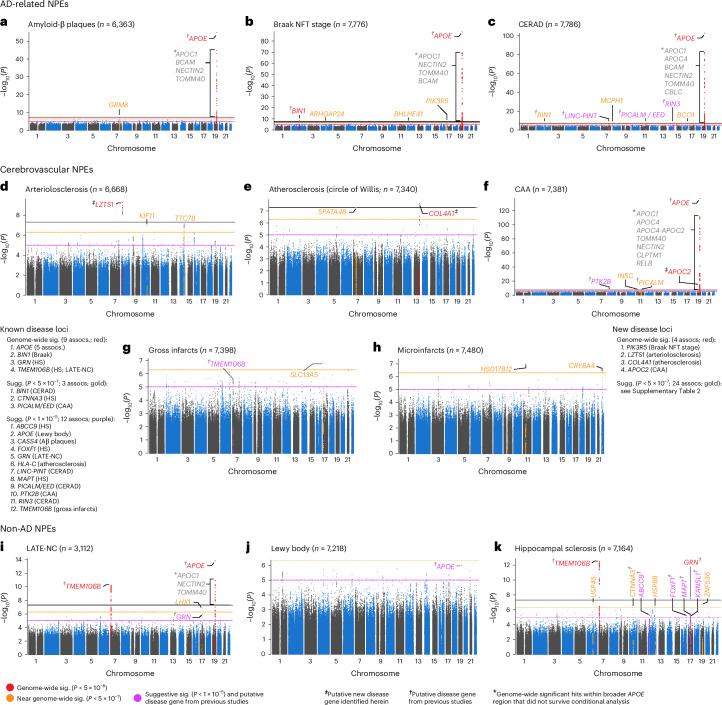
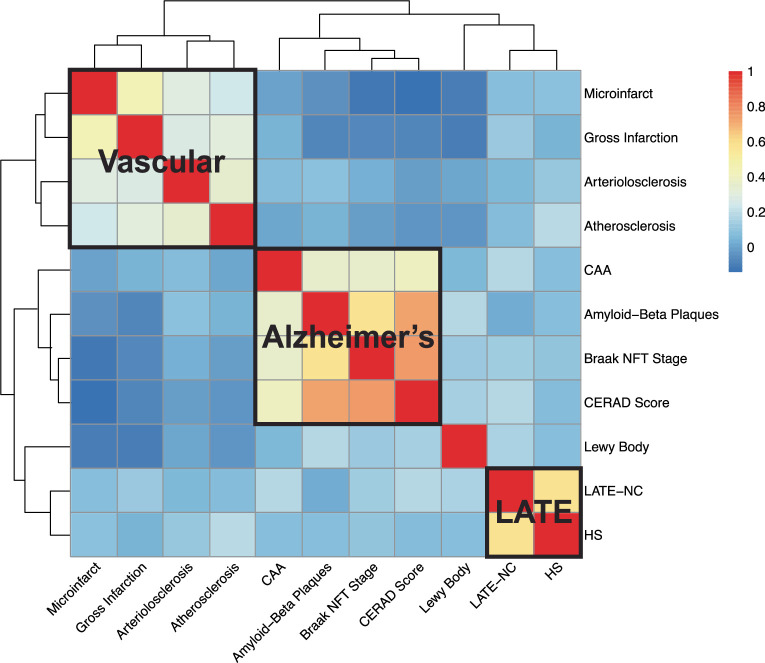
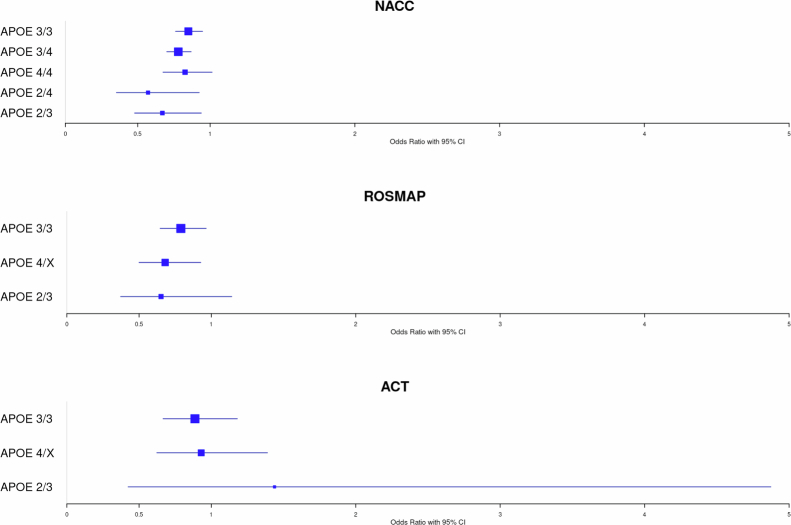
Genome-wide association studies (GWAS) have identified >80 Alzheimer's disease and related dementias (ADRD)-associated genetic loci. However, the clinical outcomes used in most previous studies belie the complex nature of underlying neuropathologies. Here we performed GWAS on 11 ADRD-related neuropathology endophenotypes with participants drawn from the following three sources: the National Alzheimer's Coordinating Center, the Religious Orders Study and Rush Memory and Aging Project, and the Adult Changes in Thought study (n = 7,804 total autopsied participants). We identified eight independent significantly associated loci, of which four were new (COL4A1, PIK3R5, LZTS1 and APOC2). Separately testing known ADRD loci, 19 loci were significantly associated with at least one neuropathology after false-discovery rate adjustment. Genetic colocalization analyses identified pleiotropic effects and quantitative trait loci. Methylation in the cerebral cortex at two sites near APOC2 was associated with cerebral amyloid angiopathy. Studies that include neuropathology endophenotypes are an important step in understanding the mechanisms underlying genetic ADRD risk.


Conflict of interest statement

J.A.S. reported personal fees from the Observational Study Monitoring Board Framingham, Observational Study Monitoring Board Discovery (National Institute of Neurological Disorders and Stroke) and Takeda Pharma. A.J.S. reported support from Avid Radiopharmaceuticals, a subsidiary of Eli Lilly (in kind contribution of positron emission tomography tracer precursor), and participated in Scientific Advisory Boards (Bayer Oncology, Eisai, Novo Nordisk and Siemens Medical Solutions) and an Observational Study Monitoring Board (MESA, NIH NHLBI), as well as several other NIA External Advisory Committees. He also serves as editor-in-chief of Brain Imaging and Behavior, a Springer Nature Journal. He was not involved in the editorial handling of this Nature Genetics paper (journals within the Springer Nature Portfolio are editorially independent). The other authors declare no competing interests.

Figures

Fig. 1
Fig. 1. Overview of GWAS meta-analysis study design.
We performed GWAS meta-analyses of 11 NPEs across three data sources. White boxes represent data sources or summary statistics used in this study. Purple boxes represent individual steps throughout the genetic association analysis, and green boxes represent downstream functional analyses. The first stage of this analysis involved independent GWAS performed in parallel across the NACC neuropathology dataset, the ACT study and the combined ROSMAP. We then performed a meta-analysis using results from each individual GWAS using METAL. Variants reaching a suggestive threshold of association (P ≤ 1 × 10−5) in the meta-analysis were then carried forward for downstream analyses, including functional and colocalization analyses. Variants reaching the genome-wide significant threshold (P ≤ 5 × 10−8) and exhibiting ≥80% colocalization between two NPEs were followed up using existing methylation data to assess the association. All variants reaching genome-wide significance were considered associated with the respective NPE. We also report variants that reached a suggestive threshold (P ≤ 5 × 10−7) or reached the lower suggestive threshold (P ≤ 1 × 10−5) and were in a previously known disease-associated locus. GTEx, Genotype-Tissue Expression Project; QTL, quantitative trait locus; eQTL, expression QTL; sQTL, splicing QTL; mQTL, methylation QTL; AD, Alzheimer’s disease.
Fig. 2
Fig. 2. Manhattan plots identify loci associated with each of the 11 NPEs included in this study.
ak, Manhattan plots are shown for amyloid-β plaques (a), Braak NFT stage (b), CERAD score for neuritic plaques (c), arteriolosclerosis (d), atherosclerosis in the circle of Willis (e), CAA (f), gross infarcts (g), microinfarcts (h), LATE-NC (i), Lewy body (j) and hippocampal sclerosis (k). The y axes denote the −log10(P value of meta-analysis two-sided z test) of the variant–phenotype association, and the x axes outline the chromosomal position, with alternate chromosomes represented in black and blue. Labels indicate the nearest gene at a locus. The horizontal lines define the genome-wide significance level (solid black, P = 5 × 10−8), near genome-wide significance level (dotted gold, P = 5 × 10−7), and suggestive significance level (P < 5 × 10−5) in loci with evidence of AD association from a previous study (for example, ref. ; dotted purple). Points and gene symbols are coded with the same colors. Gray gene symbols indicate genome-wide significant hits within the APOE region that did not survive conditional analysis. All GWAS are in cohorts of European ancestry and adjusted for age at death, sex, genotyping cohort and top ten genetic PCs. We identified seven genome-wide significant loci and 30 near genome-wide significant or suggestive loci. The genome-wide significant loci resulted in 12 associations with eight NPEs (amyloid-β plaques, arteriolosclerosis, atherosclerosis, Braak NFT stage, CAA, CERAD score, hippocampal sclerosis and LATE-NC). Four genes were previously associated with ADRD (APOE, BIN1, TMEM106B, GRN; ac,f,i,k), while the three new loci were in or closest to LZTS1, COL4A1 and APOC2 (df). APOC2 is within the broader APOE region but remained significantly associated with CAA after adjusting for APOE ? diplotypes (f). Three NPEs (gross infarcts, microinfarcts and Lewy bodies) had zero genome-wide significant hits, but all three had near genome-wide significant and/or suggestive hits from either new or known loci. APOE was associated with a range of NPEs, including LATE-NC, which is not pathognomonic of AD. On the other hand, neither GRN nor TMEM106B (recently identified in ADRD GWAS) was associated with the AD pathognomonic NPEs but were specific to gross infarcts, LATE-NC and hippocampal sclerosis at either genome-wide or suggestive significance. sig., significant; assocs, associations; sugg., suggestive.
Fig. 3
Fig. 3. New associations identified between PIK3R5 (suggestive), LZTS1 and COL4A1 and Braak NFT stage, arteriolosclerosis and cerebral atherosclerosis, respectively.
a, Braak stage association plot from NPE GWAS meta-analysis (n = 7,776) for the region around PIK3R5. Colored dots represent the chromosomal position (x axis, Mb) in hg38 coordinates and −log10(P value from meta-analysis two-sided z test; y axis) of each variant in the region. Dots are colored to represent the LD r2 with the lead variant (purple diamond) estimated with PLINK–r2 using 1000 Genomes phase 3 European-descended participants. The recombination rate was calculated using GRCh38 genetic map files downloaded from https://bochet.gcc.biostat.washington.edu/beagle/genetic_maps/ and taking the ratio of difference of CM and Mb between positions. Boxes below data indicate the location of genes in the region. (Plot generated using LocusZoom.) b, Association of PIK3R5 lead variant (rs72807981) with Braak stage for individual cohorts (NACC, n = 5,927 and ACT, n = 677; this variant was not present in ROSMAP) and meta-analysis (n = 6,604) using METAL (y axis). Points along the x axis represent OR of association, and error bars indicate 95% CI. c, Human brain cell-type expression profile of PIK3R5 in ref. . Columns represent mean FPKM. Error bars indicate the s.e. of measurement for each cell type based on the number of human samples sequenced for each type (fetal astrocytes, n = 6; mature astrocytes, n = 12; endothelial, n = 2; microglia, n = 3; neurons, n = 1 and oligodendrocytes, n = 5). PIK3R5 is primarily expressed in microglia. d, Arteriolosclerosis association plot from NPE GWAS meta-analysis (n = 6,668) for the region around LZTS1 (see a for interpretation). e, Association of LZTS1 lead variant (rs78909048) with arteriolosclerosis for individual cohorts (NACC, n = 4,930; ROSMAP, n = 1,163 and ACT, n = 575) and meta-analysis (n = 6,668) using METAL (y axis; see b for interpretation). f, Human brain cell-type expression profile of LZTS1 in ref. . LZTS1 is primarily expressed in fetal astrocytes and endothelial cells (see c for interpretation). g, Cerebral atherosclerosis association plot from NPE GWAS meta-analysis (n = 7,340) for the region around COL4A1 (see a for interpretation). h, Association of COL4A1 lead variant (rs2000660) with cerebral atherosclerosis for individual cohorts (NACC, n = 5,496; ROSMAP, n = 1,175 and ACT, n = 669) and meta-analysis (n = 7,340) using METAL (y axis; see b for interpretation). i, Human brain cell-type expression profile of COL4A1 in ref. . COL4A1 is preferentially expressed in fetal astrocytes and endothelial cells with lower expression in neurons (see c for interpretation). Mb, megabase.
Fig. 4
Fig. 4. Hippocampal sclerosis and quantitative trait locis all colocalize with LATE-NC on TMEM106B.
We investigated whether loci associated with multiple NPEs show evidence for genetic colocalization using a Bayesian colocalization analysis approach implemented in the coloc R package. a, The TMEM106B lead variant (rs2043539) reached genome-wide significance with LATE-NC. b,c, Hippocampal sclerosis colocalized with LATE-NC on TMEM106B (PrC = 90%). d,e, TMEM106B expression colocalized with LATE-NC (PrC = 91%). fi, Two methylation QTL (mQTLs), cg09613507 (PrC = 89%; f,g) and cg23422036 (PrC = 95%; h,i), also colocalized with LATE-NC. a, b, d, f and h show regional LocusZoom plots for each trait. Purple diamonds represent lead variants. c, e, g and i compare −log10(P) values between each trait compared to LATE-NC −log10(P) values across the TMEM106B rs2043539 locus (color legend same as in a). The TMEM106B expression and the methylation data were obtained from ROSMAP. j, Decreased TMEM106B expression was associated with more severe LATE-NC pathology (P = 0.043). Unless otherwise specified, for all boxplots, boxes outline the first quartile, median and third quartile. Whiskers extend up to 1.5× the distance between the first and third quartiles. k, Hypermethylation of cg09613507 was associated with more severe LATE-NC pathology (P = 0.0093). l, Methylation at cg23422036 was not significantly associated (P = 0.10). m, Unrelated to TMEM106B, BIN1 expresses eight distinct RNA isoforms simultaneously in the frontal cortex from six AD cases and six controls. To understand the complexities and nuances of ADRDs, we also need to understand the nuances of the genes purported to be driving disease. CDS, coding sequence; CTRL, control; CPM, counts per million; F, female; M, male; hipp. scler., hippocampal sclerosis; expr. cer., expression in cerebellum.
Fig. 5
Fig. 5. Four mQTL colocalize with CAA on APOC2.
Using the same Bayesian colocalization analysis approach from Fig. 4 (coloc 5.2.2 R package), we tested for colocalization between CAA and methylation sites using existing data from ROSMAP. a, Lead SNP rs7247551, near APOC2, reached genome-wide significance with CAA. b,d,f,h, The rs7247551 was also significantly associated with four mQTL. bi, cg04401876 (PrC = 96%; b,c), cg10169327 (PrC = 96%; d,e), cg13119609 (PrC = 99%; f,g) and cg09555818 (PrC = 97%; h,i) all colocalized with CAA. a, b, d, f and h show regional LocusZoom plots for each trait. c, e, g and i compare −log10(P) values between each trait compared to CAA −log10(P) values across the APOC2 rs7247551 locus. Variants in LD with the lead variant (purple diamond in ai) are shaded in ai according to the color legend on the left-hand side of a. j, Plots of normalized methylation level versus CAA pathology severity. Hypomethylation at cg09555818 (OR = 0.82, P = 0.003) and cg13119609 (OR = 0.78, P = 0.0006) were significantly associated with more severe CAA pathology. Unless otherwise specified, for all boxplots, boxes outline the first quartile, median and third quartile. Whiskers extend up to 1.5× the distance between the first and third quartiles. k, Both cg09555818 (P = 0.0063; k) and cg13119609 (P = 0.0069; not shown) were significantly associated with APOC2 expression. l,m, The rs7247551 G allele was significantly associated with increased APOC2 expression in the frontal cortex in ROSMAP (β = 0.072, P = 0.00013; l); however, the direction of effect was opposite of that found in brain tissues in GTEx (P = 7.2 × 10−7; m). n,o, The rs7247551 was not associated with APOE (P = 0.81; n) or APOC2 (P = 0.89; o) expression in frontal cortex in ROSMAP. p, APOC2 is highly expressed, especially in microglia and oligodendrocytes. Columns represent mean FPKM. Error bars indicate the s.e. of measurement for each cell type based on the number of human samples sequenced for each type (fetal astrocytes, n = 6; mature astrocytes, n = 12; neurons, n = 1; oligodendrocytes, n = 5; endothelial, n = 2 and microglia, n = 3). expr., expression; norm., normalized.
Extended Data Fig. 1
Extended Data Fig. 1. Heatmap of the polychoric correlations of 11 neuropathology endophenotypes.
The y-axis (rows) and x-axis (columns) refer to the neuropathology endophenotype pairs with the hierarchical clustering generated by the polychoric correlations calculation. The red and blue color refers to high and low correlations between the neuropathology endophenotype pairs. The three positively correlated clusters of endophenotypes that match general expectations are highlighted by the black solid lines: a ‘vascular’ cluster consisting of gross infarcts, microinfarcts, arteriolosclerosis and atherosclerosis; an ‘Alzheimer’s disease’ cluster consisting of Braak NFT stage, neuritic plaques, amyloid-beta plaques and CAA; and a ‘LATE’ cluster consisting of LATE-NC and HS, respectively.
Extended Data Fig. 2
Extended Data Fig. 2. Quantile–quantile (QQ) plots for the 11 neuropathology endophenotype.
The y-axis refers to the experimental −log10(P) from two-sided z test of the genome-wide association study (GWAS) meta-analysis. The x-axis refers to the theoretical −log10(P) based on percentile. Each point represents a single-nucleotide polymorphism (SNP). The line of identity (y = x) is shown in a black dashed line, indicating the expected alignment under the null hypothesis. Deviations from this line suggest possible inflation due to population structure or polygenic effects. The genomic inflation factor lambda (λ) is calculated for each phenotype indicating minimal inflation of test statistics. The λ estimates ranged from 0.9879 to 1.0047, and visual inspection of the QQ plots did not suggest any systematic bias in the data.
Extended Data Fig. 3
Extended Data Fig. 3. Forest plots of associations between CAA and lead variant (rs7247551) on chromosome 19 stratified by study and APOE ? diplotype.
For each of the data sources (NACC n = 5,927, ROSMAP n = 1,172 and ACT n = 677), we re-analyzed the association between CAA and lead variant rs7247551 from the meta-analysis while stratifying by APOE ? diplotype and visually compared effect sizes across groups. Due to low sample sizes preventing model convergence, APOE ?4 carriers (diplotypes ?2/?4, ?3/?4, ?4/?4) were merged in analyses for ROSMAP and ACT. Points along the x-axis represent the estimated odds ratios, and error bars indicate 95% CI. Results demonstrate a consistent pattern of association between rs7247551 and CAA within each of the data sources used in our study.
Extended Data Fig. 4
Extended Data Fig. 4. Regional plot and the chromatin interaction plot of rs2000660 that is associated with cerebral atherosclerosis.
Atherosclerosis association plot from NPE GWAS meta-analysis (n = 7,340) for the SNP of rs2000660. The x-axis refers to the position of the genome. In the top plot, the y-axis refers to the −log10(P) from meta-analysis two-sided Z test. The lead variant, rs2000660, is circled in black and colored in dark purple. Variants meeting the threshold of P < 1 × 10⁻⁵ were colored coded according to linkage disequilibrium r2 to rs200060. Other variants are colored in gray. The figures are generated by FUMA pipelines (https://fuma.ctglab.nl). In the bottom plot, the x-axis refers to the genome position, and the y-axis refers to the type of regulatory elements in the chromatin interaction plot for rs2000660.
Extended Data Fig. 5
Extended Data Fig. 5. CERAD score and Braak NFT stage colocalize on BIN1.
Braak stage and CERAD association plot from NPE GWAS meta-analysis (n = 7,776–7,786) for the region around BIN1. Colored dots represent the chromosomal position (x-axis, Mb, megabase) in hg38 coordinates and −log10(P from meta-analysis two-sided z test; y-axis) of each variant in the region. Dots are colored to represent the linkage disequilibrium r2 with the lead variant (purple dot) estimated with PLINK–r2 using 1000 Genomes Phase 3 European-descended participants. The recombination rate was calculated using GRCh38 genetic map files downloaded from https://bochet.gcc.biostat.washington.edu/beagle/genetic_maps/. Boxes below data indicate the location of genes in the region (plot generated using LocusZoom).
Extended Data Fig. 6
Extended Data Fig. 6. GRN expression, hippocampal sclerosis and LATE-NC all colocalize on GRN.
GRN gene expression, hippocampal sclerosis and LATE-NC association plot from NPE GWAS meta-analysis (n = 3,112–7,164) for the region around GRN. Colored dots represent the chromosomal position (x-axis, Mb, megabase) in hg38 coordinates and −log10(P from meta-analysis two-sided z test; y-axis) of each variant in the region. Dots are colored to represent the linkage disequilibrium r2 with the lead variant (purple dot) estimated with PLINK–r2 using 1000 Genomes Phase 3 European-descended participants. The recombination rate was calculated using GRCh38 genetic map files downloaded from https://bochet.gcc.biostat.washington.edu/beagle/genetic_maps/. Boxes below data indicate the location of genes in the region (plot generated using LocusZoom).
Extended Data Fig. 7
Extended Data Fig. 7. Hippocampal sclerosis and ABCC9 expression colocalize on ABCC9.
ABCC9 gene expression and hippocampal sclerosis association plot from NPE GWAS meta-analysis (n = 7,164) for the region around ABCC9. Colored dots represent the chromosomal position (x-axis, Mb, megabase) in hg38 coordinates and −log10(P from meta-analysis two-sided Z test; y-axis) of each variant in the region. Dots are colored to represent the linkage disequilibrium r2 with the lead variant (purple dot) estimated with PLINK–r2 using 1000 Genomes Phase 3 European-descended participants. The recombination rate was calculated using GRCh38 genetic map files downloaded from https://bochet.gcc.biostat.washington.edu/beagle/genetic_maps/. Boxes below data indicate the location of genes in the region (plot generated using LocusZoom).

References

    1. Farfel, J. M. et al. Relation of genomic variants for Alzheimer disease dementia to common neuropathologies. Neurology87, 489–496 (2016). - PMC - PubMed
    1. Katsumata, Y. et al. Multiple gene variants linked to Alzheimer’s-type clinical dementia via GWAS are also associated with non-Alzheimer’s neuropathologic entities. Neurobiol. Dis.174, 105880 (2022). - PMC - PubMed
    1. Karanth, S. et al. Prevalence and clinical phenotype of quadruple misfolded proteins in older adults. JAMA Neurol.77, 1299–1307 (2020). - PMC - PubMed
    1. Jansen, I. E. et al. Genome-wide meta-analysis identifies new loci and functional pathways influencing Alzheimer’s disease risk. Nat. Genet.51, 404–413 (2019). - PMC - PubMed
    1. Wightman, D. P. et al. A genome-wide association study with 1,126,563 individuals identifies new risk loci for Alzheimer’s disease. Nat. Genet.53, 1276–1282 (2021). - PMC - PubMed

Grants and funding