Meta-Analysis
. 2024 Nov;56(11):2370-2379.
doi: 10.1038/s41588-024-01947-9. Epub 2024 Oct 8.

Rare variant analyses in 51,256 type 2 diabetes cases and 370,487 controls reveal the pathogenicity spectrum of monogenic diabetes genes

Affiliations
Meta-Analysis

Rare variant analyses in 51,256 type 2 diabetes cases and 370,487 controls reveal the pathogenicity spectrum of monogenic diabetes genes

Alicia Huerta-Chagoya et al. Nat Genet. 2024 Nov.

Erratum in

Abstract

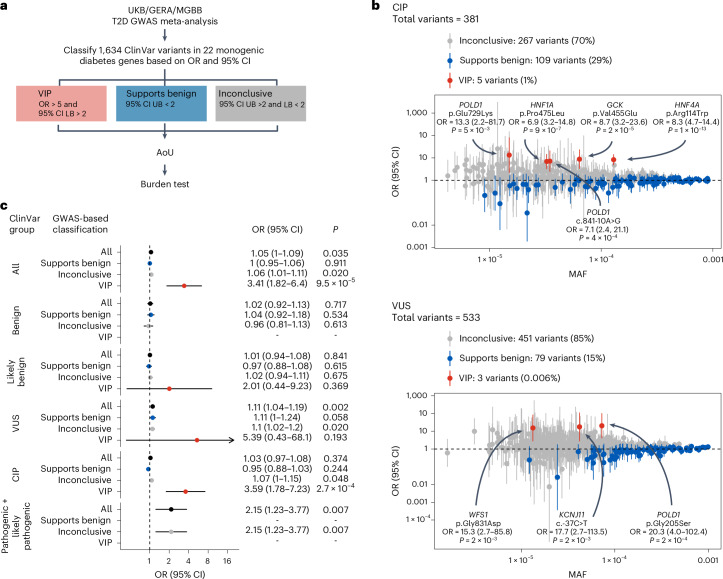
Type 2 diabetes (T2D) genome-wide association studies (GWASs) often overlook rare variants as a result of previous imputation panels' limitations and scarce whole-genome sequencing (WGS) data. We used TOPMed imputation and WGS to conduct the largest T2D GWAS meta-analysis involving 51,256 cases of T2D and 370,487 controls, targeting variants with a minor allele frequency as low as 5 × 10⁻⁵. We identified 12 new variants, including a rare African/African American-enriched enhancer variant near the LEP gene (rs147287548), associated with fourfold increased T2D risk. We also identified a rare missense variant in HNF4A (p.Arg114Trp), associated with eightfold increased T2D risk, previously reported in maturity-onset diabetes of the young with reduced penetrance, but observed here in a T2D GWAS. We further leveraged these data to analyze 1,634 ClinVar variants in 22 genes related to monogenic diabetes, identifying two additional rare variants in HNF1A and GCK associated with fivefold and eightfold increased T2D risk, respectively, the effects of which were modified by the individual's polygenic risk score. For 21% of the variants with conflicting interpretations or uncertain significance in ClinVar, we provided support of being benign based on their lack of association with T2D. Our work provides a framework for using rare variant GWASs to identify large-effect variants and assess variant pathogenicity in monogenic diabetes genes.


Conflict of interest statement

A.L.G.’s spouse is employed by Genentech and holds stock options in Roche. A.K.M. is an unpaid research collaborator with AstraZeneca. J.M.M. has research funded in collaboration with Novo Nordisk. The other authors declare no competing interests.

Figures

Fig. 1
Fig. 1. T2D GWAS discovery and overall analysis approach.
a, Overview of the cohorts, sample size and pre-processing steps for each cohort included in the T2D GWAS meta-analysis. b, Manhattan plots for variants with an overall study MAF > 0.001 (bottom) and MAF < 0.001 (top). The y axis shows the −log10(P) from the meta-analysis of two-sided logistic regression models, weighting the cohorts by the inverse of the s.e. for each variant. The dashed horizontal line represents the genome-wide significance threshold (P < 5 × 10−8). The x axis represents the genomic position (GRCh38). c, ORs for all genome-wide, significant, conditionally independent variants plotted across MAF. New and known variants are represented, with primary signals denoted by stars and secondary signals by points. d, Overview of the downstream analyses that use the rare variant meta-analysis GWAS results to inform the classification of variants in monogenic diabetes genes within ClinVar groups. We selected all the variants reported in ClinVar in genes involved in monogenic diabetes. For those that are present in our meta-analysis, we categorized them as ‘VIP’, ‘supporting benign’ or ‘inconclusive’ according to the OR and CIs of their association with T2D. We then validated the GWAS-based classification in the AoU external dataset, assessing the aggregate effect of the variants on T2D risk. Finally, we stratified the carriers and the noncarriers of the variants within the VIP category based on their PRS and assessed their risk of T2D. QC, quality control.
Fig. 2
Fig. 2. Functional characterization of a new low-frequency variant associated with T2D.
a, LocusZoom plots for the rs147287548 region. Each point represents a variant, with its P value (on a −log10 scale, y axis) derived from the meta-analysis of two-sided logistic regression models, weighting the cohorts by the inverse of the s.e. for each variant. The x axis represents the genomic position (GRCh38). b, Representation of chromatin interactions (enhancer-capture HiC), accessibility (assay for transposable-accessible chromatin with sequencing), H3K27ac and H3K4me1 chromatin immunoprecipitation sequencing signal coverage in T2D-relevant tissues. The box with the dashed line highlights the chromatin fragment that contains rs147287548, which shows significant long-range chromatin interactions with the promoter of the LEP gene in mesenchymal stem cells (MSCs) and throughout in vitro adipogenesis. The wider chromatin landscape of this locus and chromatin interactions detected by enhancer-capture HiC are shown in Extended Data Fig. 6. Details of the datasets shown are provided in Supplementary Table 6. c, Forest plot showing the carrier counts and ORs of rs147287548 in the discovery, replication and overall datasets. The ORs from each cohort from the discovery and replication datasets are denoted by boxes and the 95% CIs by horizontal lines. Arrows were added for 95% CI LB < 0.3 and 95% CI UB > 40. The center of the diamonds represents the OR of the meta-analysis, with the horizontal extremities indicating the 95% CI. Statistical significance is from the meta-analysis of two-sided logistic regression models, weighting the cohorts by the inverse of the s.e. for each variant. d, Transcription factor motif disruption results. The minor allele of rs147287548 is predicted to disrupt an NFATc-binding site. e, Luciferase reporter assay in mouse 3T3-L1-derived adipocytes showing allele-dependent activity of the enhancer harboring the rs147287548 variant. The data are represented as the fold change in relative luciferase signal over the average activity of the negative controls (empty pGL4.23) ± s.e.m. (n = 3 independent experiments with four independent transfections). Statistical significance was determined using a two-tailed Student’s t-test. Alt., alternative; Ref., reference.
Fig. 3
Fig. 3. Classification of variants in 22 monogenic diabetes genes from 1,634 ClinVar and assessment of their effect when collapsing them in single burden variables according to the GWAS-based classification.
a, Overview of the variant classification strategy according to the meta-analyses results in UKB/GERA/MGBB (excluding AoU). We extracted variants in monogenic diabetes genes from ClinVar labeled as ‘uncertain significance’, ‘conflicting interpretations of pathogenicity’, ‘likely benign’, ‘likely pathogenic’ and ‘pathogenic’. We then classified these variants based on the UKB/GERA/MGBB meta-analysis OR and 95% CI LB and UB. Variants with a meta-analytic OR > 5 and an OR 95% CI LB > 2 are classified as VIP. Variants with an OR 95% UB < 2 are classified as supports benign. Variants with an OR 95% CI UB > 2 and LB < 2 are classified as inconclusive. b, Results of this analysis for the variants of CIP and uncertain significance according to ClinVar. Only variants with MAF < 0.001 were considered for this analysis. The x axis represents the MAF. Along the y axis, the OR for each variant is denoted by the points and the 95% CI by the vertical lines. The P values are from the meta-analysis of two-sided logistic regression models, weighting the cohorts by the inverse of the s.e. for each variant. c, Variants aggregated in a single burden variable according to the ClinVar- and GWAS-based classifications to test for their cumulative effects on T2D in the full AoU cohort (n T2D cases = 26,271, n controls = 43,174). The forest plots represent each combination of ClinVar groups and GWAS-based classifications. The OR for each burden test is denoted by the points and the 95% CI by the horizontal lines. The P values are from two-sided logistic regression models.
Fig. 4
Fig. 4. Effect of three identified VIPs on T2D risk.
ac, Forest plots showing the carrier counts and ORs of p.Arg114Trp (a), p.Pro475Leu (b) and p.Val455Glu (c) in the discovery, replication and overall datasets. The ORs of each cohort from the discovery and replication datasets are denoted by boxes and the 95% CIs by horizontal lines. Arrows were added for 95% CI LB < 0.5 and 95% CI UB > 4. The center of the diamonds represents the OR of the meta-analysis, with the horizontal extremities indicating the 95% CI. The P values are from the meta-analysis of two-sided logistic regression models, weighting the cohorts by the inverse of the s.e. for each variant. After correcting for multiple comparisons, the three variants showed significance (P < 3.1 × 10−5 from 0.05 of 1,634 tested ClinVar variants).
Fig. 5
Fig. 5. Effect of the VIPs versus confirmed pathogenic MODY variants on diabetes risk and related clinical variables.
ac, Forest plots showing the effect of p.Arg114Trp, p.Pro475Leu and p.Val455Glu, stratified by PRS tertiles. The ORs are denoted by boxes and the 95% CIs by horizontal lines. The P values are from the meta-analysis of two-sided logistic regression models, weighting the cohorts by the inverse of the s.e. for each variant. The ORs are relative to the noncarriers in the middle tertile of the PRS. On the top of each Forest plot, the effects of being a carrier for a confirmed pathogenic variant for HNF4A (a), HNF1A (b) and GCK (c) MODY genes are also represented, using data identified via exome sequencing in UKB. For each effect estimate, the diabetes case definition included individuals with T1D or T2D. df, Boxplots of HbA1c (%), random glucose (mg dl−1) and BMI (kg m−2) in cases with diabetes and noncases among noncarriers (NCs, left), carriers of variants with intermediate penetrance (middle) and carriers of confirmed pathogenic MODY variants (right) in HNF4A (d), HNF1A (e) and GCK (f). The covariate-adjusted P value is included for comparisons with significant differences (*P < 0.05, **P < 0.001, ***P < 0.0001) between groups using two-sided Wilcoxon’s rank-sum tests. Boxplots indicate the group median (central line), first and third quartiles (bounds of box) and 1.5× interquartile range (whiskers).
Extended Data Fig. 1
Extended Data Fig. 1. QQ plots from the discovery T2D GWAS meta-analysis, including UKB, GERA, MGBB, and AoU v5 cohorts.
a, QQ plot including variants with minor allele frequency ≥ 0.05. b, QQ plot including variants with minor allele frequency between 0.01 and 0.05. c, QQ plot including variants with minor allele frequency between 0.01 and 0.005. d, QQ plot including variants with minor allele frequency between 0.005 and 0.001. e, QQ plot including variants with minor allele frequency between 0.001 and 0.0005. f, QQ plot including variants with minor allele frequency between 0.0005 and 0.00005.
Extended Data Fig. 2
Extended Data Fig. 2. Comparison of UKB data imputed with TOPMed versus HRC-1000G-UK10K (original imputation release).
a,b, The line graphs show the average INFO score, and the bar plots show the total number of variants in the TOPMed imputation versus the HRC-1000G-UK10K imputation across the minor allele frequency (MAF) spectrum before (a) and after (b) filtering for variants with an INFO score greater than 0.7. MAC, minor allele count.
Extended Data Fig. 3
Extended Data Fig. 3. Benchmark of TOPMed imputation accuracy across the allele frequency spectrum.
The average percentage of carriers of variants identified in Monogenic Diabetes whole-exome sequencing in Goodrich et al. identified with imputation in a subset of 40 K UKB samples. The y-axis represents the average proportion of carriers identified among variants with imputation INFO > 0.8 in the imputed data from TOPMed vs HRC-1000G-UK10K (original UKB imputation release). The x-axis represents the different allele frequency bins. MAF, minor allele frequency; MAC, minor allele count.
Extended Data Fig. 4
Extended Data Fig. 4. Comparison of UKB/GERA/MGBB/AoU results for lead variants from largest T2D GWAS meta-analysis.
Comparison of effect estimates and -log10(P) values from Vujkovic et al. (x-axis, n T2D cases = 228,499, n controls = 1,178,783) and UKB/GERA/MGBB/AoU meta-analysis (y-axis, n T2D cases = 51,256, n controls = 370,487) for lead variants from Vujkovic et al.. a,b, Comparison of the beta and standard error values for variants with minor allele frequency (MAF) > 0.05 (a) and MAF < 0.05 (b), respectively. Each point represents the beta value for each variant. The standard errors from the UKB/GERA/MGBB/AoU results are represented by the blue vertical bars, while the standard errors from Vujkovic et al. are represented by the black horizontal bars. c,d, Comparison of the -log10(P) values for variants with MAF > 0.05 (c) and MAF < 0.05 (d), respectively. Each point represents the -log10(P) values for each variant.
Extended Data Fig. 5
Extended Data Fig. 5. Locuszoom plots of novel-identified variants at genome-wide significance (p < 5 ×10⁻⁸) and corresponding forest plots from the discovery T2D GWAS meta-analysis.
a-h, Rare (MAF < 0.001) variants identified in autosomes: 2:27425274:C:T (a), 2:213085963:G:A (b), 4:23750157:G:A (c), 6:99432794:G:A (d), 7:128323039:G:A (e), 8:110165438:T:C (f), 14:73781721:C:T (g), 20:44385421:G:A (h). i-k, Variants identified in chrX, sex-combined analysis: X:9605153:C:T (i), X:19361522:G:C (j), X:45923705:A:C (k). l, Variant identified in chrX, female-only analysis. The meta-analysis included 51,256 T2D cases and 370,487 controls. The forest plots show the carrier counts and odds ratios for each cohort in which the variant was present. The odds ratio (OR) from each cohort from the discovery dataset is denoted by boxes proportional to the size of the cohort, and the 95% confidence intervals (CI) are denoted by the horizontal lines. Sample sizes for each cohort are detailed in Supplementary Table 1. MAF, minor allele frequency.
Extended Data Fig. 6
Extended Data Fig. 6. Epigenomic landscape of the LEP locus.
a, Colored tracks show Roadmap Epigenomics 12-mark, 25-state imputation-based chromatin state models (GRCh38 lift-over version) for 127 human tissues and cell types. The zoomed inset at the bottom highlights the only tissues (out of 127) in which the region where rs147287548 resides is annotated as an enhancer. b, Chromatin landscape of the LEP locus throughout in vitro adipogenesis. The left panel shows all enhancer-capture HiC chromatin interactions stemming from the fragment containing the rs147287548 variant, which resides in an active enhancer in mesenchymal stem cells and throughout adipogenesis (see also Fig. 2b, and panel a of this figure). The right panel shows a zoomed-in region, revealing more clearly chromatin interactions between the rs147287548-enhancer and the promoter of the LEP gene.
Extended Data Fig. 7
Extended Data Fig. 7. Plots of relevant metabolic traits in individuals free of diabetes who are carriers and non-carriers of the LEP rare variant or the variants with intermediate penetrance (VIPs) in Monogenic Diabetes genes.
a-b, Effect of LEP, rs147287548, chr7:128323039 on the levels of apolipoprotein A (a) and HDL cholesterol (b). c-m, Effect of HNF4A, chr20:44413714, p.Arg114Trp on the levels of apolipoprotein a (c), apolipoprotein b (d), aspartate aminotransferase (e), glucose (f), HDL cholesterol (g), lipoprotein A (h), triglycerides (i), total cholesterol (j), LDL cholesterol (k), sex hormone binding globulin (l) and urea (m). n-o, Effect of GCK, chr7:44145170, p.Val455Glu on the levels of glucose (n) and hba1c (o). Data from heterozygous carriers and from homozygous non-carriers of the variants. Individuals from UKB were considered for this analysis. Each violin plot represents the distribution of the metabolic trait values by genotype, with the width of the violin indicating the density of the data. The inner box plots indicate the group median (central line), first and third quartiles (bounds of box), and 1.5x interquartile range (whiskers).
Extended Data Fig. 8
Extended Data Fig. 8. Forest plots showing the carrier counts and odds ratios of the variants with intermediate penetrance (VIPs) (odds ratio > 5, and 95% confidence interval lower-bound 95% > 2) identified in the analysis of variants from ClinVar in Monogenic Diabetes genes.
This analysis included the UKB (n = 27,323 cases and 259,916 controls), MGBB (n = 6,623 cases and 41,411 controls), and GERA (n = 7,498 cases and 53,212 controls) cohorts. The odds ratio (OR) from each cohort from the discovery dataset is denoted by boxes proportional to the size of the cohort, and the 95% confidence intervals (CI) are denoted by the horizontal lines. a-d, Variants with conflicting interpretations of pathogenicity in ClinVar: 7:44145170:A:T (a), 12:120997588:C:T (b), 19:50402602:A:G (c), 19:50413456:G:A (d). e-g, Variants of uncertain significance in ClinVar: 4:6302287:G:A (e), 11:17388128:G:A (f), 19:50402228:G:A (g). h, Variant classified as likely benign in ClinVar: 19:50409504:C:T.
Extended Data Fig. 9
Extended Data Fig. 9. Classification of variants in 22 Monogenic Diabetes genes.
a, Variants classified as “likely benign” in Clinvar. b, Variants classified as “benign” in ClinVar. c, Variants classified as “likely pathogenic” in ClinVar. d, Variants classified as “pathogenic” in ClinVar. Variants classified as “conflicting interpretations of pathogenicity” or “uncertain significance” in ClinVar are shown in Fig. 3b. The x-axis represents the MAF. Along the y-axis, the odds ratio (OR) for each variant is denoted by the points, and the 95% confidence interval (CI) is denoted by the vertical lines. Only variants with MAF < 0.001 were considered for this analysis. Variants with a meta-analytic OR > 5 and an OR 95% LB > 2 are classified as “intermediate penetrance”. Variants with an OR 95% UB < 2 are classified as “supports benign”. Variants with an OR 95% UB > 2 and LB < 2 are classified as “inconclusive”. This analysis included the UKB (n = 27,323 cases and 259,916 controls), MGBB (n = 6,623 cases and 41,411 controls), and GERA (n = 7,498 cases and 53,212 controls) cohorts.
Extended Data Fig. 10
Extended Data Fig. 10. Boxplots of the age of diabetes diagnosis among non-carriers, carriers of variants with intermediate penetrance (VIPs), and carriers of confirmed pathogenic MODY variants.
a, Data for VIP in HNF4A. b, Data for VIP in HNF1A. c, Data for VIP in GCK. The age of diabetes diagnosis is expressed in years. Box plots indicate the group median (central line), first and third quartiles (bounds of box), and 1.5x interquartile range (whiskers). The covariate-adjusted P is included for comparisons with significant differences (P < 0.05) between groups.

Update of

References

    1. Huerta-Chagoya, A. et al. The power of TOPMed imputation for the discovery of Latino-enriched rare variants associated with type 2 diabetes. Diabetologia66, 1273–1288 (2023). - PMC - PubMed
    1. Suzuki, K. et al. Genetic drivers of heterogeneity in type 2 diabetes pathophysiology. Nature627, 347–357 (2024). - PMC - PubMed
    1. Mahajan, A. et al. Multi-ancestry genetic study of type 2 diabetes highlights the power of diverse populations for discovery and translation. Nat. Genet.54, 560–572 (2022). - PMC - PubMed
    1. Spracklen, C. N. et al. Identification of type 2 diabetes loci in 433,540 East Asian individuals. Nature582, 240–245 (2020). - PMC - PubMed
    1. Vujkovic, M. et al. Discovery of 318 new risk loci for type 2 diabetes and related vascular outcomes among 1.4 million participants in a multi-ancestry meta-analysis. Nat. Genet.5, 680–691 (2020). - PMC - PubMed

Publication types

Substances