Review
. 2024 Oct 8;22(1):606.
doi: 10.1186/s12951-024-02842-5.

Nanobiotechnology boosts ferroptosis: opportunities and challenges

Affiliations
Review

Nanobiotechnology boosts ferroptosis: opportunities and challenges

Shiqi Han et al. J Nanobiotechnology. .

Abstract

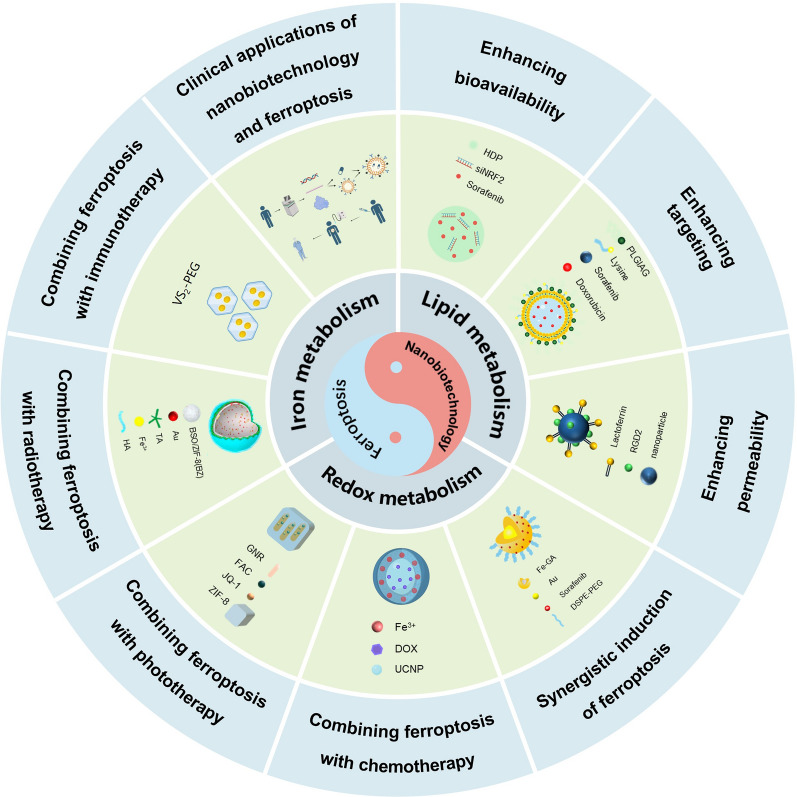
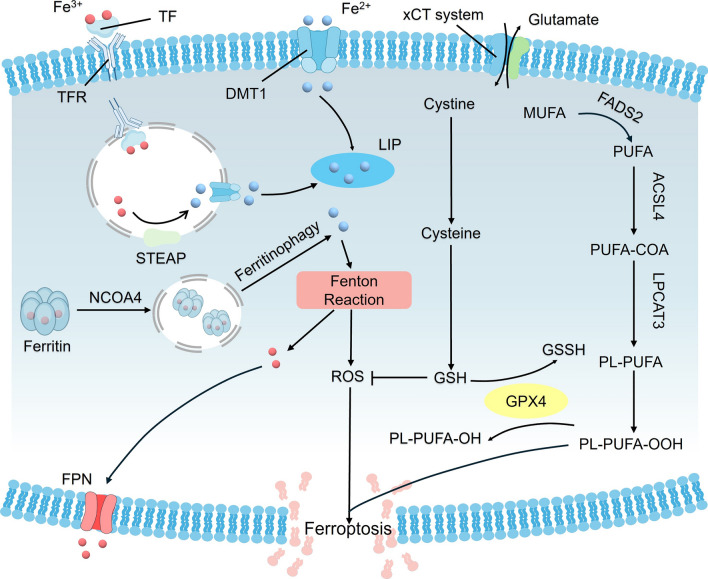
Ferroptosis, distinct from apoptosis, necrosis, and autophagy, is a unique type of cell death driven by iron-dependent phospholipid peroxidation. Since ferroptosis was defined in 2012, it has received widespread attention from researchers worldwide. From a biochemical perspective, the regulation of ferroptosis is strongly associated with cellular metabolism, primarily including iron metabolism, lipid metabolism, and redox metabolism. The distinctive regulatory mechanism of ferroptosis holds great potential for overcoming drug resistance-a major challenge in treating cancer. The considerable role of nanobiotechnology in disease treatment has been widely reported, but further and more systematic discussion on how nanobiotechnology enhances the therapeutic efficacy on ferroptosis-associated diseases still needs to be improved. Moreover, while the exciting therapeutic potential of ferroptosis in cancer has been relatively well summarized, its applications in other diseases, such as neurodegenerative diseases, cardiovascular and cerebrovascular diseases, and kidney disease, remain underreported. Consequently, it is necessary to fill these gaps to further complete the applications of nanobiotechnology in ferroptosis. In this review, we provide an extensive introduction to the background of ferroptosis and elaborate its regulatory network. Subsequently, we discuss the various advantages of combining nanobiotechnology with ferroptosis to enhance therapeutic efficacy and reduce the side effects of ferroptosis-associated diseases. Finally, we analyze and discuss the feasibility of nanobiotechnology and ferroptosis in improving clinical treatment outcomes based on clinical needs, as well as the current limitations and future directions of nanobiotechnology in the applications of ferroptosis, which will not only provide significant guidance for the clinical applications of ferroptosis and nanobiotechnology but also accelerate their clinical translations.

Keywords: Clinical treatment; Drug delivery; Drug resistance; Ferroptosis; Nanobiotechnology; Regulatory mechanism.


Conflict of interest statement

The authors declare no competing interests.

Figures

Fig. 1
Fig. 1
Schematic illustration of nanobiotechnology enhancing the therapeutic effects of ferroptosis-based drugs
Fig. 2
Fig. 2
Schematic illustration of the ferroptosis regulatory network
Fig. 3
Fig. 3
A Schematic representation of NDDSs enhanced the bioavailability of ferroptosis-related drugs. In the absence of a nanoparticle delivery carrier, sorafenib exhibits poor water solubility in blood, and siRNA is easily identified and cleared by macrophages, which decreases their bioavailability. However, the use of NDDSs (depicted as HDP in the diagram), enhances the solubility of drugs, prolongs their circulation time, and increases their bioavailability. B The zeta potentials of Pa-M/Ti-NCs in 10% FBS and PBS, little change was found during more than 2 weeks. C In vivo pharmacokinetic curves during 36 h after injection of different formulations B, C Were reproduced from ref. [82] with permission. Copyright 2019, American Chemical Society)
Fig. 4
Fig. 4
A Schematic representation of nanobiotechnology enhanced the targeting of ferroptosis-related drugs. ① Modifying nanoparticles to specifically target proteins that are overexpressed in tumor tissues for precise tumor targeting. ② Designing nanoparticles that are responsive to low pH and high ROS for precise tumor targeting. ③ Coating nanoparticles with cancer cell membranes for precise tumor targeting. BE Enhancing targeting based on overexpressed proteins of tumor tissues (reproduced from ref. [89] with permission. Copyright 2020, American Chemical Society). FI Enhancing targeting based on low pH tumor microenvironment (reproduced from ref. [95] with permission. Copyright 2018, American Chemical Society). J, K Enhancing targeting based on high ROS tumor microenvironment (reproduced from ref. [94] with permission. Copyright 2022, Oxford University Press). LN Enhancing targeting based on cell membrane coating (reproduced from ref. [137] with permission. Copyright 2021, John Wiley and Sons)
Fig. 5
Fig. 5
A MCF-7 or U-87 MG cells were coincubated with nanoparticles and analyzed by flow cytometry. The cells without nanoparticle treatment served as control group. B Mean fluorescence intensity ratio of nanoparticle-treated cells compared to untreated cells and the amount of nanoparticle internalization in U-87 MG cells measured by ICP. 1 fg = 10−15 g. C Schematic illustration of the in vitro BBB model. D Distribution of FeGd-HN, FeGd-HN@Pt2@LF/RGD2, or FeGd-HN@Pt2@LF/RGD2 plus LF block in the apical or basolateral compartment. Mean ± SD, n = 4; *P < 0.001. E T1-weighted MRI images of mouse normal brains (without tumors) before and after intravenous injection of Magnevist or FeGd-HN@Pt2@LF/RGD2 (CGd = 5.0 mg/kg mice). F Quantitative analysis of the T1-weighted MRI images in E using ΔSNR (reproduced from ref. [99] with permission. Copyright 2018, American Chemical Society)
Fig. 6
Fig. 6
A Multilevel scanning was performed starting from the base of the sphere at 5 or 10 μm intervals for penetration and corresponding fluorescence quantification. B 3D reconstruction of the 4T1 spheroid models accepted under different MNDs conditions. C Quantitative analysis of the penetration depth of different MNDs (reproduced from ref. [97] with permission. Copyright 2021, Elsevier)
Fig. 7
Fig. 7
A Schematic representation of nanobiotechnology synergistically induces ferroptosis. Au/Fe-GA and sorafenib synergistically induce ferroptosis by respectively accelerating the Fenton reaction and inhibiting GPX4. B CLSM images of the uptake of AFG/SFB@PEG in 4T1 cells at different times. Scale bar = 40 μm. C, D Cytotoxicity assay of AFG and AFG/SFB@PEG to 4T1 cells with or without laser, the concentration refers to the Fe-GA. E Apoptosis analysis of 4T1 cells in different treatment groups using flow cytometry (BE Was reproduced from ref. [148] with permission. Copyright 2023, Elsevier
Fig. 8
Fig. 8
A Schematic representation of nanobiotechnology combines ferroptosis with chemotherapy. Under the action of NIR, UCNPs reduce Fe3+ to Fe2+, DOX, and Fe2+ respectively promoting cell apoptosis and ferroptosis. B Expression levels of ferroptosis-related proteins (GPX4 and FACL4) measured by Western blotting. C Cytotoxicity analysis of 4T1 and MCF-7 cells treated with different formulations after 24 h incubation. D Live/dead cytotoxicity analysis of 4T1 cells after treatment with different formulations after 24 h incubation. E Apoptosis analysis of 4T1 cells after treatment with different formulations after 24 h incubation by flow cytometry (BE Were reproduced from ref. [152] with permission. Copyright 2019, American Chemical Society
Fig. 9
Fig. 9
A Schematic representation of nanobiotechnology combines ferroptosis with phototherapy. GNRs, under the effect of NIR, generate high temperature to kill tumor cells and promote the release of drugs. The released FAC and JQ-1 respectively accelerates the Fenton reaction and inhibits GPX4, synergistically inducing ferroptosis. B The live/dead cell cytotoxicity analysis of 4T1 cells stained by AM/PI after incubation with various groups (scale bar = 100 mm for all panels). C CLSM images of ROS generation after 4T1 cells were treated with different formulations. Scale bar = 25 mm. D Quantitative analysis of the ROS intensity in various conditions. E Cytotoxicity analysis of 4T1 cells treated with various formulations. F Cytotoxicity analysis of 4T1 cells treated with various concentrations of GNRs@JF/ZIF-8 (reproduced from ref. [154] with permission. Copyright 2023, Elsevier)
Fig. 10
Fig. 10
A Schematic representation of the therapeutic mechanism of BZAMH NPs. B The fluorescence biodistribution of Cy5.5-labeled BZAMH in 4T1 tumor-bearing mice. C The Cy5.5 fluorescent images of tumor and major organs 24 h post-injection. D Time-dependent tumor growth curves after various treatments. E Survival curves of mice under various treatments (reproduced from ref. [157] with permission. Copyright 2023, American Chemical Society)
Fig. 11
Fig. 11
A Schematic representation of nanobiotechnology combines ferroptosis with immunotherapy. VS2-PEG NSs achieve synergistic treatment of ferroptosis and immunotherapy by depleting GSH and regulating the immune microenvironment, which includes enhancing the tumor infiltration of T cells and dendritic cells, and reducing the proportion of Treg cells and M2-type macrophages. B DC maturation (CD80+ CD86+) in tumors, gating on CD11c+ cells; C CD8+ T cells in CD3+ CD45+ T cells in the tumor; D CD80+ F4/80+ M1 macrophages in CD11b+ CD45+ cells in the tumor; E CD206+ F4/80+ M2 macrophages in CD11b+ CD45+ cells in the tumor; F Foxp3+ CD4+ Tregs in CD3+ CD45+ T cells in the tumor. G1, PBS; G2, α-PD-1; G3, VS2-PEG; and G4, VS2-PEG + α-PD-1. GL Detection of Na+/K+ ATPase activity, cytokines IL-1β, TNF-α, IL-6, IL-4, and IL-10 in tumors (A Was created with Biorender.com; BI Were reproduced from ref. [167] with permission. Copyright 2023, American Chemical Society)
Fig. 12
Fig. 12
A Schematic representation of the synergistic antitumor effect of the ferroptosis inducer Fe3+ and the exosome inhibitor GW4869. B Tumor growth curves during treatment. G1, PBS; G2, anti-PD-L1; G3, HGF; G4, HGF+ anti-PD-L1. C Survival rates of different groups over time. DF Quantitative analysis the proportion of CD8+ and CD4+ T cells in CD3+ T cells in the tumor-draining lymph node. GL Quantitative analysis the proportion of GzmB+ cells, Ki67+ cells and Tim3+ cells in CD8+ and CD4+ T cells (reproduced from ref. [168] with permission. Copyright 2021, Springer Nature)
Fig. 13
Fig. 13
Nanobiotechnology realizes personalized diagnosis and treatment integration for ferroptosis-related diseases (the figure is created with Biorender.com)

Similar articles

Cited by

References

    1. Dixon SJ, Lemberg KM, Lamprecht MR, Skouta R, Zaitsev EM, Gleason CE, et al. Ferroptosis: an iron-dependent form of nonapoptotic cell death. Cell. 2012;149(5):1060–72. - PMC - PubMed
    1. Yagoda N, von Rechenberg M, Zaganjor E, Bauer AJ, Yang WS, Fridman DJ, et al. RAS-RAF-MEK-dependent oxidative cell death involving voltage-dependent anion channels. Nature. 2007;447(7146):864–8. - PMC - PubMed
    1. Siegel RL, Miller KD, Fuchs HE, Jemal A. Cancer statistics, 2022. CA Cancer J Clin. 2022;72(1):7–33. - PubMed
    1. Nussinov R, Tsai C-J, Jang H. Anticancer drug resistance: an update and perspective. Drug Resist Updat. 2021;59: 100796. - PMC - PubMed
    1. Hassannia B, Vandenabeele P, Vanden BT. Targeting ferroptosis to iron out cancer. Cancer Cell. 2019;35(6):830–49. - PubMed

LinkOut - more resources