. 2024 Oct 8;22(1):431.
doi: 10.1186/s12916-024-03657-9.

Cortical morphological changes and associated transcriptional signatures in post-traumatic stress disorder and psychological resilience

Affiliations

Cortical morphological changes and associated transcriptional signatures in post-traumatic stress disorder and psychological resilience

Minlan Yuan et al. BMC Med. .

Abstract

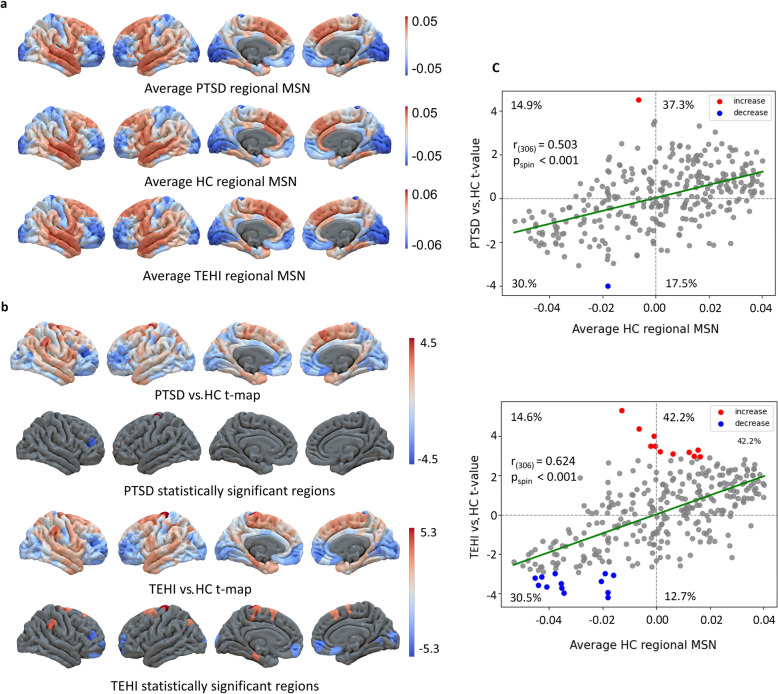
Background: Individuals who have experienced severe traumatic events are estimated to have a post-traumatic stress disorder (PTSD) prevalence rate ranging from 10 to 50%, while those not affected by trauma exposure are often considered to possess psychological resilience. However, the neural mechanisms underlying the development of PTSD, especially resilience after trauma, remain unclear. This study aims to investigate changes of cortical morphometric similarity network (MSN) in PTSD and trauma-exposed healthy individuals (TEHI), as well as the associated molecular alterations in gene expression, providing potential targets for the prevention and intervention of PTSD.

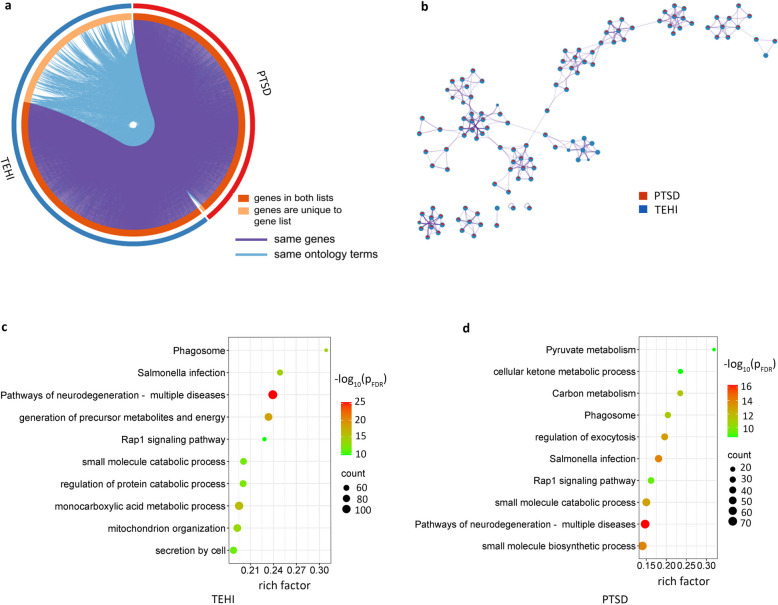
Methods: We recruited PTSD patients and TEHI who had experienced severe earthquakes, and healthy controls who had not experienced earthquakes. We identified alterations in the whole-brain MSN changes in PTSD and TEHI, and established associations between these changes and brain-wide gene expression patterns from the Allen Human Brain Atlas microarray dataset using partial least squares regression.

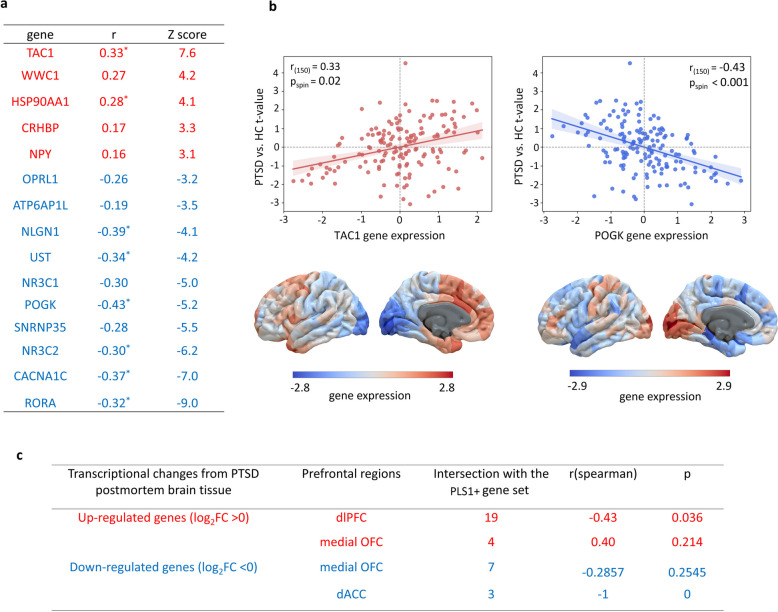
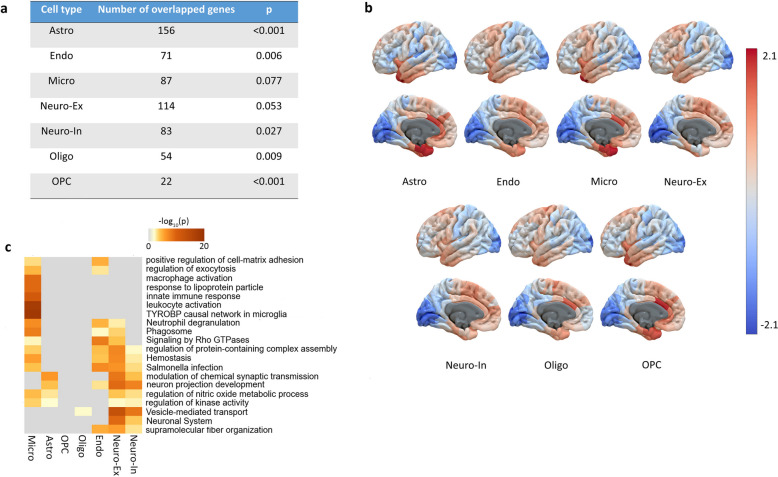
Results: At the neuroimaging level, we found not only trauma-susceptible changes in TEHI same as those in PTSD, but also unique neurobiological alterations to counteract the deleterious impact of severe trauma. We identified 1444 and 2214 genes transcriptionally related to MSN changes in PTSD and TEHI, respectively. Functional enrichment analysis of weighted gene expression for PTSD and TEHI revealed distinct enrichments in Gene Ontology biological processes and Kyoto Encyclopedia of Genes and Genomes pathways. Furthermore, gene expression profiles of astrocytes, excitatory neurons, and microglial cells are highly related to MSN abnormalities in PTSD.

Conclusions: The formation of resilience may be by an active compensatory process of the brain. The combination of macroscopic neuroimaging changes and microscopic human brain transcriptomics could offer a more direct and in-depth understanding of the pathogenesis of PTSD and psychological resilience, shedding light on new targets for the prevention and treatment of PTSD.

Keywords: Astrocytes; Gene expression; Morphometric similarity network; Post-traumatic stress disorder; Psychological resilience.


Conflict of interest statement

The authors declare no competing interests.

Figures

Fig. 1
Fig. 1
Study overview. Structural magnetic resonance brain imaging data was collected from three groups: PTSD, TEHI, and HC. The brain was segmented and parcellated into D-K 308 atlas. Seven features from each brain region were extracted and the MSN network for each individual was calculated. T-maps for PTSD vs. HC and TEHI vs. HC were constructed. The gene expression data from the Allen Brain Atlas was assigned to 308 regions according to the D-K308 atlas. The brain gene expression data and t-maps were combined using the PLS method to identify significant genes for PLS1. Enrichment analyses were performed for these genes
Fig. 2
Fig. 2
Regional MSN changes in PTSD and TEHI. a Average regional MSN of three groups. b T-maps of PTSD vs HC and TEHI vs HC. In PTSD, 2 cortical regions showed statistically significant differences (pFDR < 0.05). In TEHI, 24 cortical regions showed statistically significant differences (pFDR < 0.05). c Scatterplots showing the relationship between the average regional MSN (x-axis) and t-map (y-axis). The upper subplot represents the t-map for PTSD vs. HC (Pearson’s r(306) = 0.503, pspin < 0.001) and the lower subplot represents the t-map for TEHI vs. HC (Pearson’s r(306) = 0.624, pspin < 0.001). P value was determined based on a one-sided test
Fig. 3
Fig. 3
Weighted gene expression associated with regional MSN changes in PTSD and TEHI. a The weighted gene expression maps of regional PLS1 scores and the t-maps in the left hemisphere, for PTSD and TEHHI, respectively. b Scatterplots of regional PLS1 scores and t-map of regional MSN. The left plot represents the PTSD group (Pearson’s r(150) = 0.52, pspin < 0.001), and the right plot represents the TEHI group (Pearson’s r(150) = 0.57, pspin < 0.001). P value was determined based on a one-sided test
Fig. 4
Fig. 4
Enrichment analysis of genes transcriptionally related to MSN changes. a A circos plot of genes overlapped between the PTSD group and the TEHI group for the PLS1 + gene set. b The enrichment network with its nodes displayed as pie sections for the genes shared between PTSD and TEHI. Each pie sector is proportional to the number of hits originating from a gene list. cd Ontology terms for PLS1 + genes (Z > 3, pFDR < 0.05) for TEHI and PTSD. The horizontal axis represents the rich factor of the ontology terms. The size of the circle represents the number of genes involved in a given term. The color of the circles represents the degree of significant enrichment
Fig. 5
Fig. 5
PLS1-weighted expression of previously identified PTSD genes correlated with MSN changes. ab The PTSD-related genes expressed in the brain were screened from the NCBI database and the overlap with the PLS1 gene set. Positively correlated genes include TAC1: Pearson’s r(150) = 0.33, adjusted pspin = 0.017; WWC1: Pearson’s r(150) = 0.27, adjusted pspin = 0.088; HSP90AA1: Pearson’s r(150) = 0.28, adjusted pspin = 0.034; CRHBP: Pearson’s r(150) = 0.17, adjusted pspin = 0.210; NPY: Pearson’s r(150) = 0.16, adjusted pspin = 0.230. Negatively correlated genes include OPRL1: Pearson’s r(150) =  − 0.26, adjusted pspin = 0.054; ATP6AP1L: Pearson’s r(150) =  − 0.19, adjusted pspin = 0.191; NLGN1: Pearson’s r(150) =  − 0.39, adjusted pspin = 0; UST: Pearson’s r(150) =  − 0.34, adjusted pspin = 0.017; NR3C1: Pearson’s r(150) =  − 0.30, adjusted pspin = 0.082; POGK: Pearson’s r(150) =  − 0.43, adjusted pspin = 0; SNRNP35: Pearson’s r(150) =  − 0.28, adjusted pspin = 0.068; NR3C2: Pearson’s r(150) =  − 0.30, adjusted pspin = 0.042; CACNA1C: Pearson’s r(150) =  − 0.37, adjusted pspin = 0.008; RORA: Pearson’s r(150) =  − 0.32, adjusted pspin = 0.032). All p-values were derived from the spin test, determined based on a one-sided test, and adjusted using the FDR method. The asterisk (*) indicates p-values that remain significant after FDR correction with p < 0.05. c Weighted gene expression of PTSD-related MSN changes associated with transcriptional changes of dorsal lateral prefrontal cortex from PTSD postmortem brain tissue
Fig. 6
Fig. 6
Expression of genes in specific cell types of PTSD. a The number of overlapping genes for each cell type and the corresponding p-values from the spatial permutation testing it were determined based on a one-sided test. b Gene expression maps of each cell type from overlapping genes between the PLS1 + gene and each cell type-specific gene. c Gene ontology terms enriched for overlapping genes between PLS1 + genes and each cell type-specific genes

References

    1. American Psychiatric Association D, Association AP. Diagnostic and statistical manual of mental disorders: DSM-5, vol. 5. Washington, DC: American Psychiatric Association; 2013.
    1. Benjet C, Bromet E, Karam EG, Kessler RC, McLaughlin KA, Ruscio AM, Shahly V, Stein DJ, Petukhova M, Hill E, et al. The epidemiology of traumatic event exposure worldwide: results from the world mental health survey consortium. Psychol Med. 2016;46(2):327–43. - PMC - PubMed
    1. Beaglehole B, Mulder RT, Frampton CM, Boden JM, Newton-Howes G, Bell CJ. Psychological distress and psychiatric disorder after natural disasters: systematic review and meta-analysis. Br J Psychiatry. 2018;213(6):716–22. - PubMed
    1. Shalev A, Liberzon I, Marmar C. Post-traumatic stress disorder. N Engl J Med. 2017;376(25):2459–69. - PubMed
    1. Nestler EJ, Russo SJ. Neurobiological basis of stress resilience. Neuron. 2024;112(12):1911–29. - PMC - PubMed

Publication types

LinkOut - more resources