. 2024 Oct 8;19(1):69.
doi: 10.1186/s13024-024-00756-2.

α-Synuclein pathology disrupts mitochondrial function in dopaminergic and cholinergic neurons at-risk in Parkinson's disease

Affiliations

α-Synuclein pathology disrupts mitochondrial function in dopaminergic and cholinergic neurons at-risk in Parkinson's disease

Fanni F Geibl et al. Mol Neurodegener. .

Abstract

Background: Pathological accumulation of aggregated α-synuclein (aSYN) is a common feature of Parkinson's disease (PD). However, the mechanisms by which intracellular aSYN pathology contributes to dysfunction and degeneration of neurons in the brain are still unclear. A potentially relevant target of aSYN is the mitochondrion. To test this hypothesis, genetic and physiological methods were used to monitor mitochondrial function in substantia nigra pars compacta (SNc) dopaminergic and pedunculopontine nucleus (PPN) cholinergic neurons after stereotaxic injection of aSYN pre-formed fibrils (PFFs) into the mouse brain.

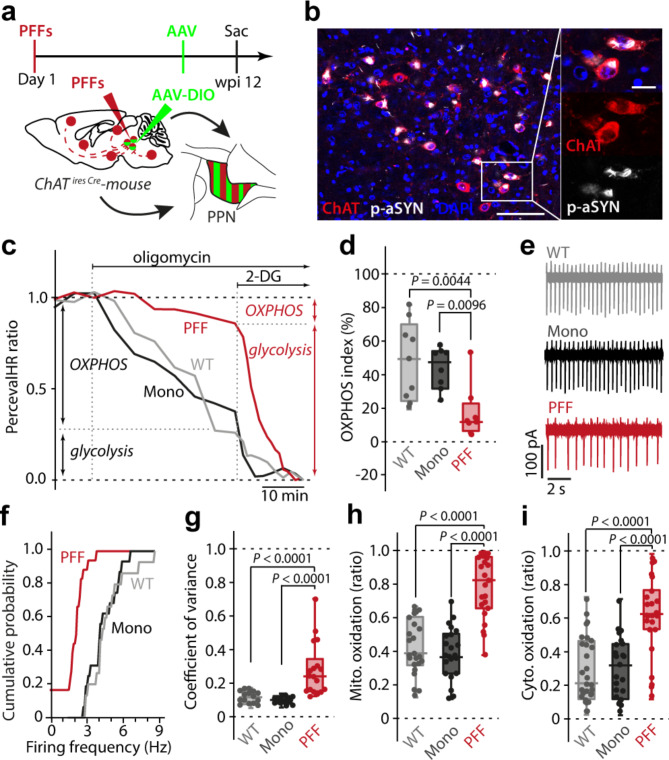
Methods: aSYN PFFs were stereotaxically injected into the SNc or PPN of mice. Twelve weeks later, mice were studied using a combination of approaches, including immunocytochemical analysis, cell-type specific transcriptomic profiling, electron microscopy, electrophysiology and two-photon-laser-scanning microscopy of genetically encoded sensors for bioenergetic and redox status.

Results: In addition to inducing a significant neuronal loss, SNc injection of PFFs induced the formation of intracellular, phosphorylated aSYN aggregates selectively in dopaminergic neurons. In these neurons, PFF-exposure decreased mitochondrial gene expression, reduced the number of mitochondria, increased oxidant stress, and profoundly disrupted mitochondrial adenosine triphosphate production. Consistent with an aSYN-induced bioenergetic deficit, the autonomous spiking of dopaminergic neurons slowed or stopped. PFFs also up-regulated lysosomal gene expression and increased lysosomal abundance, leading to the formation of Lewy-like inclusions. Similar changes were observed in PPN cholinergic neurons following aSYN PFF exposure.

Conclusions: Taken together, our findings suggest that disruption of mitochondrial function, and the subsequent bioenergetic deficit, is a proximal step in the cascade of events induced by aSYN pathology leading to dysfunction and degeneration of neurons at-risk in PD.

Keywords: Alpha-synuclein; Bioenergetics; Dopaminergic; Electrophysiology; Lewy pathology; Mitochondria; Parkinson’s disease; Pedunculopontine nucleus; Substantia Nigra; Transcriptome.


Conflict of interest statement

The authors declare that they have no competing interests.

Figures

Fig. 1
Fig. 1
aSYN PFF injection causes PD-like neurodegeneration of midbrain DA SNc neurons. a, Experimental protocol. b, TH+ SNc neurons exhibiting p-aSYN pathology 12 weeks after initial seeding (upper row), while pathology is absent in aSYN monomer injected mice (lower row). Scale bar, 150 μm in overviews, 30 μm in magnified images. c, Transduction rates for SNc injected mice compared to conventional striatal (STR) injected mice (box plots represent median and interquartile range, whiskers min/max value; SNc (N = 7); STR (N = 3), Mann-Whitney-U test). d, p-aSYN+ aggregates were p62+ and resistant to digestion with Proteinase K (PK). Scale bar, 30 μm. e, Representative images showing neurodegeneration of DA SNc neurons on the injected side. Scale bar, 500 μm. f, Box plots showing number of TH+ neurons in SNc (box plots represent median and interquartile range, whiskers min/max value; Mono (N = 7), PFF (N = 7), Kruskal-Wallis test with Dunn’s multiple comparisons). g, Box plots showing number of NeuN+ neurons in SNc (box plots represent median and interquartile range, whiskers min/max value; Mono (N = 7), PFF (N = 7), Kruskal-Wallis test with Dunn’s multiple comparisons). h, Quantification of TH expression in the dorsal striatum (box plots represent median and interquartile range, whiskers min/max value; Mono (N = 7), PFF (N = 7), Unpaired t-test). i, Image showing TH expression in striatum. White square indicates measured ROI. Scale bar, 600 μm
Fig. 2
Fig. 2
α-synucleinopathy causes disruption of mitochondrial OXPHOS resulting in energetic disbalance of DA SNc neurons. a, Experimental protocol for PercevalHR experiment. b, PercevalHR expression in a p-aSYN+ TH+ DA SNc neuron. Scale bar, 10 μm. c, Representative time-lapse measurements of PercevalHR fluorescence ratio. Oligomycin and 2-deoxyglucose (2-DG) were applied to determine OXPHOS and glycolytic contribution to ATP/ADP ratio. d, Box plots showing OXPHOS index for WT, Mono, and PFF treated mice. Synucleinopathy shifts neuronal metabolism to the glycolytic pathway at 12 wpi with mitochondria becoming net consumers of ATP. Note, at 6 wpi DA SNc neurons still possess an OXPHOS index comparable to WT and monomeric injected mice (box plots represent median and interquartile range, whiskers min/max value; WT (N = 8, n = 9), Mono (N = 6, n = 10), PFF 6 wpi (N = 5, n = 7), PFF 12 wpi (N = 5, n = 9), One-way ANOVA test with Tukey’s multiple comparisons). e, Experimental protocol for RiboTag experiment. f, Image depicting expression of RiboTag in p-aSYN+ DA SNc neurons. Scale bar in overviews 300 μm, and 50 μm in magnified image. g, Heatmap of RNASeq analysis showing significantly down- or upregulated genes of OXPHOS (Mono (N = 10), PFF (N = 10), Wald test adjusted using Benjamini-Hochberg method, p < 0.05). h, Scheme depicting significantly down- or upregulated units of the mitochondrial respiratory chain. i, Scheme indicating sampling zone for electrophysiological recordings within SNc. j, Representative cell-attached recordings of DA SNc neurons. k, Autonomous pacemaking of DA SNc neurons (box plots represent median and interquartile range, whiskers min/max value; WT (N = 5, n = 14), Mono (N = 5, n = 18), PFF (N = 5, n = 19), Kruskal-Wallis test with Dunn’s multiple comparisons). l, Cumulative probability plot of SNc DA autonomous discharge rates (WT (N = 5, n = 14), Mono (N = 5, n = 18), PFF (N = 5, n = 19). m, n, Heatmap of RNASeq analysis showing expression profiles of K+ channel and GABAa Receptor units (m) and downregulation of synaptic DA release genes (n) (Mono (N = 10), PFF (N = 10), Wald test adjusted using Benjamini-Hochberg method, p < 0.05). o, Box plots showing normalized gene expression values for DA phenotype genes (box plots represent median and interquartile range, whiskers min/max value; Mono (N = 10), PFF (N = 10), Wald test adjusted using Benjamini-Hochberg method, p < 0.05)
Fig. 3
Fig. 3
α-synucleinopathy leads to mitochondrial oxidation and morphological alterations of mitochondria and lysosomes. a, Experimental protocol. b, Mito-roGFP expression in a p-aSYN+ TH+ DA SNc neuron. Scale bar, 10 μm. c, Calibration protocol. d, Synucleinopathy elevates mitochondrial ROS levels already at 6 wpi (box plots represent median and interquartile range, whiskers min/max value; WT (N = 5, n = 26), Mono (N = 5, n = 30), PFF 6 wpi (N = 6, n = 26), PFF 12 wpi (N = 5, n = 15), Kruskal-Wallis test with Dunn’s multiple comparisons). e, Cyto-roGFP expression in a p-aSYN+ TH+ DA SNc neuron. Scale bar, 10 μm. f, Synucleinopathy increases basal cytosolic oxidation (box plots represent median and interquartile range, whiskers min/max value; WT (N = 5, n = 34), Mono (N = 5, n = 20), PFF (N = 5, n = 36), Kruskal-Wallis test with Dunn’s multiple comparisons). g, Transmission electron micrographs of SNc DA neurons from monomeric aSYN (left) or PFF (right) injected mice. The nucleus is highlighted in green, mitochondria in red, and lysosomes in black, respectively. Scale bar 10 μm. h, Series of transmission electron micrographs showing healthy, swollen, and degenerated mitochondria of SNc DA neurons. Scale bar 300 nm. i, Box plots showing quantification of mitochondrial morphology (box plots represent median and interquartile range, whiskers min/max value; WT (N = 4, n = 10), Mono (N = 4, n = 10), PFF (N = 4, n = 10), Kruskal-Wallis test with Dunn’s multiple comparisons). j, Box plots indicating mitochondrial density as percent of cytosol area (box plots represent median and interquartile range, whiskers min/max value; WT (N = 4, n = 10), Mono (N = 4, n = 10), PFF (N = 4, n = 10), Kruskal-Wallis test with Dunn’s multiple comparisons). k, Transmission electron micrographs showing different lysosome stages, including multilamellar bodies, in a SNc DA neuron from a PFF injected mouse. Scale bar 1 μm. l, Quantification of lysosome density as percent of cytosol area (box plots represent median and interquartile range, whiskers min/max value; WT (N = 4, n = 10), Mono (N = 4, n = 10), PFF (N = 4, n = 10), One-way ANOVA test with Tukey’s multiple comparisons). m, Box plots indicating average size of lysosomes (box plots represent median and interquartile range, whiskers min/max value; WT (N = 4, n = 10), Mono (N = 4, n = 10), PFF (N = 4, n = 10), One-way ANOVA test with Tukey’s multiple comparisons). n, o, Heatmaps of RNASeq analysis showing significantly down- or upregulated genes of lysosomal (n), and proteasomal (o) degradation pathways (Mono (N = 10), PFF (N = 10), Wald test adjusted using Benjamini-Hochberg method, p < 0.05)
Fig. 4
Fig. 4
α-synucleinopathy induces similar metabolic, electrophysiological, and oxidative alterations in cholinergic PPN neurons. a, Experimental protocol. b, Image depicting p-aSYN pathology in ChAT+ PPN neurons 12 weeks after initial seeding. Scale bar, 100 μm in overview, 20 μm in magnified image. c, Representative time-lapse measurements of PercevalHR fluorescence ratio. Oligomycin and 2-DG were applied to determine OXPHOS and glycolytic contribution to ATP/ADP ratio. d, Box plots showing OXPHOS index for WT, Mono, and PFF treated mice. Synucleinopathy shifts neuronal metabolism to the glycolytic pathway (box plots represent median and interquartile range, whiskers min/max value; WT (N = 7, n = 8), Mono (N = 7, n = 8), PFF (N = 6, n = 9), Kruskal-Wallis test with Dunn’s multiple comparisons). e, Representative cell-attached recordings of identified ChAT+ PPN neurons. f, Cumulative probability plots of ChAT+ PPN autonomous discharge rates (WT (N = 6, n = 15), Mono (N = 5, n = 16), PFF (N = 6, n = 18). g, Box plots showing coefficient of variance (box plots represent median and interquartile range, whiskers min/max value; WT (N = 6, n = 15), Mono (N = 5, n = 16), PFF (N = 6, n = 18), Kruskal-Wallis test with Dunn’s multiple comparisons). h, Basal mitochondrial oxidative stress is elevated in cholinergic PPN neurons of PFF injected mice (box plots represent median and interquartile range, whiskers min/max value; WT (N = 7, n = 23), Mono (N = 5, n = 22), PFF (N = 6, n = 23), Kruskal-Wallis test with Dunn’s multiple comparisons). i, Basal cytosolic ROS levels are significantly increased in cholinergic PPN neurons of PFF injected mice (box plots represent median and interquartile range, whiskers min/max value; WT (N = 5, n = 28), Mono (N = 5, n = 23), PFF (N = 5, n = 24), Kruskal-Wallis test with Dunn’s multiple comparisons) Declarations

Update of

References

    1. Poewe W, Seppi K, Tanner CM, Halliday GM, Brundin P, Volkmann J, Schrag AE, Lang AE. Parkinson disease. Nat Rev Dis Primers. 2017;3:17013. - PubMed
    1. Singleton AB, Farrer M, Johnson J, Singleton A, Hague S, Kachergus J, Hulihan M, Peuralinna T, Dutra A, Nussbaum R, et al. Alpha-synuclein locus triplication causes Parkinson’s disease. Science. 2003;302:841. - PubMed
    1. Spillantini MG, Schmidt ML, Lee VM, Trojanowski JQ, Jakes R, Goedert M. Alpha-synuclein in Lewy bodies. Nature. 1997;388:839–40. - PubMed
    1. Braak H, Del Tredici K, Rub U, de Vos RA, Jansen Steur EN, Braak E. Staging of brain pathology related to sporadic Parkinson’s disease. Neurobiol Aging. 2003;24:197–211. - PubMed
    1. Luk KC, Kehm V, Carroll J, Zhang B, O’Brien P, Trojanowski JQ, Lee VM. Pathological alpha-synuclein transmission initiates Parkinson-like neurodegeneration in nontransgenic mice. Science. 2012;338:949–53. - PMC - PubMed

Substances

LinkOut - more resources