

A pilot study of the cardiopulmonary effects in healthy volunteers after exposure to high levels of PM2.5 in a New York City subway station
- PMID: 39379984
- PMCID: PMC11460011
- DOI: 10.1186/s12989-024-00594-6
A pilot study of the cardiopulmonary effects in healthy volunteers after exposure to high levels of PM2.5 in a New York City subway station
Abstract
Background: Subway systems are becoming increasingly common worldwide transporting large populations in major cities. PM2.5 concentrations have been demonstrated to be exceptionally high when underground, however. Studies on the impact of subway PM exposure on cardiopulmonary health in the United States are limited.
Methods: Healthy volunteers in New York City were exposed to a 2-h visit on the 9th Street Station platform on the Port Authority Trans-Hudson train system. Blood pressure, heart rate variability (HRV), spirometry, and forced impulse oscillometry were measured, and urine, blood spot, and nasal swab biosamples were collected for cytokine analysis at the end of the 2-h exposure period. These endpoints were compared against individual control measurements collected after 2-h in a "clean" control space. In addition to paired comparisons, mixed effects models with subject as a random effect were employed to investigate the effect of the PM2.5 concentrations and visit type (i.e., subway vs. control).
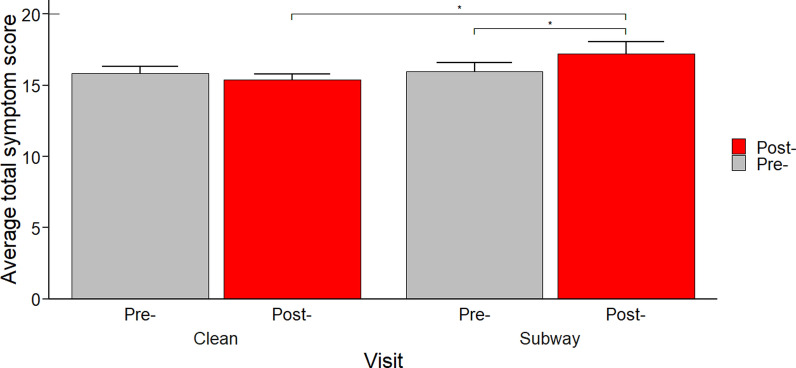
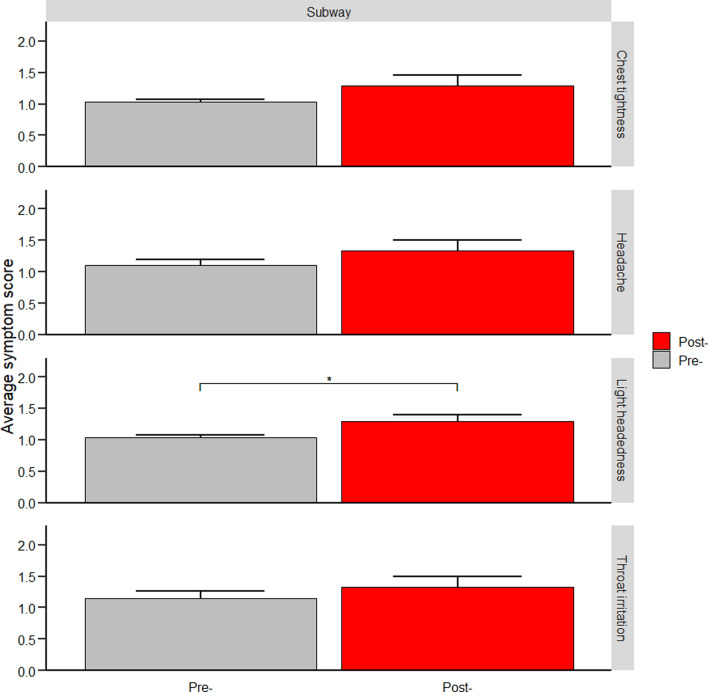
Results: Mean PM2.5 concentrations on the platform and during the control visit were 293.6 ± 65.7 (SD) and 4.6 ± 1.9 µg/m3, respectively. There was no change in any of the health metrics, but there was a non-significant trend for SDNN to be lower after subway exposure compared to control exposure. Total symptomatic scores did increase post-subway exposure compared to reported values prior to exposure or after the control visit. No significant changes in cytokine concentrations in any specimen type were observed. Mixed-effects models mostly corroborated these paired comparisons.
Conclusions: Acute exposures to PM on a subway platform do not cause measurable cardiopulmonary effects apart from reductions in HRV and increases in symptoms in healthy volunteers. These findings match other studies that found little to no changes in lung function and blood pressure after exposure in underground subway stations. Future work should still target potentially more vulnerable populations, such as individuals with asthma or those who spend increased time underground on the subway such as transit workers.
Keywords: Air pollution; Blood pressure; Cardiopulmonary; Exposure; Heart rate variability; Metals; Oscillometry; PM2.5; Spirometry; Subway; Urban environment.
© 2024. The Author(s).
Conflict of interest statement
The authors declare no competing interests.
Figures
References
-
- UITP. Statistics brief: world metro figures 2021. Brussels: UITP; 2022.
-
- Metropolitan Transit Authority. Subway and bus ridership for 2022. MTA; 2023. Available from https://new.mta.info/agency/new-york-city-transit/subway-bus-ridership-2022.
-
- Port Authority of NY/NJ. PATH ridership report: 2023. 2024.
-
- Lu H, Zhu Y, Yu J. Do urban subway openings reduce PM2.5 concentrations? Evidence from China. Sustainability. 2018;10:4147. - DOI
-
- Li S, Liu Y, Purevjav A-O, Yang L. Does subway expansion improve air quality? J Environ Econ Manag. 2019;96:213–35. - DOI
MeSH terms
Substances
Grants and funding
LinkOut - more resources
Full Text Sources
