. 2024 Oct 8;17(1):91.
doi: 10.1186/s13045-024-01610-0.

The small inhibitor WM-1119 effectively targets KAT6A-rearranged AML, but not KMT2A-rearranged AML, despite shared KAT6 genetic dependency

Affiliations

The small inhibitor WM-1119 effectively targets KAT6A-rearranged AML, but not KMT2A-rearranged AML, despite shared KAT6 genetic dependency

Mathew Sheridan et al. J Hematol Oncol. .

Abstract

Background: The epigenetic factors KAT6A (MOZ/MYST3) and KMT2A (MLL/MLL1) interact in normal hematopoiesis to regulate progenitors' self-renewal. Both proteins are recurrently translocated in AML, leading to impairment of critical differentiation pathways in these malignant cells. We evaluated the potential of different KAT6A therapeutic targeting strategies to alter the growth of KAT6A and KMT2A rearranged AMLs.

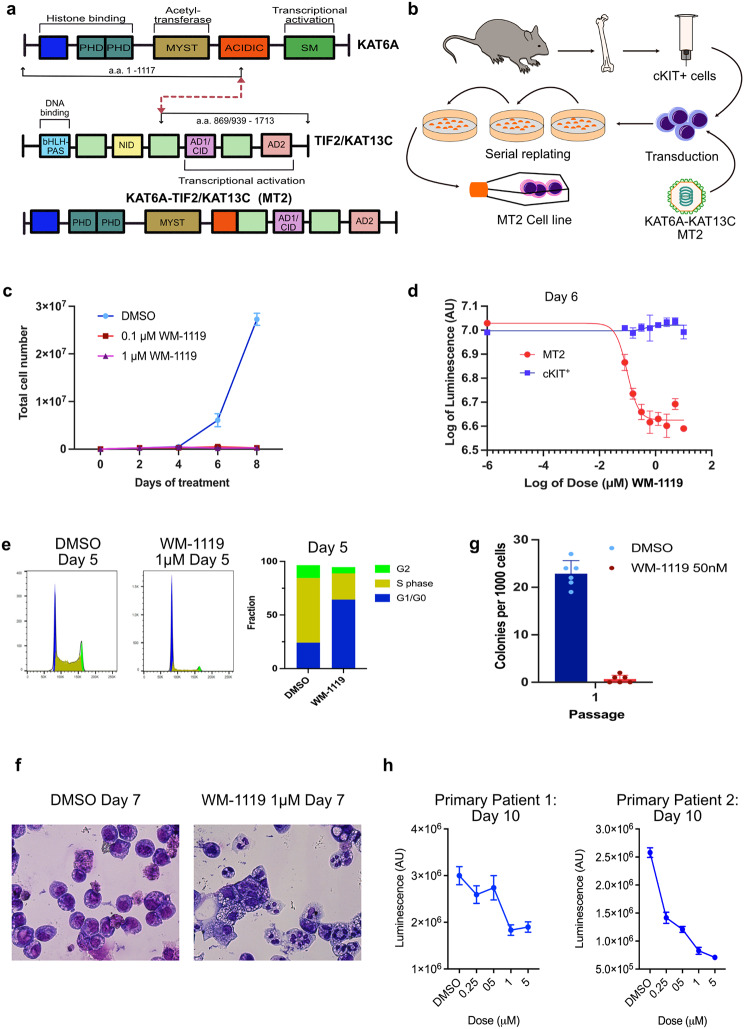
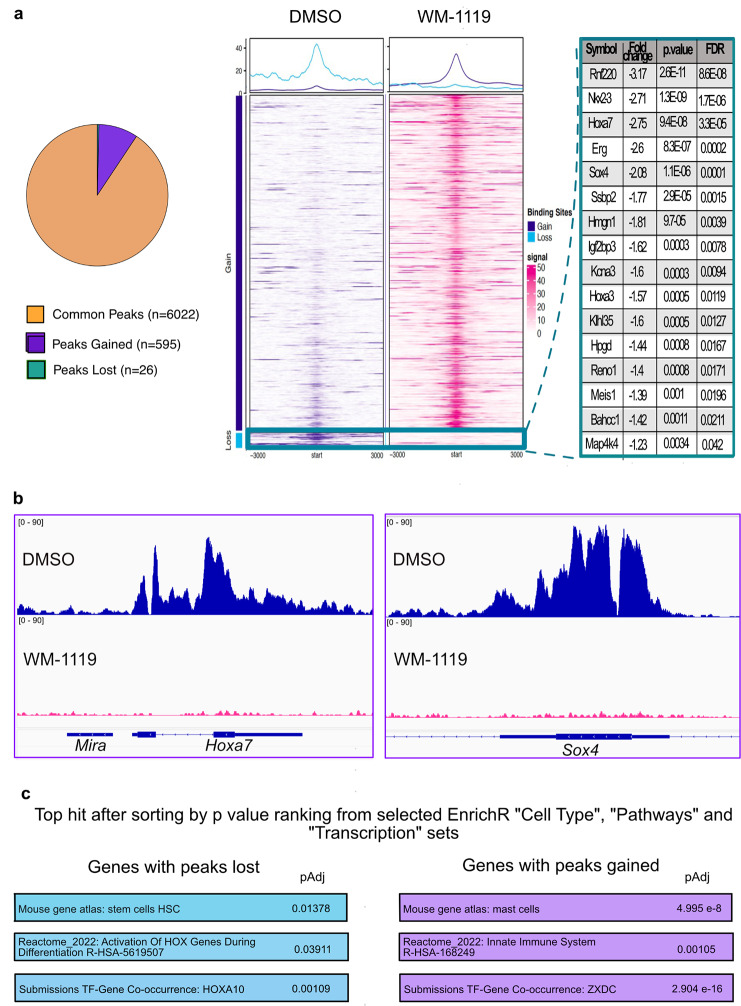
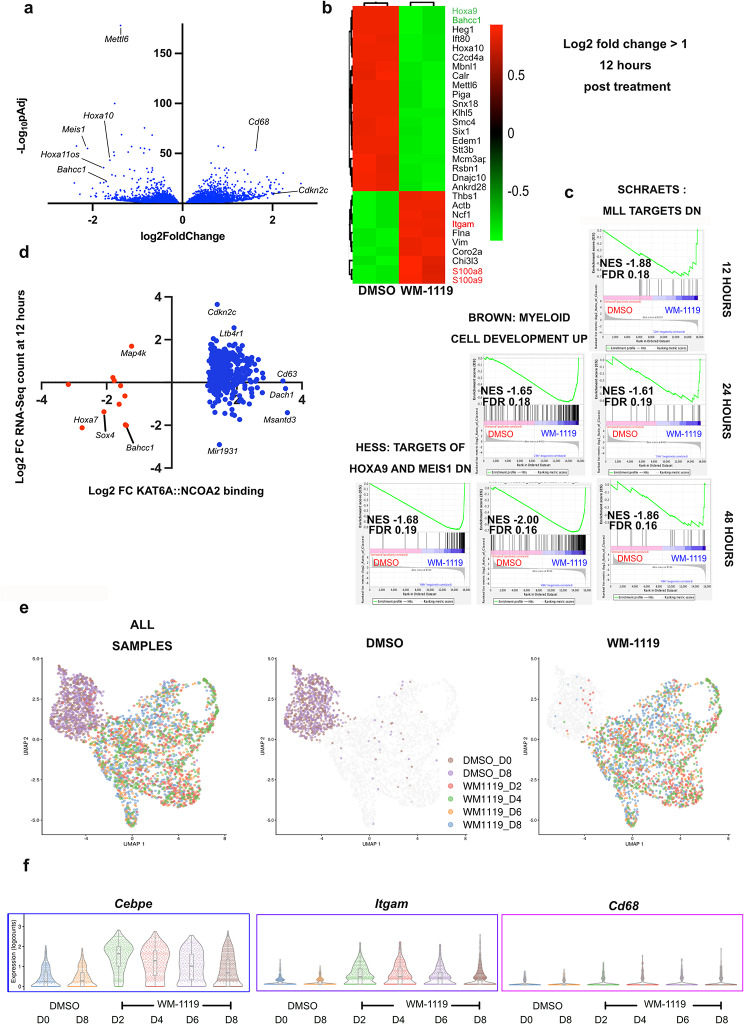
Methods: We investigated the action and potential mechanisms of the first-in-class KAT6A inhibitor, WM-1119 in KAT6A and KMT2A rearranged (KAT6Ar and KMT2Ar) AML using cellular (flow cytometry, colony assays, cell growth) and molecular (shRNA knock-down, CRISPR knock-out, bulk and single-cell RNA-seq, ChIP-seq) assays. We also used two novel genetic murine KAT6A models combined with the most common KMT2Ar AML, KMT2A::MLLT3 AML. In these murine models, the catalytic activity of KAT6A, or the whole protein, can be conditionally abrogated or deleted. These models allowed us to compare the effects of specific KAT6A KAT activity inhibition with the complete deletion of the whole protein. Finally, we also tested these therapeutic approaches on human AML cell lines and primary patient AMLs.

Results: We found that WM-1119 completely abrogated the proliferative and clonogenic potential of KAT6Ar cells in vitro. WM-1119 treatment was associated with a dramatic increase in myeloid differentiation program. The treatment also decreased stemness and leukemia pathways at the transcriptome level and led to loss of binding of the fusion protein at critical regulators of these pathways. In contrast, our pharmacologic and genetic results indicate that the catalytic activity of KAT6A plays a more limited role in KMT2Ar leukemogenicity, while targeting the whole KAT6A protein dramatically affects leukemic potential in murine KMT2A::MLLT3 AML.

Conclusion: Our study indicates that inhibiting KAT6A KAT activity holds compelling promise for KAT6Ar AML patients. In contrast, targeted degradation of KAT6A, and not just its catalytic activity, may represent a more appropriate therapeutic approach for KMT2Ar AMLs.


Conflict of interest statement

The authors declare no competing interests.

Figures

Fig. 1
Fig. 1
Inhibiting the catalytic activity of KAT6A impairs the growth of KAT6A translocated AML. a, Schematic outline of KAT6A and NCOA2 proteins showing known functional domains and the KAT6A::NCOA2 fusion protein. PHD, plant homeodomain. MYST, ‘MOZ, YBF2, SAS2, TIP’ domain. SM, serine-methionine rich domain. bHLH-PAS, basic helix–loop–helix/Per-ARNT-SIM domain. NIP, Nuclear Receptor Interaction Domain. CID, CREB-binding protein Interaction Domain. b, Schematic of the generation of the murine KAT6A::NCOA2 AML cell line (MT2). c, Cell counts for MT2 cells treated with DMSO and 0.1µM and 1µM WM-1119 every 2 days (n = 2, error bars represent mean with standard deviation). d, Proliferation (directly proportional to luminescence of Cell-Titer Glo®) of MT2 and cKit positive murine cells after treatment with different concentrations of WM-1119 (n = 3, error bars represent mean with standard deviation). e, Flow cytometric cell cycle analysis of MT2 cells after treatment with DMSO or 1µM WM-1119 for 5 days. f, Cytospin images of MT2 cells following DMSO or 1µM WM-1119 treatment. g, Colony forming assay for MT2 cells treated with DMSO or 50nM WM-1119 (n = 6, error bars represent mean with standard deviation). h, Proliferation (directly proportional to luminescence of added Cell-Titer Glo® reagent) of two KAT6A::CREBBP translocated patient samples, AML-24758B and AML-27,420 A treated with DMSO or different doses of WM-1119 for 10 days
Fig. 2
Fig. 2
WM-1119 abrogates KAT6A::NCOA2 fusion protein binding at genes implicated in leukemogenesis and stemness. a, Pie chart and heat maps showing changes in binding of KAT6A::NCOA2 after treatment with 2 µM WM-1119 compared to DMSO for 72 h. 16 genes, shown in table, show a loss of KAT6A::NCOA2 binding after treatment with WM-1119. b, Representative ChIP-Seq histogram tracks showing binding of KAT6A::NCOA2 across the gene bodies of Hoxa7 and Sox4 after 72 h of DMSO treatment and loss of this binding after treatment with 2µM WM-1119 for 72 h. c, Top hits by adjusted p value for selected “Cell Type”, “Pathways” and “Transcription” gene sets from EnrichR for genes with loss or gain of KAT6A::NCOA2 binding
Fig. 3
Fig. 3
WM-1119 abrogates the expression of genes implicated in leukemogenesis and stemness. a, Volcano plot showing differential gene expression in MT2 cells treated with 1µM WM-1119 compared to cells treated with DMSO at 48 h. b, Heatmap of genes with Log2 fold change ≥1 at 12 h after treatment. c, Leading edge plots for selected gene sets with FDR < 0.25 enriched in bulk MT2 cells 12, 24 and 48 h after treatment with 1µM WM-1119. d, Comparison of differential gene expression in cells treated with 1µM WM-1119 compared to cells treated with DMSO at 12 h for genes with loss or gain of KAT6A::NCOA2 binding at 72 h following treatment with 2µM WM-1119 compared to DMSO. e, UMAP clustering and f, violin plots for selected markers of myeloid differentiation of single MT2 cells at days 0 and 8 after treatment with control (DMSO) and at days 2, 4, 6 and 8 after treatment with 1µM WM-1119
Fig. 4
Fig. 4
Inhibiting the catalytic activity of KAT6A minimally affects KMT2A::MLLT3 AML growth. a, Schematic showing the genotypic effects of tamoxifen inducible Cre-loxP. b, Colony numbers and c, total cells counted after plating of 1,000 cells at each MeC round for KMT2A::MLLT3 AML cell lines with genotypes as detailed with or without treatment with 4-hydroxytamoxifen (4OHT). (n = 2, error bars represent mean with standard deviation, two tailed unpaired t test, p ≥0.05 (ns), 0.01 to 0.05 (*), 0.001 to 0.01 (**), 0.0001 to 0.001 (***), < 0.0001 (****)). d, Liquid culture competition assays between cells undergoing Cre recombination following 4OHT treatment and those untreated for control cells (KAT6AWT/WT) and KAT mutant cells (KAT6AFL/MUT). e, Colony numbers counted and f, total cells counted for murine KMT2A::MLLT3 AML cells treated with DMSO or 1µM WM-1119 at each passage. (n = 3, two tailed unpaired t test, p ≥0.05 (ns), 0.01 to 0.05 (*), 0.001 to 0.01 (**), 0.0001 to 0.001 (***), < 0.0001 (****))
Fig. 5
Fig. 5
Deletion of Kat6a leads to loss of leukemic potential in KMT2A::MLLT3 AML cells. a, Schematic showing the genotypic effects of tamoxifen inducible Cre-loxP. b, Colonies counted and c, total cells counted after plating of 1000 cells at each MeC round for Kat6aWT/WT or Kat6aFL/FL KMT2A::MLLT3 AML cell lines with or without treatment with 4OHT. For 4OHT treated cells, cells plated with 50nM 4OHT in round 1 and 10nM 4OHT rounds 2 and 3. (n = 3, error bars represent mean with standard deviation, two tailed unpaired t test, p ≥0.05 (ns), 0.01 to 0.05 (*), 0.001 to 0.01 (**), 0.0001 to 0.001 (***), < 0.0001 (****)). d, Competition assays showing the percentage of 4OHT treated or untreated cells over time. e, Leading edge plots for selected gene sets enriched in murine KMT2A::MLLT3 Kat6a KO AML cells at 4 and 7 days post 4OHT addition. NES, normalised enrichment score, FDR, false discovery rate. f, Kaplan-Meier plots for primary KMT2A::MLLT3 AML transplantation experiment (n = 5 in each group). P value Log-rank (Mantel-Cox) test, p ≥0.05 (ns), 0.01 to 0.05 (*), 0.001 to 0.01 (**), 0.0001 to 0.001 (***), < 0.0001 (****))
Fig. 6
Fig. 6
Deletion of KAT6A affects growth of human KMT2A::MLLT3 AML cell lines. a, Histogram showing marker of myeloid differentiation CD11b expression in THP-1 cells 6 days after induction of control shRNA against Renilla (shRenilla) or induction of shRNA’s targeting KAT6A (shKAT6A_1 and shKAT6A_2) and histogram showing relative mean fluorescence intensity of CD11b 3 days after induction of the same shRNAs. (n = 3, two tailed unpaired t test, p ≥0.05 (ns), 0.01 to 0.05 (*), 0.001 to 0.01 (**), 0.0001 to 0.001 (***), < 0.0001 (****)). b, Schematic showing single guides expressing BFP and targeting either KAT6A (sgKAT6A_1) or with no target (sgNT) were lentivirally transduced in to THP-1 or NOMO-1 cells. CRISPR editing occurs in BFP positive cells only. c, THP-1 and d, NOMO-1 CRISPR mediated cellular competition assay. BFP expressing cells are recorded relative to BFP expression four days after transduction over 23 or 25 days (n = 2). Relative mean fluorescence intensity (MFI) of the myeloid differentiation markers CD11b or CD86 was recorded at day 4 for cells expressing BFP in which CRISPR editing occurred or BFP negative cells in which there was no CRISPR editing (n = 3, two tailed unpaired t test, p ≥0.05 (ns), 0.01 to 0.05 (*), 0.001 to 0.01 (**), 0.0001 to 0.001 (***), < 0.0001 (****)). e, Relative mean fluorescence intensity (MFI) of the myeloid differentiation markers CD11b or CD86 4 days after treatment with the stated doses of WM-1119 at day 0 in THP-1 and NOMO-1 cells (n = 4 THP-1, n = 2 NOMO-1, both two tailed unpaired t test, p ≥0.05 (ns), 0.01 to 0.05 (*), 0.001 to 0.01 (**), 0.0001 to 0.001 (***), < 0.0001 (****)). f, Cell counts for THP-1 and NOMO-1 cells treated with the stated concentrations of WM-1119 every two days (n = 3). All error bars represent mean with standard deviation

References

    1. Shlush LI, Zandi S, Mitchell A, Chen WC, Brandwein JM, Gupta V, et al. Identification of pre-leukaemic haematopoietic stem cells in acute leukaemia. Nature. 2014;506:328–33. - PMC - PubMed
    1. Abelson S, Collord G, Ng SWK, Weissbrod O, Mendelson Cohen N, Niemeyer E, et al. Prediction of acute myeloid leukaemia risk in healthy individuals. Nature. 2018;559:400–4. - PMC - PubMed
    1. Chopra M, Bohlander SK. The cell of origin and the leukemia stem cell in acute myeloid leukemia. Genes Chromosomes Cancer. 2019;58:850–8. - PubMed
    1. Kantarjian H, Kadia T, DiNardo C, Daver N, Borthakur G, Jabbour E, et al. Acute myeloid leukemia: current progress and future directions. Blood Cancer J. 2021;11:41. - PMC - PubMed
    1. Yang XJ, Ullah M. MOZ and MORF, two large MYSTic HATs in normal and cancer stem cells. Oncogene. 2007;26:5408–19. - PubMed

Publication types

MeSH terms

Substances

LinkOut - more resources