. 2024 Oct 8;19(1):67.
doi: 10.1186/s13024-024-00757-1.

Heparin-enriched plasma proteome is significantly altered in Alzheimer's disease

Affiliations

Heparin-enriched plasma proteome is significantly altered in Alzheimer's disease

Qi Guo et al. Mol Neurodegener. .

Abstract

Introduction: Heparin binding proteins (HBPs) with roles in extracellular matrix assembly are strongly correlated to β-amyloid (Aβ) and tau pathology in Alzheimer's disease (AD) brain and cerebrospinal fluid (CSF). However, it remains challenging to detect these proteins in plasma using standard mass spectrometry-based proteomic approaches.

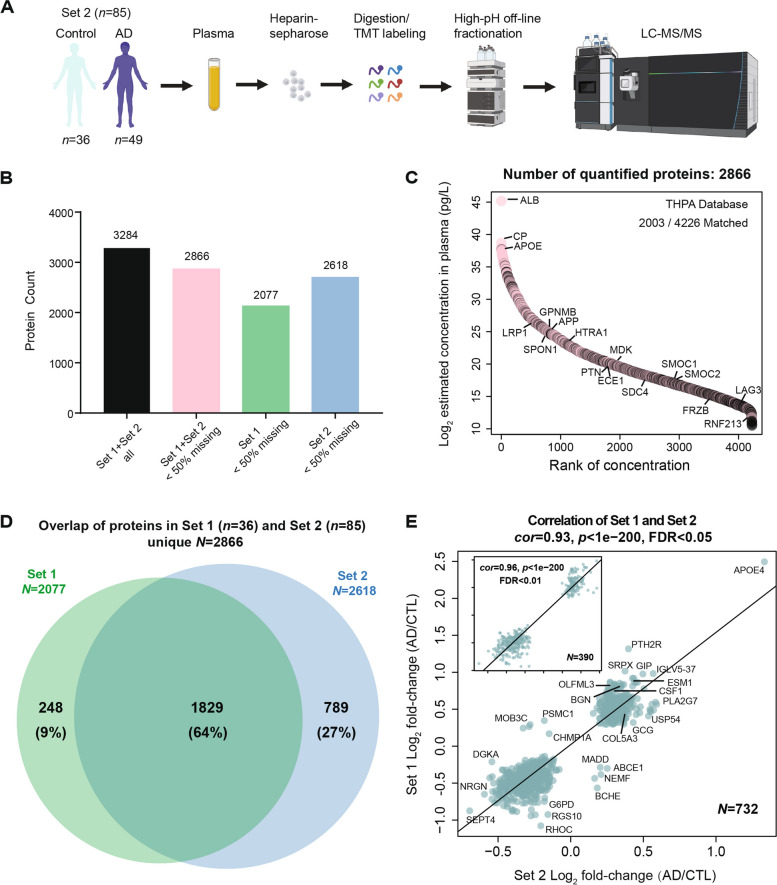
Methods: We employed heparin-affinity chromatography, followed by off-line fractionation and tandem mass tag mass spectrometry (TMT-MS), to enrich HBPs from plasma obtained from AD (n = 62) and control (n = 47) samples. These profiles were then correlated to Aβ, tau and phosphorylated tau (pTau) CSF biomarkers and plasma pTau181 from the same individuals, as well as a consensus brain proteome network to assess the overlap with AD brain pathophysiology.

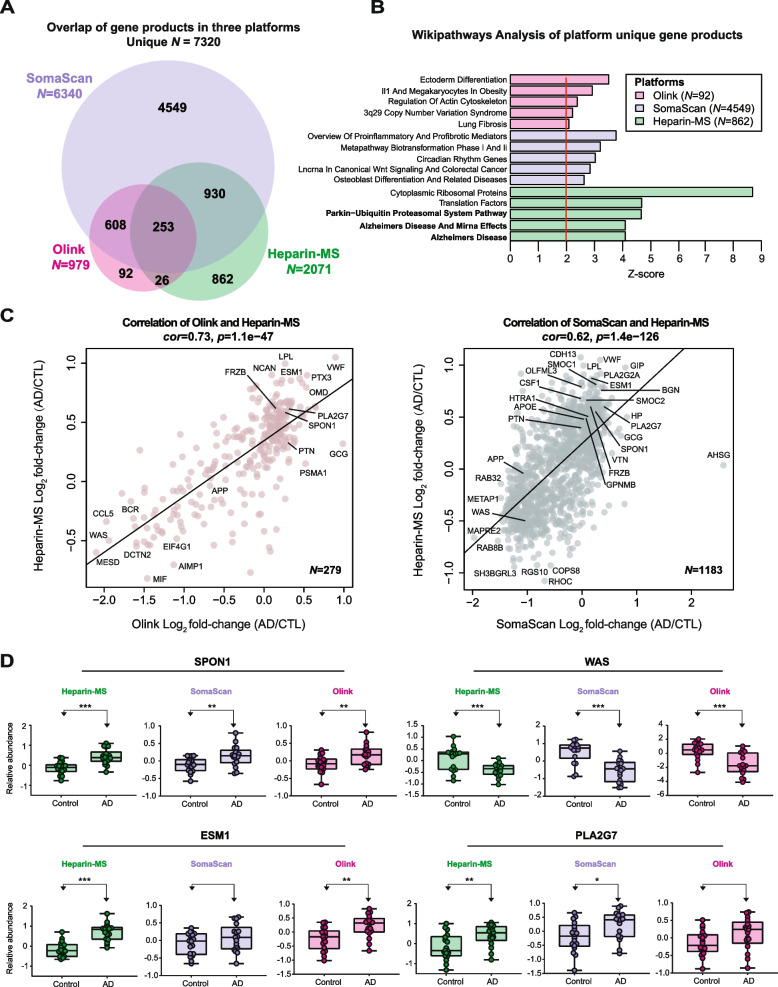
Results: Heparin enrichment from plasma was highly reproducible, enriched well-known HBPs like APOE and thrombin, and depleted high-abundant proteins such as albumin. A total of 2865 proteins, spanning 10 orders of magnitude in abundance, were measured across 109 samples. Compared to the consensus AD brain protein co-expression network, we observed that specific plasma proteins exhibited consistent direction of change in both brain and plasma, whereas others displayed divergent changes, highlighting the complex interplay between the two compartments. Elevated proteins in AD plasma, when compared to controls, included members of the matrisome module in brain that accumulate with Aβ deposits, such as SMOC1, SMOC2, SPON1, MDK, OLFML3, FRZB, GPNMB, and the APOE4 proteoform. Additionally, heparin-enriched proteins in plasma demonstrated significant correlations with conventional AD CSF biomarkers, including Aβ, total tau, pTau, and plasma pTau181. A panel of five plasma proteins classified AD from control individuals with an area under the curve (AUC) of 0.85. When combined with plasma pTau181, the panel significantly improved the classification performance of pTau181 alone, increasing the AUC from 0.93 to 0.98. This suggests that the heparin-enriched plasma proteome captures additional variance in cognitive dementia beyond what is explained by pTau181.

Conclusion: These findings support the utility of a heparin-affinity approach coupled with TMT-MS for enriching amyloid-associated proteins, as well as a wide spectrum of plasma biomarkers that reflect pathological changes in the AD brain.

Keywords: Alzheimer’s disease; Amyloid; Biomarkers; Cerebrospinal fluid; Heparan sulfate proteoglycans; Heparin; Plasma; Proteomics.


Conflict of interest statement

A.I.L, N.T.S. and D.M.D. are co-founders of Emtherapro Inc.

Figures

Fig. 1
Fig. 1
Heparin enrichment of the plasma proteome. A Step-by-step process of heparin enrichment and subsequent mass spectrometry (MS) analysis. Plasma samples were subjected to heparin enrichment, yielding three distinct fractions: DP input (n = 3), Hp-depleted FT (n = 3), and Hp-enriched fraction (n = 3). Each fraction underwent either Coomassie Blue staining, western blotting, or trypsin digestion before subsequent label-free MS analysis utilizing an Orbitrap Eclipse mass spectrometer. B Coomassie Blue staining and western blotting was performed in triplicates for all fractions. A reduction of the amount of albumin (~ 66 kDa) in the Hp-enriched fraction compared to the DP input and FT was illustrated by Coomassie Blue staining. Enrichment was also determined by western blotting for thrombin (~ 75 kDa) and APOE (~ 34 kDa) in the Hp-enriched fraction. C MS base peak chromatograms of each fraction reveal the variation in sample complexity. The Hp-enriched fraction exhibits a notable increase in sample complexity compared to the DP input and Hp-depleted FT fractions, reflecting successful enrichment of low-abundant proteins in the Hp-enriched fraction. D Total number of peptide spectral counts (reported as the maximum percentage) for albumin, thrombin, and APOE in each fraction. Actual spectral counts are labeled within columns. Albumin is significantly depleted from the Hp-enriched fraction compared to the DP input and FT. Conversely, thrombin and APOE are significantly enriched in this fraction. ANOVA with Tukey post-hoc correction was used to determine the p-values (* p < 0.05, ** p < 0.01, *** p < 0.001, **** p < 0.0001). E The number of proteins identified in each fraction: DP input (N = 611), Hp-depleted FT (N = 527), and Hp-enriched fraction (N = 771), and the degree of protein overlaps among them. F) GO terms for proteins detected in each fraction, using 841 total proteins measured in at least 2 out 3 replicates within each fraction as background, highlighting the enrichment of proteins associated with the "Heparin binding" molecular function in the Hp-enriched fraction. Z-score > 1.3 (p < 0.05) is significant. WB, western blotting; LC–MS, liquid chromatography-mass spectrometry
Fig. 2
Fig. 2
Heparin-enriched plasma proteome is significantly altered in AD. A Plasma samples were collected from both the control group (n = 18) and individuals with AD (n = 18). These samples underwent heparin-sepharose enrichment, followed by trypsin digestion and TMT labeling. Subsequently, high-pH off-line fractionation and LC–MS/MS analysis were conducted using an Orbitrap Lumos mass spectrometer. B Measurements of pTau181 across all 36 samples were displayed. Statistical significance was determined by Student's t-test (p = 2.94 × 10–6). C The volcano plot illustrates the differential abundance of 2,077 proteins between the control and AD groups. The x-axis represents the log2 fold-change (AD vs CTL), while the y-axis represents the Student’s t-statistic (-log10 p-value) calculated for all proteins in the pairwise group. Proteins significantly increased in AD (N = 579) are highlighted in red (p < 0.05), whereas those significantly decreased in AD (N = 661) are depicted in blue. Grey dots represent proteins with insignificant changes. D Top GO terms of the 579 increased (red) or 661 decreased (blue) proteins in AD measured in Set 1 considering the background of 2077 proteins in the plasma proteome. Three GO terms with the highest Z-scores within the domains of biological process, molecular function, and cellular components are presented. E A supervised cluster analysis was conducted across the control and AD plasma of discovery samples (Set 1), employing the 82 most significantly altered proteins in the dataset (BH FDR-corrected p < 0.0005). Other AD-related traits for each sample are also presented by color scale on the top. pTau, phospho-tau; tTau, total tau; CTL, control; LC–MS, liquid chromatography-mass spectrometry
Fig. 3
Fig. 3
Heparin-enriched plasma proteome is largely consistent and complementary to other independent proteomic platforms. A The number and overlap of proteins (i.e., unique gene products) quantified in plasma across three platforms, including the TMT-MS approach in Hp-enriched samples (Heparin-MS, control = 18, AD = 18), the PEA-based assay (Olink, control = 18, AD = 17), and the aptamer-based method (SomaScan, control = 18, AD = 17). The inclusion criterion required at least 18 measurements across all samples. B Wiki-pathway analysis highlighting specific pathways from uniquely identified gene products in each of the three platforms. The Heparin-MS method exhibited significant association with pathways related to ‘Alzheimer's disease and miRNA effects’ and ‘Parkin ubiquitin proteasomal system pathway’, underscoring the neurodegenerative disease specificity. A total of 5503 platform-unique gene symbols were used as background for GO analysis. C Pearson correlation between log2 fold-change (AD vs CTL) of common gene products measured by the Heparin-MS and Olink (left, N = 279 gene products, cor = 0.73, p = 1.1e−47) as well as the Heparin-MS and the SomaScan (right, N = 1183 gene products, cor = 0.62, p = 1.4e−126). The significance of Pearson correlation was determined by Student’s p-value. Several M42 members and associated proteins showed concordant directions in both comparisons, including SPON1, APP, PTN, FRZB, ESM1, PLA2G7, VWF, GCG, and LPL. D Boxplots display the consistent and statistically significant changes in AD observed for SPON1, WAS, ESM1, and PLA2G7 across all three platforms. Significance was determined by Student’s t-test (* p < 0.05, ** p < 0.01, *** p < 0.001). CTL, control; cor, Pearson correlation coefficient
Fig. 4
Fig. 4
Heparin enrichment enhances the depth of plasma proteome and is reproducible. A The second replication dataset (Set 2) was comprised of control (n = 36) and AD individuals (n = 49), which underwent similar heparin enrichment and TMT-MS analysis as the discovery dataset (Set 1). B The combined datasets yielded a total of 3284 unique proteins, and 2866 of them being identified and quantified in 50% or more of the samples (< 50% missing) across two sets. Set 1 and Set 2 identified 2077 and 2618 proteins respectively, with 50% missing. C The 2866 proteins were ranked by their log2 estimated concentration (pg/L) in plasma. Protein concentration information was obtained from The Human Protein Atlas Database. Notably, this set of proteins covered an impressive range of concentrations, spanning 10 orders of magnitude. Even proteins with the lowest concentration, such as LAG3 and RNF213, were included, along with numerous members of the M42 matrisome that are highlighted. D The number and overlap of proteins quantified in Set 1 (N = 2077) and Set 2 (N = 2618) with less than 50% missing values. Among the 2866 total unique proteins identified, approximately 64% (1829 out of 2866) were overlapping between the datasets. E A scatter plot illustrates the Pearson correlation between log2 fold-change (AD vs CTL) of significantly altered proteins in both Set 1 and Set 2. There’re 732 proteins overlapping in the two sets and being significantly changed in AD with a BH FDR-corrected p-value < 0.05 in both datasets. Only 10 out of 732 proteins exhibited discordant changes in the two sets, demonstrating a high degree of concordance (cor = 0.93, p < 1e−200). Furthermore, all 390 overlapping proteins selected with a BH FDR-corrected p-value < 0.01 displayed consistent changes in both datasets when comparing AD and control samples, with a remarkable correlation of 0.96 (p < 1e−200). The significance of Pearson correlation was determined by Student’s t-test. CTL, control; LC–MS, liquid chromatography-mass spectrometry; cor, Pearson correlation coefficient
Fig. 5
Fig. 5
Association of heparin binding proteins in plasma with cognition (MoCA) and conventional AD biomarkers: CSF Aβ1-42, tTau and pTau181 and plasma pTau181. A A meta-analysis of significant differences between control and AD on 2865 Hp-enriched plasma proteins that were measured in 50% or more samples within filtered Set 1 (control = 18, AD = 18) and Set 2 (control = 29, AD = 44). The x-axis represents the mean log2 fold-change (AD vs CTL), indicating an average abundance difference between Set 1 and Set 2. The y-axis shows the Student’s t-statistic (-log10 meta p-value) for all proteins in each pairwise group. Significantly increased proteins in AD are marked in red (meta p < 0.05), while proteins with significantly decreased levels in AD are denoted in blue. Grey dots represent proteins with insignificant changes. B The heatmap highlights 77 Hp-enriched plasma proteins that have strong correlations to AD biomarkers. The color scale represents the degree of Pearson correlation (positive in red and negative in blue) between Z-transformed plasma protein abundances and immunoassay measures of various AD-related traits, including cognition (MoCA score), CSF Aβ1-42, CSF tTau, CSF pTau181, CSF ratio of tTau/Aβ1-42, and plasma pTau181. Significance levels determined by Student's t-test are denoted by overlain asterisks; *p < 0.05, **p < 0.01, ***p < 0.001. C Individual scatterplots illustrate the correlations with CSF Aβ1-42, CSF pTau181, and plasma pTau181 of four specific Hp-enriched plasma proteins: ESM1, BGN, CSF1, and PLA2G7. Cor and p-values for each correlation are provided above each plot. The colors are differentiated by sets, with red representing Set 1 and blue denoting Set 2. pTau, phospho-tau; tTau, total tau; CTL, control; cor, Pearson correlation coefficient
Fig. 6
Fig. 6
Evaluation of heparin-enriched plasma proteins for classifying AD. ROC curves for CSF biomarker confirmed AD (n = 61) versus biomarker-negative control individuals (n = 34) were generated to determine the top-ranked diagnostic proteins among the 536 highly significant plasma proteins (meta p < 0.0001) with no missing values across all unique 95 individuals. A Individual ROC curves and AUCs for the top ten ranked plasma proteins, as well as plasma pTau181 alone. B ROC curves and AUCs of i) the combined top five performing proteins as a panel (pink), ii) plasma pTau181 alone (green), and iii) plasma pTau181 plus the protein panel (blue). ROC curve statistics for highly significant proteins, including AUC, p-value, 95% DeLong confidence interval, accuracy, specificity, and sensitivity for AD vs CTL, are provided in Supplemental Table 27. CTL, control; AUC, area under the curve
Fig. 7
Fig. 7
Mapping differential abundant heparin-enriched plasma proteins in AD within a human consensus brain network. A The I-graph displays the updated M42 membership following FP database search, which includes 35 total proteins. Members with increased abundance in Hp-enriched AD plasma are highlighted in red, while those with decreased abundance are indicated in blue. B The pie chart shows the number of proteins that overlap between the Hp-enriched plasma dataset (N = 2865) and consensus human brain datasets (N = 8956 proteins). 2211 out of 2865 (77%) proteins identified in plasma are also identified in the brain. The percentage coverage of proteins in each module is also presented. C 44 modules of previously generated consensus human brain co-expression network [11] visualized in the order of module relatedness following protein re-assignment as described in method. D Overlap of Hp-enriched plasma proteins (y-axis) with increased abundance in AD depicted in red or decreased abundance in AD shown in blue within brain network modules. The intensity of color shading indicates the degree of overlap. Statistical significance is indicated in the heatmap regions using stars (* p < 0.05, ** p < 0.01, *** p < 0.001). The p-values derived from FET were BH FDR-corrected. E The heatmap demonstrates the bicor correlations of each module with CERAD, Braak, and MMSE cognitive scores (* p < 0.05, ** p < 0.01, *** p < 0.001). As mentioned previously, M42 ‘Matrisome’ exhibits the strongest correlation with AD pathology, and several synaptic modules (M1, M4, M5, and M22) display an overall decrease in AD brain. F Using FET, the cell type nature of each module was assessed by module protein overlap with brain cell-type-specific markers of astrocytes, microglia, neurons, oligodendrocytes and endothelia. The strength of the color shading indicates the degree of cell type enrichment with asterisks denoting statistical significance (* p < 0.05, ** p < 0.01, *** p < 0.001). The FET-derived p-values were BH FDR-corrected. CTL, control
Fig. 8
Fig. 8
Overlap between human brain network modules and differentially abundant heparin-enriched plasma proteins in AD. Protein expression trends of the 12 out of 44 (27%) consensus brain network modules [11] that exhibited significant correlations with AD clinicopathological traits and were enriched with differentially abundant plasma proteins in AD. Brain module abundance is represented by eigenprotein values of the consensus brain network (control = 101, AsymAD = 181, AD = 174), while volcano plots illustrate the differential abundance (log2 fold-change AD vs CTL) of module proteins overlapped with the Hp-enriched plasma proteome. The statistical significance of changes in module eigenprotein abundance across the three groups of the consensus brain cohort was assessed using ANOVA with Tukey post-hoc correction. Modules with p < 0.05 were considered significant. A The M42 ‘Matrisome’, M26 ‘Acute-phase response’, and M13 ‘RNA-splicing’ displayed increased protein levels in both the AD brain and plasma. B The M1 ‘Synaptic transmission’, M29 ‘Glycosylation/ER’ and M8 ‘Protein transport’ showed decreased protein levels in both AD brain and plasma. C-D The remaining six modules, including M11 ‘Cell adhesion/ECM’, M7 ‘MAPK signaling’, M25 ‘Sugar metabolism’, M39 ‘Translation initiation’, M15 ‘Synaptic vesicle’, and M44 ‘Viral transcription’, exhibited divergent abundance changes in AD brain and plasma. CTL, control; AsymAD, asymptomatic AD; Astro, astrocytes; Micro, microglia; Endo, endothelia

Update of

References

    1. Masters CL, Simms G, Weinman NA, Multhaup G, McDonald BL, Beyreuther K. Amyloid plaque core protein in Alzheimer disease and down syndrome. Proc Natl Acad Sci U S A. 1985;82(12):4245–9. - PMC - PubMed
    1. Long JM, Holtzman DM. Alzheimer disease: an update on pathobiology and treatment strategies. Cell. 2019;179(2):312–39. - PMC - PubMed
    1. Grundke-Iqbal I, Iqbal K, Tung YC, Quinlan M, Wisniewski HM, Binder LI. Abnormal phosphorylation of the microtubule-associated protein tau (tau) in Alzheimer cytoskeletal pathology. Proc Natl Acad Sci U S A. 1986;83(13):4913–7. - PMC - PubMed
    1. Dubois B, Hampel H, Feldman HH, Scheltens P, Aisen P, Andrieu S, et al. Preclinical Alzheimer’s disease: definition, natural history, and diagnostic criteria. Alzheimers Dement. 2016;12(3):292–323. - PMC - PubMed
    1. Hampel H, Hu Y, Cummings J, Mattke S, Iwatsubo T, Nakamura A, et al. Blood-based biomarkers for Alzheimer’s disease: current state and future use in a transformed global healthcare landscape. Neuron. 2023;111(18):2781–99. - PMC - PubMed

LinkOut - more resources