. 2024 Oct 8;13(1):50.
doi: 10.1186/s40035-024-00443-8.

Elevated plasma and CSF neurofilament light chain concentrations are stabilized in response to mutant huntingtin lowering in the brains of Huntington's disease mice

Affiliations

Elevated plasma and CSF neurofilament light chain concentrations are stabilized in response to mutant huntingtin lowering in the brains of Huntington's disease mice

Nicholas S Caron et al. Transl Neurodegener. .

Abstract

Background: Therapeutic approaches aimed at lowering toxic mutant huntingtin (mHTT) levels in the brain can reverse disease phenotypes in animal models of Huntington's disease (HD) and are currently being evaluated in clinical trials. Sensitive and dynamic response biomarkers are needed to assess the efficacy of such candidate therapies. Neurofilament light chain (NfL) is a biomarker of neurodegeneration that increases in cerebrospinal fluid (CSF) and blood with progression of HD. However, it remains unknown whether NfL in biofluids could serve as a response biomarker for assessing the efficacy of disease-modifying therapies for HD.

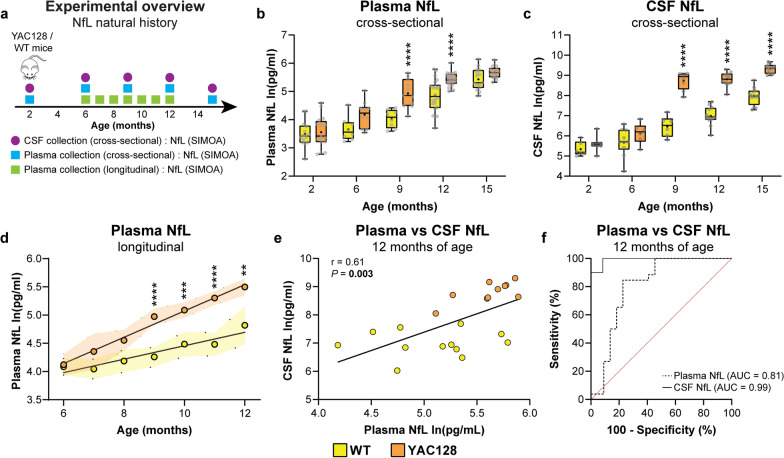
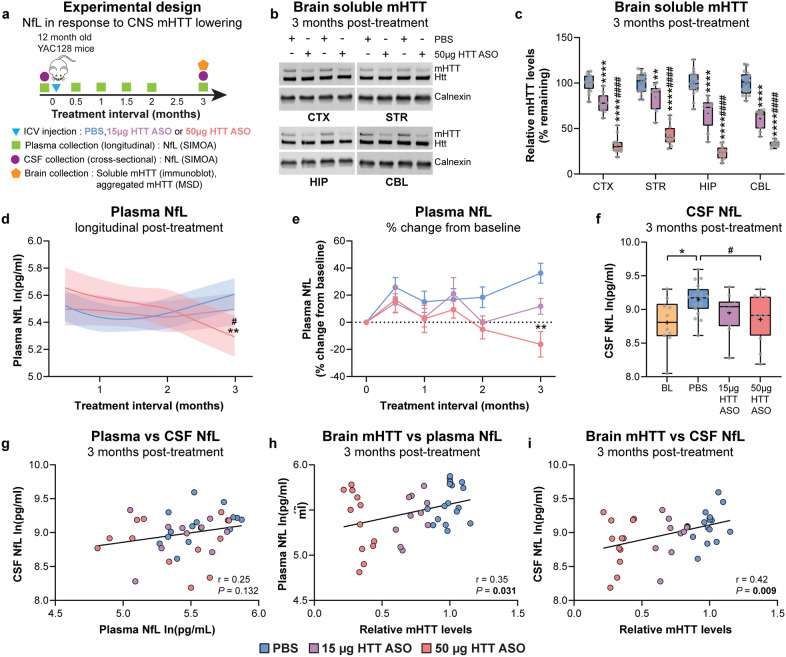
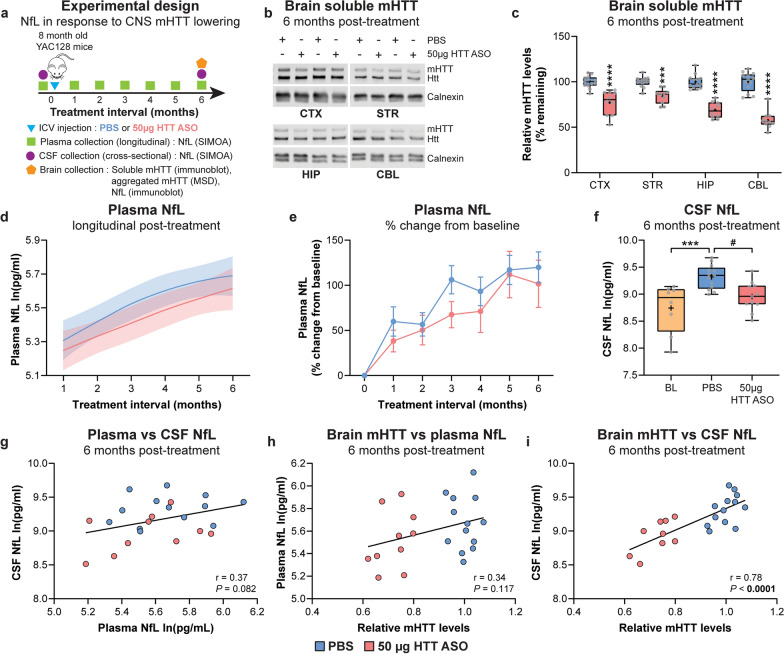
Methods: Longitudinal plasma and cross-sectional CSF samples were collected from the YAC128 transgenic mouse model of HD and wild-type (WT) littermate control mice throughout the natural history of disease. Additionally, biofluids were collected from YAC128 mice following intracerebroventricular administration of an antisense oligonucleotide (ASO) targeting the mutant HTT transgene (HTT ASO), at ages both before and after the onset of disease phenotypes. NfL concentrations in plasma and CSF were quantified using ultrasensitive single-molecule array technology.

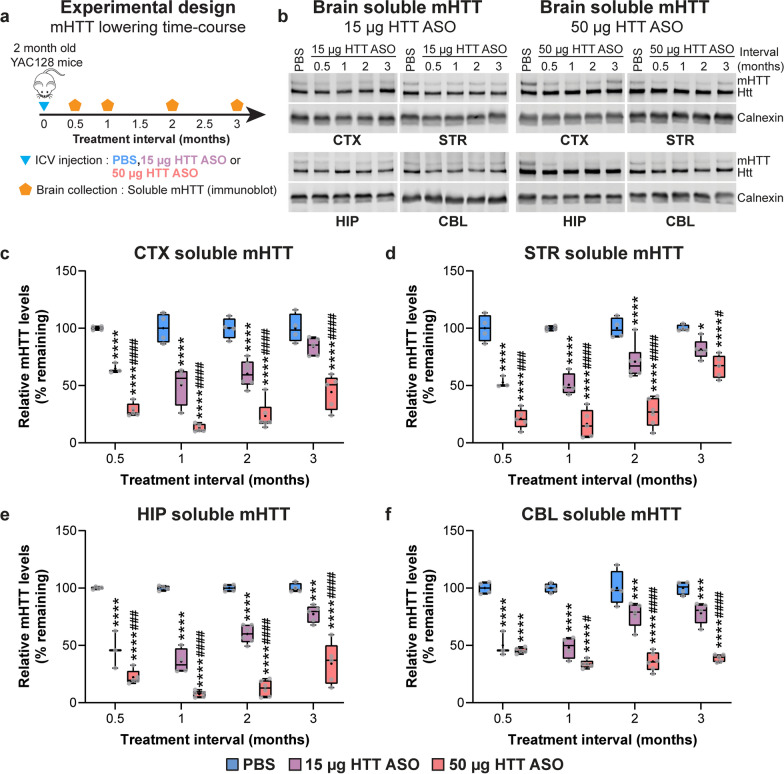
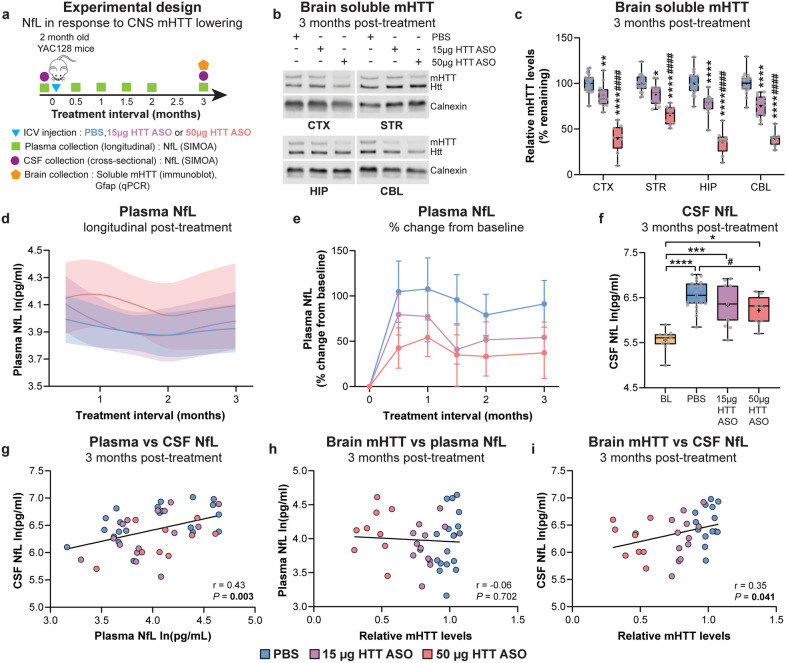
Results: Plasma and CSF NfL concentrations were significantly elevated in YAC128 compared to WT littermate control mice from 9 months of age. Treatment of YAC128 mice with either 15 or 50 µg HTT ASO resulted in a dose-dependent, allele-selective reduction of mHTT throughout the brain at a 3-month interval, which was sustained with high-dose HTT ASO treatment for up to 6 months. Lowering of brain mHTT prior to the onset of regional brain atrophy and HD-like motor deficits in this model had minimal effect on plasma NfL at either dose, but led to a dose-dependent reduction of CSF NfL. In contrast, initiating mHTT lowering in the brain after the onset of neuropathological and behavioural phenotypes in YAC128 mice resulted in a dose-dependent stabilization of NfL increases in both plasma and CSF.

Conclusions: Our data provide evidence that the response of NfL in biofluids is influenced by the magnitude of mHTT lowering in the brain and the timing of intervention, suggesting that NfL may serve as a promising exploratory response biomarker for HD.

Keywords: Antisense oligonucleotide; Biofluids; Cerebrospinal fluid; Huntingtin lowering; Huntington's disease; Neurofilament light chain; Plasma; Response biomarker.


Conflict of interest statement

DJH and PM are paid employees of F. Hoffmann-La Roche. EJW reports grants from CHDI Foundation and European Huntington’s Disease Network. EJW reports consultancy / advisory board memberships with Alnylam, Annexon, Remix Therapeutics, F. Hoffman-La Roche Ltd, Ionis Pharmaceuticals, PTC Therapeutics, Skyhawk Therapeutics, Takeda, Teitur Trophics, Triplet Therapeutics, Uniqure, Wave Life Sciences, and Vico Therapeutics. He is an investigator on the AMT-130 program. All honoraria for these consultancies were paid through the offices of UCL Consultants Ltd., a wholly owned subsidiary of University College London. BRL is a founder and CEO of Incisive Genetics Inc. MRH is the CEO of Prilenia Therapeutics and serves on the public boards of Ionis Pharmaceuticals, Oxford Biomedica, AbCellera and 89bio.

Figures

Fig. 1
Fig. 1
Plasma and CSF NfL concentrations are elevated over the natural history of disease in YAC128 mice. a Schematic diagram of experimental design. b, c Cross-sectional NfL concentrations (natural log pg/ml) in plasma (2 months: n = 14 WT, n = 16 YAC128; 6 months: n = 8 WT, n = 10 YAC128; 9 months: n = 8 WT, n = 11 YAC128; 12 months: n = 22 WT, n = 26 YAC128; 15 months: n = 15 WT, n = 17 YAC128; two-way ANOVA: genotype P < 0.0001, age P < 0.0001, interaction P = 0.008; ****P < 0.0001) and CSF from YAC128 and WT littermate control mice (2 months: n = 6 WT, n = 7 YAC128; 6 months: n = 10 WT, n = 6 YAC128; 9 months: n = 6 WT, n = 8 YAC128; 12 months: n = 12 WT, n = 10 YAC128; 15 months: n = 12 WT, n = 12 YAC128; two-way ANOVA: genotype P < 0.0001, age P < 0.0001, interaction P < 0.0001; ****P < 0.0001). Boxes show the IQR, whiskers extend from the minimum to maximum value, horizontal lines show the median, and crosses show the mean. d Longitudinal plasma NfL concentrations from 6 to 12 months of age in WT and YAC128 mice (WT: n = 21, YAC128: n = 19; mixed-effect analysis: genotype P < 0.0001, age P < 0.0001, genotype × age P < 0.0001; **P = 0.005, ***P = 0.0002, ****P < 0.0001). A linear trend line was fitted to mean values for each genotype and shaded bands denote the 95% CI. e Correlation between NfL concentrations from paired plasma and CSF samples in WT and YAC128 mice at 12 months of age (WT: n = 12, YAC128: n = 10; Pearson’s correlation: r = 0.61, P = 0.003). f ROC curve comparing sensitivity and specificity of plasma NfL (WT: n = 12, YAC128: n = 10. AUC = 0.81, P = 0.0003) and CSF NfL (AUC = 0.99, P = 0.0001) for discriminating between YAC128 and WT mice at 12 months of age. Plasma and CSF NfL concentrations are natural log transformed
Fig. 2
Fig. 2
Acute neurodegeneration in the striatum of YAC128 mice leads to increased plasma and CSF NfL concentrations. a Schematic diagram of the experimental design. b IHC images of Fluoro-Jade C staining in YAC128 mice injected with either PBS (left) or QA (middle) on day 3 after injection. Scale bar, 500 µm. Inset panel shows higher-magnification view of the QA-injected striatum. c Longitudinal plasma NfL concentrations at baseline and on days 3 and 7 after injection with PBS or QA (baseline: n = 6 PBS, n = 8 QA; 3 days: n = 3 PBS, n = 4 QA; 7 days: n = 3 PBS, n = 4 QA; two-way ANOVA: treatment P = 0.005, interval P < 0.0001, interaction P = 0.093; **P = 0.007). Boxes show the IQR, whiskers extend from minimum to maximum values, horizontal lines show the median, and crosses show the mean. d Percent change of plasma NfL concentrations from baseline for each animal at 3 and 7 days post-injection with PBS or QA (two-way ANOVA: treatment P = 0.037, interval P = 0.024, interaction P = 0.093; *P = 0.026). Symbols show the mean and error bars represent SEM. e Cross-sectional CSF concentrations on days 3 and 7 after injection with PBS or QA (3 days: n = 3 PBS, n = 4 QA; 7 days: n = 3 PBS, n = 3 QA; two-way ANOVA: treatment P = 0.0003, interval P < 0.0001, interaction P = 0.176; *P = 0.040, **P = 0.001). f Correlation between NfL concentrations from paired plasma and CSF samples on days 3 and 7 post-injection with PBS (Pearson’s correlation: r =  − 0.37, P = 0.469) or QA (Pearson’s correlation: r =  − 0.87, P = 0.011). g, h Relative Nefl expression (3 days: n = 3 PBS, n = 4 QA; 7 days: n = 3 PBS, n = 4 QA; two-way ANOVA: treatment P < 0.0001, interval P = 0.403, interaction P = 0.394; ***P = 0.0003, ****P < 0.0001) and NfL protein level (3 days: n = 4 PBS, n = 4 QA; 7 days: n = 4 PBS, n = 4 QA. Two-way ANOVA: treatment P = 0.001, interval P = 0.603, interaction P = 0.279. **P = 0.005) in the injected striatum following unilateral intrastriatal injection of PBS or QA. Fold changes are presented relative to PBS values at day 3 post-QA injection. Plasma and CSF NfL concentrations are natural log transformed
Fig. 3
Fig. 3
Sustained, dose-dependent lowering of mHTT in the brains of YAC128 mice with HTT ASO treatment. a Schematic diagram of experimental design (0.5-month interval: n = 4 PBS, n = 3 15 µg HTT ASO, n = 5 50 µg HTT ASO; 1-month interval: n = 4 PBS, n = 4 15 µg HTT ASO, n = 5 50 µg HTT ASO; 2-month interval: n = 4 PBS, n = 6 15 µg HTT ASO, n = 6 50 µg HTT ASO; 3-month interval: n = 4 PBS, n = 5 15 µg HTT ASO, n = 5 50 µg HTT ASO). b Representative immunoblots from brain lysates of YAC128 mice treated at 2 months of age with either PBS, 15 µg HTT ASO (left panel) or 50 µg HTT ASO (right panel), collected at intervals up to 3 months post-treatment. cf Quantification of soluble mHTT levels in the (c) cortex (Two-way ANOVA: treatment P < 0.0001, interval P < 0.0001, interaction P = 0.0319; ****P < 0.0001 vs PBS; ####P < 0.0001 vs 15 µg HTT ASO), (d) striatum (Two-way ANOVA: treatment P < 0.0001, interval P < 0.0001, interaction P < 0.0001; *P = 0.018, ****P < 0.0001 vs PBS; #P = 0.046, ###P = 0.0001, ####P < 0.0001 vs 15 µg HTT ASO), (e) hippocampus (two-way ANOVA: treatment P < 0.0001, interval P < 0.0001, interaction P < 0.0001; ***P = 0.0005, ****P < 0.0001 vs PBS; ###P = 0.0007, ####P < 0.0001 vs 15 µg HTT ASO), and (f) cerebellum (two-way ANOVA: treatment P < 0.0001, interval P = 0.0006, interaction P < 0.0001; ***P = 0.0001, ****P < 0.0001 vs PBS; #P = 0.017, ####P < 0.0001 vs 15 µg HTT ASO). Levels of mHTT in all brain regions are normalized to PBS values at each respective time point. Boxes show the IQR, whiskers extend from minimum to maximum values, horizontal lines show the median, and crosses show the mean
Fig. 4
Fig. 4
Lowering mHTT in the brains of YAC128 mice prior to motor deficits and regional forebrain atrophy leads to a reduction of CSF NfL concentration. a Schematic diagram of the experimental design. b, c Representative immunoblots and quantification of soluble mHTT levels in the CTX, STR, HIP and CBL of YAC128 mice treated at 2 months of age with either PBS, 15 µg HTT ASO or 50 µg HTT ASO, and assessed 3 months post-treatment (PBS: n = 17; 15 µg HTT ASO: n = 10; 50 µg HTT ASO: n = 12; two-way ANOVA: treatment P < 0.0001, brain region P < 0.0001, interaction P = 0.0001; *P = 0.013, **P = 0.006, ****P < 0.0001 vs PBS; ###P = 0.0007, ####P < 0.0001 vs 15 µg HTT ASO). Levels of mHTT are normalized to PBS values. Boxes show the IQR, whiskers extend from minimum to maximum values, horizontal lines show the median, and crosses show the mean. d Longitudinal plasma NfL concentrations following treatment with PBS, 15 µg HTT ASO or 50 µg HTT ASO (PBS: n = 29; 15 µg HTT ASO: n = 20; 50 µg HTT ASO: n = 13; linear mixed-effects model: treatment P = 0.151, treatment × time P = 0.983). Models were adjusted for time from treatment and baseline NfL concentrations for each treatment condition, and fitted with a cubic spline. Solid lines denote the mean and shaded bands denote the 95% CI for each treatment condition. e Percent change in longitudinal plasma NfL concentrations from baseline for each animal at multiple time points (mixed-effects model: treatment P = 0.190, time P = 0.396, treatment × time P = 0.998). Symbols show the mean and error bars represent SEM. f Cross-sectional CSF NfL concentrations in YAC128 mice at 2 months of age (baseline, BL) and 3 months post-treatment with either PBS, 15 µg HTT ASO or 50 µg HTT ASO (BL: n = 10; PBS: n = 23; 15 µg HTT ASO: n = 15; 50 µg HTT ASO: n = 9; one-way ANOVA: P < 0.0001; *P = 0.029, ***P = 0.0004, ****P < 0.0001; #P = 0.043. Linear regression: Y = -0.0068X + 6.520, R2 = 0.12, P = 0.0161). g Correlation between NfL concentrations from paired plasma and CSF samples (Pearson’s correlation: r = 0.43, P = 0.003). h, i Correlations between whole-brain mHTT level (mean mHTT from all brain regions for each animal) and (h) plasma (Pearson’s correlation: r = -0.06, P = 0.702) or (i) CSF NfL (Pearson’s correlation: r = 0.35, P = 0.041) from the same animal at 3 months post-treatment with PBS, 15 µg HTT ASO or 50 µg HTT ASO. Plasma and CSF NfL concentrations are natural log transformed
Fig. 5
Fig. 5
Plasma and CSF NfL concentrations are stabilized in response to mHTT lowering in the brain initiated after striatal neuron loss in YAC128 mice. a Schematic diagram of experimental design. b, c Representative immunoblots and quantification of soluble mHTT levels in the CTX, STR, HIP and CBL of YAC128 mice treated at 12 months of age with either PBS, 15 µg HTT ASO or 50 µg HTT ASO, and assessed 3 months post-treatment (PBS: n = 17; 15 µg HTT ASO: n = 10; 50 µg HTT ASO: n = 12; two-way ANOVA: treatment P < 0.0001, brain region P < 0.0001, interaction P = 0.0009; **P = 0.002, ****P < 0.0001 vs PBS; ####P < 0.0001 vs 15 µg HTT ASO). Levels of mHTT are normalized to PBS values. Boxes show the IQR, whiskers extend from minimum to maximum values, horizontal lines show the median, and crosses show the mean. d Longitudinal plasma NfL concentrations following treatment of YAC128 mice with PBS, 15 µg HTT ASO or 50 µg HTT ASO (PBS: n = 20; 15 µg HTT ASO: n = 20; 50 µg HTT ASO: n = 12; linear mixed-effects model: treatment P = 0.790, treatment × time interaction P = 0.001; **P = 0.002 vs PBS; #P = 0.042 vs 15 µg HTT ASO). Models were adjusted for time from treatment and baseline NfL concentrations for each treatment condition, and fitted with a cubic spline. Solid lines denote the mean and shaded bands denote the 95% CI for each treatment condition. e Percent change in longitudinal plasma NfL concentrations from baseline for each animal at multiple intervals following treatment with PBS, or 15 µg or 50 µg HTT ASO (Mixed-effects model: treatment P = 0.057, time P = 0.039, treatment × time P = 0.015. **P = 0.003). Symbols show the mean and error bars represent SEM. f Cross-sectional CSF NfL concentrations in YAC128 mice at 12 months of age (BL) and 3 months post-treatment with either PBS, 15 µg HTT ASO or 50 µg HTT ASO (BL: n = 10; PBS: n = 19; 15 µg HTT ASO: n = 10; 50 µg HTT ASO: n = 12. One-way ANOVA: P = 0.014; *P = 0.027; #P = 0.046; linear regression: Y = -0.0057X + 9.117, R2 = 0.16, P = 0.011). g Correlation between NfL concentrations from paired plasma and CSF samples (Pearson’s correlation: r = 0.25, P = 0.132). h, i Correlations between whole-brain mHTT level (mean mHTT from all brain regions for each animal) and (h) plasma (Pearson’s correlation: r = 0.35, P = 0.031) or (i) CSF NfL (Pearson’s correlation: r = 0.42, P = 0.009) from the same animal at 3 months post-treatment with PBS, 15 µg HTT ASO or 50 µg HTT ASO. Plasma and CSF NfL concentrations are natural log transformed
Fig. 6
Fig. 6
Sustained reduction of mHTT in the brains of YAC128 mice initiated prior to overt striatal neuron loss stabilizes increases of plasma and CSF NfL. a Schematic diagram of experimental design. b, c Representative immunoblots and quantification of relative soluble mHTT levels in the CTX, STR, HIP and CBL of YAC128 mice treated at 8 months of age with either PBS or 50 µg HTT ASO, and assessed 6 months post-treatment (PBS: n = 13; 50 µg HTT ASO: n = 10; two-way ANOVA: treatment P < 0.0001, brain region P < 0.0001, interaction P < 0.0001; ***P = 0.0003, ****P < 0.0001). Levels of mHTT are normalized to PBS values for each brain region. Boxes show the IQR, whiskers extend from minimum to maximum values, horizontal lines show the median, and crosses show the mean. d Longitudinal plasma NfL concentrations following treatment with either PBS or 50 µg HTT ASO (PBS: n = 13; 50 µg HTT ASO: n = 13; linear mixed-effects model: treatment P = 0.056, treatment × time interaction P = 0.934). Models were adjusted for time from treatment and baseline NfL concentrations for each treatment condition, and fitted with a cubic spline. Solid lines denote the mean and shaded bands denote 95% CI for each treatment condition. e Percent change in longitudinal plasma NfL concentrations from baseline at different intervals following treatment with either PBS or 50 µg HTT ASO (Mixed-effects model: treatment P = 0.411, time P < 0.0001, treatment × time P = 0.565). Symbols show the mean and error bars represent SEM. f Cross-sectional CSF NfL concentrations at 8 months of age (BL) and 6 months post-treatment with either PBS or 50 µg HTT ASO (BL: n = 8; PBS: n = 13; 50 µg HTT ASO: n = 11. One-way ANOVA: P = 0.0007; ***P = 0.0007; #P = 0.020). g Correlation between NfL concentrations from paired plasma and CSF samples (Pearson’s correlation: r = 0.37, P = 0.082). h, i Correlations between the whole-brain mHTT level (mean mHTT from all brain regions for each animal) and (h) plasma (Pearson’s correlation: r = 0.34, P = 0.117) or (i) CSF NfL (Pearson’s correlation: r = 0.78, P < 0.0001) from the same animal at 6 months post-treatment with PBS or 50 µg HTT ASO. Plasma and CSF NfL concentrations are natural log transformed

References

    1. MacDonald ME, Ambrose CM, Duyao MP, Myers RH, Lin C, Srinidhi L, et al. A novel gene containing a trinucleotide repeat that is expanded and unstable on Huntington’s disease chromosomes. The Huntington’s Disease Collaborative Research Group. Cell. 1993;72(6):971–83. - PubMed
    1. Caron NS, Dorsey ER, Hayden MR. Therapeutic approaches to Huntington disease: from the bench to the clinic. Nat Rev Drug Discov. 2018;17(10):729–50. - PubMed
    1. Deng YP, Albin RL, Penney JB, Young AB, Anderson KD, Reiner A. Differential loss of striatal projection systems in Huntington’s disease: a quantitative immunohistochemical study. J Chem Neuroanat. 2004;27(3):143–64. - PubMed
    1. Reiner A, Albin RL, Anderson KD, D’Amato CJ, Penney JB, Young AB. Differential loss of striatal projection neurons in Huntington disease. Proc Natl Acad Sci U S A. 1988;85(15):5733–7. - PMC - PubMed
    1. Glass M, Dragunow M, Faull RL. The pattern of neurodegeneration in Huntington’s disease: a comparative study of cannabinoid, dopamine, adenosine and GABA(A) receptor alterations in the human basal ganglia in Huntington’s disease. Neuroscience. 2000;97(3):505–19. - PubMed

Publication types

LinkOut - more resources