. 2024 Oct 8;22(1):481.
doi: 10.1186/s12964-024-01858-6.

Elucidating the power of arginine restriction: taming type I interferon response in breast cancer via selective autophagy

Affiliations

Elucidating the power of arginine restriction: taming type I interferon response in breast cancer via selective autophagy

Apsana Lamsal et al. Cell Commun Signal. .

Abstract

Background: Type I interferons (IFN-I) are potent alarm factors that initiate cancer cell elimination within tumors by the immune system. This critical immune response is often suppressed in aggressive tumors, thereby facilitating cancer immune escape and unfavorable patient outcome. The mechanisms underpinning IFN-I suppression in tumors are incompletely understood. Arginase-1 (ARG1)-expressing immune cells that infiltrate tumors can restrict arginine availability by ARG1-mediated arginine degradation. We hypothesized that arginine restriction suppresses the IFN-I response in tumors.

Methods: Comprehensive, unbiased open approach omics analyses, various in vitro techniques, including microscopy, qPCR, immunoblotting, knock-down experiments, and flow cytometry were employed, as well as ex vivo analysis of tumor tissue from mice. Several functional bioassays were utilized to assess metabolic functions and autophagy activity in cancer cells.

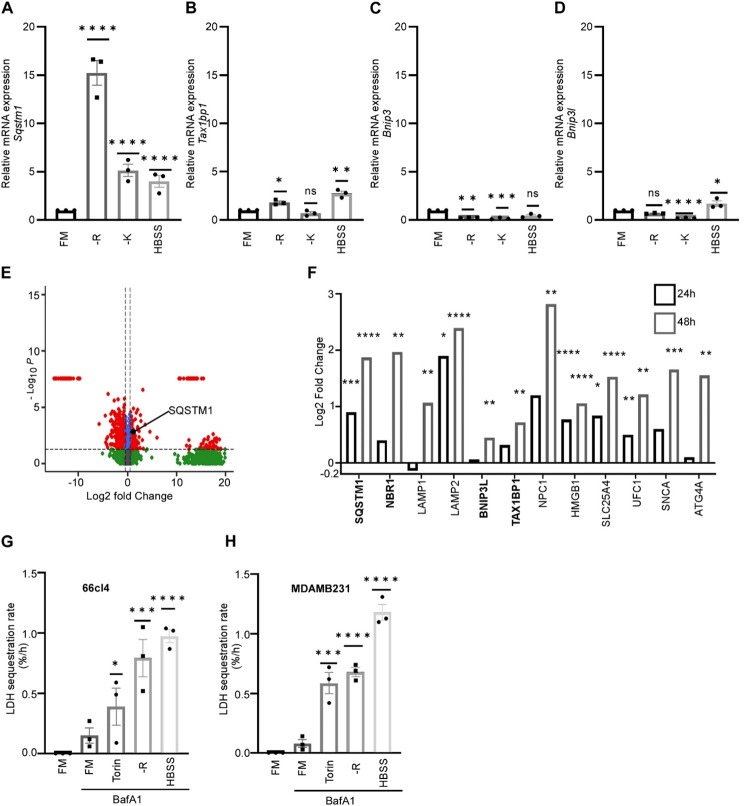
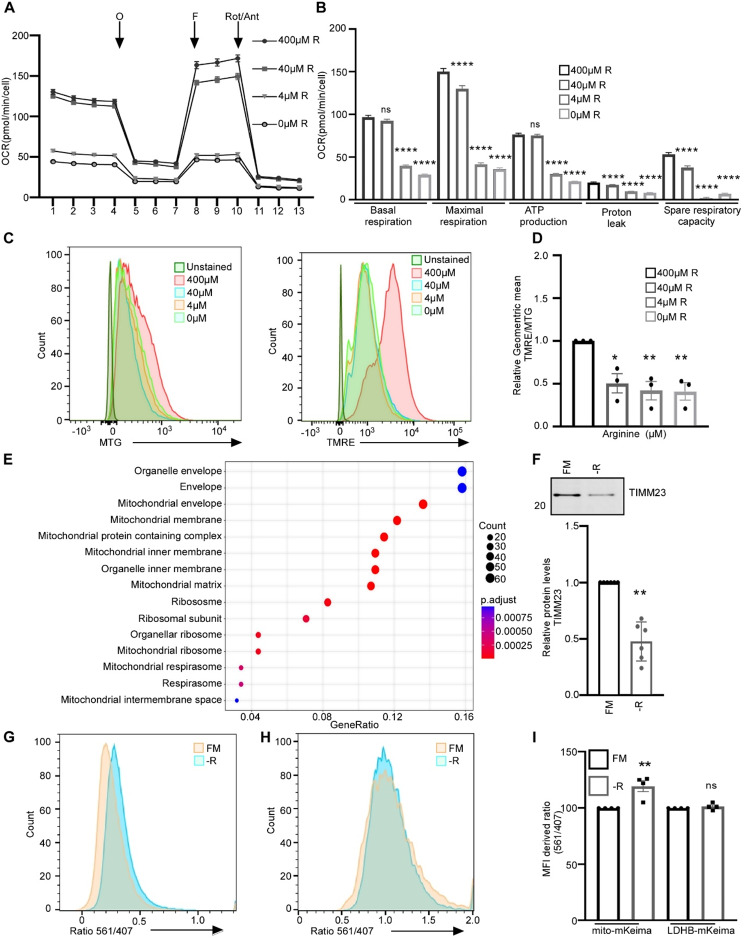
Results: Arginine restriction potently induced expression of selective autophagy receptors, enhanced bulk and selective autophagy and strongly suppressed the IFN-I response in cancer cells in an autophagy-dependent manner.

Conclusion: Our study proposes a mechanism for how tumor-infiltrating immune cells can promote cancer immune escape by dampening the IFN-I response. We suggest ARG1 and autophagy as putative therapeutic targets to activate the IFN-I response in tumors.


Conflict of interest statement

The authors declare no competing interests.

Figures

Fig. 1
Fig. 1
Low arginine abundance dampened IFN-I response in aggressive cancer cells. (A) Arginase 1 (ARG1) protein expression in 66cl4 tumors (N = 6) relative to 67NR tumors (N = 5) determined by mass spectrometry (MS) analysis. (B) 66cl4 cells were grown for 48 h in full medium (400 µM arginine) or without arginine, and protein extracts were analyzed by MS. Gene ontology (GO) functional enrichment analyses of biological processes (BP) for proteins with a reduced expression in arginine-starved cells (N = 6) relative to controls (N = 5). mod: modification, pos: positive, reg: regulation, neg: negative. (C) Downregulated IFN-I-related proteins, determined by MS analysis, in 66cl4 cells grown without arginine (-R) for 48 h (N = 6) or 24 h (N = 6) relative to full medium. For MS analysis, statistical significance was evaluated using student’s t-test corrected using Benjamini-Hochberg. *p < 0.05, ** p < 0.01, *** p < 0.001 and **** p < 0.0001
Fig. 2
Fig. 2
Arginine starvation reduced the abundance of micronuclei in aggressive breast cancer cells. (A) Representative immunofluorescence staining of micronuclei in MDAMB231 cells grown in full medium (FM) with 400 µM or no arginine (-R) for 24 h and 48 h. The cells were stained with cGAS (green), and Lamin A (red) antibodies and DNA was stained with Hoechst 33342 (blue). cGAS-positive micronuclei are highlighted by yellow arrows. Scale bar: 50 μm on the left and 5 μm on the selected cells within the yellow box. (B) Percentage of cells with micronuclei. (C) Number of micronuclei per micronucleated cell and (D) cGAS-positive micronuclei per micronucleated cell calculated from three independent experiments (N ≥ 300 cells per experiment). Bars represent mean ± SEM (*p < 0.05, **p < 0.01, one-way ANOVA, Dunnett’s multiple comparison). (E) Representative cGAS, pIRF3 and IFIT3 immunoblots of protein extracts from MDAMB231 cells grown for 48 h in arginine deficient medium relative to cells grown in full medium (400 µM arginine). (F-H) Quantification of cGAS (F), pIRF3 (G) and IFIT3 (H) protein levels. Total protein staining was used as loading control (Fig.S5). Bars represent mean ± SEM relative to full medium (N = 6 (cGAS and IFIT3), N = 4 (pIRF3), *p < 0.05, one sample t-test after log transformation)
Fig. 3
Fig. 3
Arginine starvation induced selective autophagy receptors and stimulated autophagic flux. The mRNA level of the selective autophagy receptors Sqstm1 (A), Tax1bp1 (B), Bnip3 (C) and Bnip3l (D) were analyzed in 66cl4 cells grown for 24 h in medium deficient of either arginine (-R), lysine (-K), or all amino acids (HBSS) as compared to full medium (FM). β-Actin was used as a housekeeping gene. Bars represent means ± SEM, one-way ANOVA, Dunnett’s multiple comparison test, after log transformation. (E) Volcano plot depicting differentially expressed proteins in 66cl4 cells grown in arginine deficient medium for 24 h relative to cells grown in full medium (400 µM arginine) (log2FC ± 0.5, p < 0.05). (F) Upregulated autophagy related proteins (autophagy receptors in bold) in 66cl4 cells grown in arginine deficient medium for 24 h (N = 6) and 48 h (N = 5) relative to full medium (400µM arginine) from MS analysis. Statistical significance was evaluated using student’s t-test corrected using Benjamini-Hochberg. (G and H) 66cl4 cells (G) or MDAMB231 cells (H) were grown either in full medium (FM), medium without arginine (-R) or in full amino acid starvation (HBSS) for 24 h, or in FM with Torin (overnight). The cells were treated with BafA1 (last 3 h) as indicated. LDH sequestration was determined at 21–24 h. Statistical significance was evaluated using repeated measures one-way ANOVA. For all bars: *p < 0.05, ** p < 0.01, *** p < 0.001 and **** p < 0.0001
Fig. 4
Fig. 4
Micronuclei attracted autophagic machinery upon arginine restriction. Super resolution immunofluorescence staining of micronuclei in MDAMB231 cells grown in full medium (FM) with 400 µM (A) or no arginine (-R) for 24 h (B and C). The cells were stained with antibodies for cGAS (green), LC3B (grey) and SQSTM1 (magenta), and DNA was stained with Hoechst 33342 (blue). cGAS positive micronuclei are zoomed below the merged channels where merged channels, DNA/LC3B/SQSTM1 and finally only LC3B/SQSTM1 are shown, respectively. The image in (B) shows SQSTM1 and LC3B puncta around micronuclei and (C) shows micronuclei enclosed into LC3B positive puncta. Scale bar 5 μm for the overview panels and 1 μm for the zoomed panels. (D) Number of LC3B puncta at cGAS positive micronuclei. Black dots represent number of LC3 puncta and blue dots represent the relative fold change in each experiment from three independent experiments (N ≥ 30 cGAS positive micronuclei counted per experiment). Bars represent mean ± SEM (*p < 0.05, one sample t-test). (E-F) Normalized mean fluorescent intensity (MFI) (a.u.) of LC3B (E) and SQSTM1 (F) puncta around cGAS positive micronuclei calculated from three independent experiments (N ≥ 30 cGAS positive micronuclei counted per experiment). Black dots represent individual MFI of both LC3B and SQSTM1 puncta and blue dots represent the relative fold change in each experiment. Bars represent mean ± SEM (*p < 0.05, one sample t-test)
Fig. 5
Fig. 5
Arginine starvation caused impaired function and increased turnover of mitochondria. (A) Mito stress tests (Seahorse XF96 Analyzer) evaluating mitochondrial function of 66cl4 cells grown for 24 h in various arginine (R) concentration (N = 3, > 10 wells/condition). Oxygen consumption rate (OCR) before (basally) and after injections of oligomycin (O), FCCP (F) and rotenone/antimycin A (Rot/Ant) (mean ± SEM). (B) Basal OCR, proton leak, ATP production and spare respiratory capacity (SRC) (N = 3) (mean ± SEM, ANOVA, Dunnett’s multiple comparison test). Calculations based on (A). (C) Representative histograms from flow cytometry of 66cl4 cells grown in various arginine concentrations (24 h), stained with mitotracker green (MTG) or tetramethylrhodamine ethyl ester perchlorate (TMRE). (D) TMRE/MTG ratio in 66cl4 after growth in various arginine concentrations (24 h) (mean ± SEM, ANOVA, after log transformation, Dunnett’s multiple comparison test). (E) Gene ontology functional enrichment analyses of cellular components of proteins with reduced expression in 66cl4 cells grown in arginine deficient medium (N = 6) relative to full medium (400µM arginine, N = 5) (48 h). (F) Representative TIMM23 immunoblot and quantification (N = 6) from MDAMB231 cells grown in arginine deficient medium (-R) relative to full medium (FM, 400 µM arginine) (48 h) (mean ± SEM, one sample t-test after log transformation). Total protein staining used as loading control is shown in Fig. S5. (G-H) MDAMB231 cells expressing mito-mKeima (G) or LDHB-mKeima (H) grown with 400µM arginine (full medium, FM) or no arginine (-R) (48 h). Representative histograms of the signal ratio by excitation at 561 and 407 nm are shown. (I) Average median ratio for signals by excitation at 561 and 407 nm in MDAMB231 cells expressing mito-mKeima or LDHB-mKeima grown in 400 µM arginine (full medium, FM) or without arginine (-R) (48 h) (mean ± SEM, One way ANOVA, after log transformation, Dunnett’s multiple comparison test). Values for control cells were set to 100. For all bars: *p < 0.05, ** p < 0.01, *** p < 0.001 and **** p < 0.0001
Fig. 6
Fig. 6
Autophagy negatively regulated the IFN-I response. (A) Representative immunoblots stained for SQSTM1, TAX1BP1 and ATG13 using protein extracts from MDAMB231 cells treated with siRNAs targeting SQSTM1, TAX1BP1 and ATG13, relative to non-targeting (NT) siRNA, demonstrating the efficiency of the various siRNAs. (B) Quantification of SQSTM1, TAX1BP1 and ATG13 protein level in siRNA treated MDAMB231 cells using total protein staining as loading control (Fig. S5). Bars represent mean ± SEM relative to NT siRNA (N ≥ 3, one sample t-test after log transformation). (C) Representative IFIT3 and pIRF3 immunoblots of protein extracts from MDAMB231 cells treated with siRNAs targeting SQSTM1, TAX1BP1 and ATG13, relative to NT siRNA. (D) Quantification of IFIT3 protein level in MDAMB231 cells after siRNA treatment, using total protein staining as loading control (Fig. S5). Bars represent mean ± SEM relative to NT siRNA (N ≥ 3, one sample t-test after log transformation). (E) Quantification of pIRF3 protein level in MDAMB231 cells after siRNA treatment, using total protein staining as loading control. Bars represent mean ± SEM relative to NT siRNA (N ≥ 3, one sample t-test after log transformation). (F) Representative IFIT3 and pIRF3 immunoblots of protein extracts from MDAMB231 cells treated with siRNAs targeting SQSTM1, TAX1BP1 and ATG13, relative to NT siRNA followed by cultivation with arginine (+ R; 400 µM arginine) or without arginine (-R) for 48 h post transfection. (G) Quantification of IFIT3 protein level in siRNA-treated MDAMB231 cells grown with (+ R) or without (-R) arginine for 48 h post transfection, using total protein staining as loading control (Fig. S5). Bars represent mean ± SEM relative to NT siRNA (N ≥ 3, one way ANOVA, Dunnett’s multiple comparison test, after log transformation). (H) Quantification of pIRF3 protein level, as described for IFIT3 in (G). (I) Representative LC3B immunoblot of protein extracts from MDAMB231 cells treated with NT siRNA or siRNAs targeting SQSTM1, TAX1BP1 and ATG13, with or without bafilomycin A1 (100 nM, 6 h) as indicated. (J) Quantification of LC3B-II protein level in MDAMB231 cells after siRNA and bafilomycin A1 treatment, using total protein staining as loading control (Fig. S5). Bars represent mean ± SEM for bafilomycin A treatment relative to control for each respective siRNA (N = 4, one way ANOVA, Tukey’s multiple comparison test, after log transformation). For all bars: *p < 0.05, ** p < 0.01, *** p < 0.001 and **** p < 0.0001. For all blots: Images originate from the same blot, but lanes are re-arranged as indicated by dotted lines

References

    1. Jin Z, Sun X, Wang Y, Zhou C, Yang H, Zhou S. Regulation of autophagy fires up the cold tumor microenvironment to improve cancer immunotherapy. Front Immunol. 2022;13:1018903. - PMC - PubMed
    1. Sadeghi Rad H, Monkman J, Warkiani ME, Ladwa R, O’Byrne K, Rezaei N, et al. Understanding the tumor microenvironment for effective immunotherapy. Med Res Rev. 2021;41(3):1474–98. - PMC - PubMed
    1. Greten FR, Grivennikov SI. Inflammation and Cancer: triggers, mechanisms, and consequences. Immunity. 2019;51(1):27–41. - PMC - PubMed
    1. Boukhaled GM, Harding S, Brooks DG. Opposing roles of type I interferons in Cancer Immunity. Annu Rev Pathol. 2021;16:167–98. - PMC - PubMed
    1. Budhwani M, Mazzieri R, Dolcetti R. Plasticity of type I Interferon-mediated responses in Cancer Therapy: from anti-tumor immunity to resistance. Front Oncol. 2018;8:322. - PMC - PubMed