. 2024 Dec;13(30):e2401936.
doi: 10.1002/adhm.202401936. Epub 2024 Oct 9.

Prodrug Nanomedicine for Synovium Targeted Therapy of Inflammatory Arthritis: Insights from Animal Model and Human Synovial Joint Fluid

Affiliations

Prodrug Nanomedicine for Synovium Targeted Therapy of Inflammatory Arthritis: Insights from Animal Model and Human Synovial Joint Fluid

Zeynab Nosrati et al. Adv Healthc Mater. 2024 Dec.

Abstract

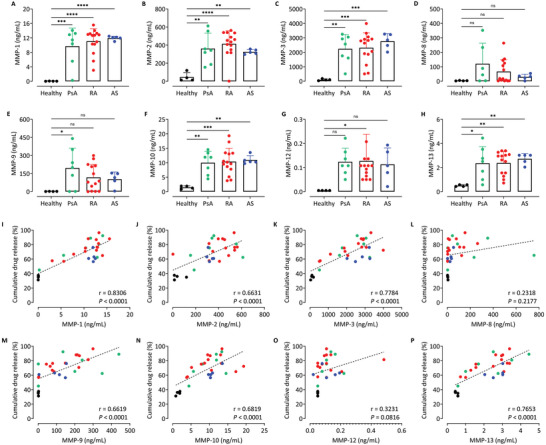
Many patients cannot tolerate low-dose weekly methotrexate (MTX) therapy for inflammatory arthritis treatment due to life-threatening toxicity. Although biologics offer a target-specific therapy, it raises the risk of serious infections and even cancer due to immune system suppression. We introduce an anti-inflammatory arthritis MTX ester prodrug using a long-circulating biocompatible polymeric macromolecule: folic acid (FA) functionalized hyperbranched polyglycerol (HPG). In vitro the drug MTX is incrementally released through pH and enzymatic degradation over 2 weeks. The role of matrix metalloproteinases (MMPs) in site-specific prodrug activation was verified using synovial fluid (SF) of 26 rheumatology patients and 4 healthy controls. Elevated levels of specific MMPs-markers of joint inflammation-positively correlated with enhanced prodrug release explained by acid-catalyzed hydrolysis of esters by proteases. Intravenously administered 111In-radiolabeled prodrug confirmed by SPECT/CT imaging that it accumulated preferentially in inflamed joints while reducing off-target side-effects in a mouse model of rheumatoid arthritis (RA). Added FA as a targeting vector prolonged prodrug action; prodrug with 4x less MTX applied every 2 weeks was as effective as weekly MTX therapy. The preclinical results suggest a prodrug-based strategy for the treatment of inflammatory joint diseases, with potential for other chronic inflammatory diseases and cancer.

Keywords: drug delivery system; methotrexate; polymer; prodrug; synovial fluid.


Conflict of interest statement

The authors declare no conflict of interest.

Figures

Figure 1
Figure 1
Preparation and characterization of a macromolecular prodrug platform for targeted delivery. A) Schematic representation of a long‐circulating polymeric prodrug designed for targeted therapy in inflammatory arthritis. The drug is only activated in inflamed joints due to the presence of low pH and enzymes such as metalloproteinases or esterases. Chemical structure of the macromolecular prodrug HPG‐FA‐MTX with FA in purple, MTX in orange, and PEG in dark red. B) Size distribution of HPG‐FA and HPG‐FA‐MTX measured by DLS analysis. C) UV–vis spectra of MTX prodrugs. HPG and HPG‐FA (1:19 and 1:57) before (solid line) and after (dashed line) MTX loading. Black arrow shows the absorbance of MTX at 390 nm. D) Cellular uptake analysis by confocal microscopy. LPS‐stimulated RAW 264.7 cells were exposed to either A647‐HPG, A647‐HPG complexes loaded with different FA molar ratios, or free Alexa 647 for 6 h. Nanoparticles were conjugated to Alexa Fluor 647 (red). Nucleus and cell membrane were stained with Hoechst 33 342 (blue) and LysoTracker™ Green DND‐26 (green), respectively. E) Quantification of red fluorescent intensities of cells (6 cells were counted in each case) (n = 3). Values are expressed as mean + SE. *p < 0.05, **p < 0.001, and ****p < 0.000001.
Figure 2
Figure 2
In vitro drug release study in response to environmental stimuli and joint synovial fluid. A,B) Release profiles of MTX from HPG conjugates under physiological (pH 7.4) and acidic (pH 5.6) conditions. C) Area under the cumulative release curves of A and B. Release of free MTX was used as a control. D,E) MTX‐released profiles from HPG and HPG‐FA in PBS with or without different concentrations of esterase (porcine liver esterase). F) Area under the cumulative release curves of D and E. HPG‐MTX conjugates show dose‐response relationship between enzyme concentration and MTX release (*p < 0.05). G) Release profiles of MTX from HPG‐FA after incubating with SF of individual patients with RA (n = 14), PsA (n = 7), and AS (n = 5), and pooled SF of healthy donors (n = 3). H) Area under the cumulative release curves of G. PBS was used as a control. I,J) In vitro release of MTX from HPG, and HPG‐FA polymeric conjugates, incubated with individual RA synovial joint fluid (n = 3) in the presence and absence of MMP‐inhibitor GM 6001. K) Free MTX was used as a control. L) Area under the cumulative release curves of I, J, and K. Experiment performed in triplicate and data are presented as means ± SD. Comparisons were done with unpaired Student's t‐test and one‐way ANOVA followed by Turkey's multiple comparison and expressed as ns: P > 0.05, *p < 0.05, **p < 0.001, ***p < 0.0001, ****p < 0.00001.
Figure 3
Figure 3
Overexpression of matrix metalloproteases within inflamed joint fluids enhances the site‐specific drug delivery in IA. A–H) Scatter plot showing the level of MMP‐1, MMP‐2, MMP‐3, MMP 8, MMP‐9, MMP‐10, MMP‐12, and MMP‐13 in SF of individual patients with RA (n = 14), PsA (n = 7), and AS (n = 5), and healthy donors (n = 4). I–P) Correlation between cumulative drug release after two weeks of incubation and MMP levels in SF of the same individual patients and healthy donors. Experiment performed in triplicate and data are presented as means ± SD. Comparisons were done with unpaired Student's t‐test and expressed as ns: > 0.05, *p < 0.05, **p < 0.001, ***p < 0.0001, ****p < 0.00001.
Figure 4
Figure 4
Folic acid‐targeted macromolecules assessed in CIA mice have a favorable biodistribution with high joint uptake. A–C) Representative SPECT/CT imaging after administration of 111In‐HPG and 111In‐HPG‐FA in CIA mice, and 111In‐HPG‐FA in healthy mice (n = 3). D) Heart SUV, E) knees, and F) hind paws time‐activity curves after intravenous administration of targeting and non‐targeting macromolecules in CIA and healthy mice. G) Area under the time activity curves of E to F. H,I) Representative SPECT/CT imaging after administration of 111In‐HPG‐MTX and 111In‐HPG‐FA‐MTX in CIA mice (n = 4). J) Knees, K) hind, and L) front paws time‐activity curves after intravenous administration of targeting and non‐targeting macromolecule MTX prodrugs in CIA mice. M) Area under the time activity curves of J to L. Data are presented as means ± SD. Comparisons were done with unpaired Student's t‐test and expressed ns: > 0.05, *p < 0.05, **p < 0.001, ***p < 0.0001, ****p < 0.00001.
Figure 5
Figure 5
Ex vivo biodistribution and kinetic profiles of 111In‐radiolabeled macromolecular [3H]MTX conjugates for simultaneous quantification of MTX drug and macromolecular vehicle in CIA mice. A–C) The kinetic profile of 3H and 111In radioactivity uptake in knees, hind, and front paws, after single injection of 111In‐HPG‐[3H]MTX or 111In‐HPG‐FA‐[3H]MTX in CIA mice. D,E) Area under the time‐activity curves of A to C of 3H and 111In radioactivity uptake. F) Biodistribution of 3H and 111In in blood, heart, liver, kidney, lung, spleen, muscle, and bone after single injection of 111In‐HPG‐[3H]MTX or 111In‐HPG‐FA‐[3H]MTX in CIA mice. 111In and 3H activities were determined and represented as bar graphs showing mean values of percent injected dose per gram organ (%ID/g). Data are presented as means ± SD (n = 3). Comparisons were done with unpaired Student's t‐test and expressed as ns: > 0.05, *p < 0.05, **p < 0.001, ***p < 0.0001, ****p < 0.00001.
Figure 6
Figure 6
FA targeting macromolecular MTX administered biweekly was sufficient to achieve equal therapeutic response as MTX twice weekly in CIA mice. A–C) Changes in the temperature index, paw thickness and clinical score following treatment with HPG‐MTX (weekly and biweekly; 3 mg kg−1 MTX, n = 4), HPG‐FA‐MTX (weekly and biweekly; 3 mg kg−1 MTX, n = 4), MTX (twice weekly, weekly, and biweekly; 3 mg kg−1 MTX, n = 4), and vehicle (n = 4). D–F) Differences in the disease severity among therapeutic groups was expressed as area under the therapeutic assessment curves of A to C. G) Representative images from H&E‐stained ankle joints 28 days after treatment start; Red arrow, inflammatory cell infiltration; blue arrow, synovial hyperplasia; black arrow, cartilage erosion; and yellow arrow, synovial proliferation. Scale bars for all images  =  100 µm. H) Total histology score plotted per group (n = 3). The Y‐axis score is cumulative, where higher scores equal an increase in severity. I–L) Monitoring of indicators for liver and renal toxicity of mice in different treatment groups. Mice liver enzymes ALP, AST, and ALT, as well as the kidney enzyme serum creatinine were detected at baseline, days 7 and 11. There was no significant difference among the groups at the end of study, nor to the control groups treated with saline (Ctl + and Ctl ‐). Data are presented as means ± SD. Comparison between groups were done with unpaired Student's t‐test, one‐way ANOVA with Tukey's post hoc analysis and expressed as ns: > 0.05, *p < 0.05, **p < 0.001, ***p < 0.0001, ****p < 0.00001.

References

    1. Clunie G., Wilkinson N., Nikiphorou E., Jadon D., Oxford Handbook of Rheumatology, Oxford University Press, Oxford: 2018.
    1. Scott D. L., Wolfe F., Huizinga T. W., Lancet 2010, 376, 1094. - PubMed
    1. d'Arcy R., Tirelli N., Polym. Adv. Technol. 2014, 25, 478.
    1. Andersson S. E., Lexmüller K., Johansson A., Ekström G. M., J. Rheumatol. 1999, 26, 2018. - PubMed
    1. van der Heijden J. W., Oerlemans R., Dijkmans B. A., Qi H., van der Laken C. J., Lems W. F., Jackman A. L., Kraan M. C., Tak P. P., Ratnam M., Jansen G., Arthritis Rheum. 2009, 60, 12. - PubMed

MeSH terms