

Efficient and accurate detection of GC-associated miR-96-5p using a competitive lateral flow method based on SERS
- PMID: 39380650
- PMCID: PMC11459275
- DOI: 10.1039/d4ra03880k
Efficient and accurate detection of GC-associated miR-96-5p using a competitive lateral flow method based on SERS
Abstract
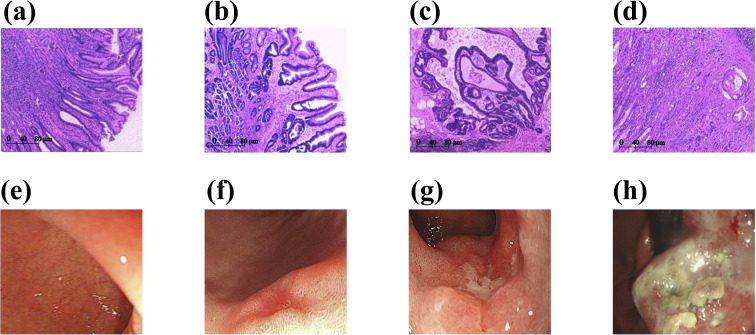
To facilitate rapid, efficient, and accurate detection of miR-96-5p associated with gastric cancer (GC), we developed a bioanalytical platform by integrating surface-enhanced Raman spectroscopy with lateral flow assay (SERS-LFA). With these SERS-LFA strips, miR-96-5p within the specimen competed with Au rhombic dodecahedron (AuRD) conjugated single-stranded DNA (ssDNA) to bond to the immobilized hairpin DNA (hpDNA) probe on the T line. Consequently, higher abundance of miR-96-5p led to reduced conjugation of AuRD on the T line, thereby resulting in diminished SERS intensity. The biosensor exhibited a detection time of approximately 30 min and demonstrated a low limit of detection (LOD) for miR-96-5p in PBS buffer solution, down to 3.7 fM. To validate its clinical utility for the early diagnosis of patients with different degrees of gastric lesions, we performed quantitative evaluations in cohorts that included healthy individuals, patients with mild intraepithelial neoplasia, patients with severe intraepithelial neoplasia, as well as patients diagnosed with GC. The results obtained from the SERS-LFA strips were in agreement with those obtained from the quantitative real-time polymerase chain reaction (qRT-PCR). Given the accomplishments, this biosensor has significant potential for the clinical diagnosis of GC, offering a promising avenue for timely detection and improved patient prognoses.
This journal is © The Royal Society of Chemistry.
Conflict of interest statement
There are no conflicts that need to be declared.
Figures


Similar articles
-
Ultra-sensitive and high efficiency detection of multiple non-small cell lung cancer-related miRNAs on a single test line in catalytic hairpin assembly-based SERS-LFA strip.Anal Chim Acta. 2021 Sep 15;1178:338800. doi: 10.1016/j.aca.2021.338800. Epub 2021 Jun 26. Anal Chim Acta. 2021. PMID: 34482860
-
A novel SERS-lateral flow assay (LFA) tray for monitoring of miR-155-5p during pyroptosis in breast cancer cells.Anal Methods. 2024 Jun 20;16(24):3878-3894. doi: 10.1039/d4ay00363b. Anal Methods. 2024. PMID: 38828902
-
SERS Based Lateral Flow Assay for Rapid and Ultrasensitive Quantification of Dual Laryngeal Squamous Cell Carcinoma-Related miRNA Biomarkers in Human Serum Using Pd-Au Core-Shell Nanorods and Catalytic Hairpin Assembly.Front Mol Biosci. 2022 Feb 11;8:813007. doi: 10.3389/fmolb.2021.813007. eCollection 2021. Front Mol Biosci. 2022. PMID: 35223986 Free PMC article.
-
Sensitive detection of miR-21 and miR-25 in gastric adenocarcinoma patient serum using a SERS sensor based on AuNT and enzyme cleavage strategy.RSC Adv. 2025 Feb 10;15(6):4421-4430. doi: 10.1039/d4ra08761e. eCollection 2025 Feb 6. RSC Adv. 2025. PMID: 39931404 Free PMC article.
-
Simultaneous detection of circulating tumor DNAs using a SERS-based lateral flow assay biosensor for point-of-care diagnostics of head and neck cancer.Biomed Opt Express. 2022 Jul 5;13(8):4102-4117. doi: 10.1364/BOE.463612. eCollection 2022 Aug 1. Biomed Opt Express. 2022. PMID: 36032568 Free PMC article.
Cited by
-
DNA nanotechnology-based strategies for gastric cancer diagnosis and therapy.Mater Today Bio. 2025 Jan 4;30:101459. doi: 10.1016/j.mtbio.2025.101459. eCollection 2025 Feb. Mater Today Bio. 2025. PMID: 39866794 Free PMC article. Review.
References
-
- Sung H. Ferlay J. Siegel R. L. Laversanne M. Soerjomataram I. Jemal A. Bray F. Ca-Cancer J. Clin. 2021;71:209–249. - PubMed
-
- Bray F. Ferlay J. Soerjomataram I. Siegel R. L. Torre L. A. Ca-Cancer J. Clin. 2018;68:394–424. - PubMed
-
- Smyth E. C. Nilsson M. Grabsch H. I. van Grieken N. C. T. Lordick F. Lancet. 2020;396:635–648. - PubMed
-
- Kamangar F. Dores G. M. Anderson W. F. J. Clin. Oncol. 2006;24:2137–2150. - PubMed
-
- Alsina M. Arrazubi V. Diez M. Tabernero J. Nat. Rev. Gastroenterol. Hepatol. 2023;20:155–170. - PubMed
LinkOut - more resources
Full Text Sources
Miscellaneous